A Chart Is Not a Prediction Machine
A price chart looks simple: candles rise, fall and move sideways. But behind every candle are thousands of decisions made by buyers and sellers with different information, time horizons, emotions and risk limits.
Technical analysis tries to organise that market behaviour into a decision framework.
It does not tell you the future with certainty. A better way to think about it is:
Technical analysis helps you identify the current market context, build a probable scenario, define where that scenario is wrong, and decide whether the potential reward is worth the risk.
That is very different from saying, “This pattern guarantees the stock will rise.”
If you have just completed the Stock Market Basics academy, you already know that share prices emerge from the interaction of buyers and sellers. If not, first review How Are Share Prices Decided?. Technical analysis begins where that lesson ends: it studies the visible behaviour created by those orders.
⚡ Quick answer
Technical analysis is the study of price, volume, time and chart behaviour to understand trend, momentum, support, resistance and possible trading setups. Instead of starting with a company’s financial statements or intrinsic value, a technical analyst studies how the market is behaving now and how similar behaviour has developed in the past.
A complete technical process should go beyond recognising patterns. It should define the market context, the setup, the entry, the invalidation or stop level, the potential target and the amount of capital at risk. Technical analysis therefore works best as a probability and risk-management framework, not as a promise of future price movement.
Key takeaways
Technical analysis studies market behaviour, mainly through price, volume and time.
It is generally more useful for timing, trade structure and shorter- to medium-term market decisions than for estimating long-term business value.
Charts organise market data; they do not guarantee what will happen next.
A technical setup is incomplete without an invalidation point — the condition that tells you the original idea is wrong.
Trend, support/resistance, volume, candlesticks, moving averages, RSI, MACD and chart patterns are tools, not independent guarantees.
Multiple indicators that all use similar price data can create the illusion of confirmation without adding much new information.
Technical analysis and fundamental analysis answer different questions and can sometimes be used together.
A valid-looking chart setup can still lose money because of gaps, news, slippage, poor position sizing or changing market conditions.
Risk should be considered before the trade, not after the price moves against you.
SEBI’s FY25–FY26 equity-derivatives study found that 87.7% of individual traders in that segment incurred net losses in FY26 — a reminder that access to charts and indicators does not automatically create a profitable trading process.
Beginners should learn technical analysis in sequence rather than memorising dozens of indicators at once.
What Is Technical Analysis?
Technical analysis is a method of studying market behaviour through price, volume and time. Instead of estimating what a business is fundamentally worth, it examines how buyers and sellers are behaving in the market and uses that information to identify trends, important price zones, momentum, possible setups and conditions that would invalidate an idea.
In practical terms, technical analysis tries to answer questions such as: What direction is price moving? Where have buyers or sellers reacted before? Is participation supporting the move? Where would the setup be proven wrong? And is the potential reward reasonable relative to the planned risk?
Important terms
Terms used in this section
- Price — The current market value at which buyers and sellers are willing to transact.
- Volume — The quantity of shares or contracts traded during a given period, used to judge participation behind a price move.
- Timeframe — The period represented by each candle or bar, such as 5 minutes, 1 hour, daily or weekly.
- Trend — The broad direction of price movement: upward, downward or sideways.
- Support and Resistance — Price zones where buying or selling pressure has previously become important.
- Invalidation — The price or market behaviour that proves a technical setup is no longer valid.
- Risk-Reward — The relationship between the amount you are prepared to lose and the potential gain if the setup succeeds.
Highlight
Probability, Not Certainty
Technical analysis is most useful when it converts an opinion into a testable market scenario.
Instead of saying:
“The stock will rise.”
A better technical statement is:
“The stock is in an uptrend and is testing a prior resistance area. If price breaks and holds above that area with supportive volume, the bullish scenario strengthens. If price falls back below the defined invalidation level, the setup has failed.”
The second statement gives you a condition for being right, a condition for being wrong and a basis for managing risk.
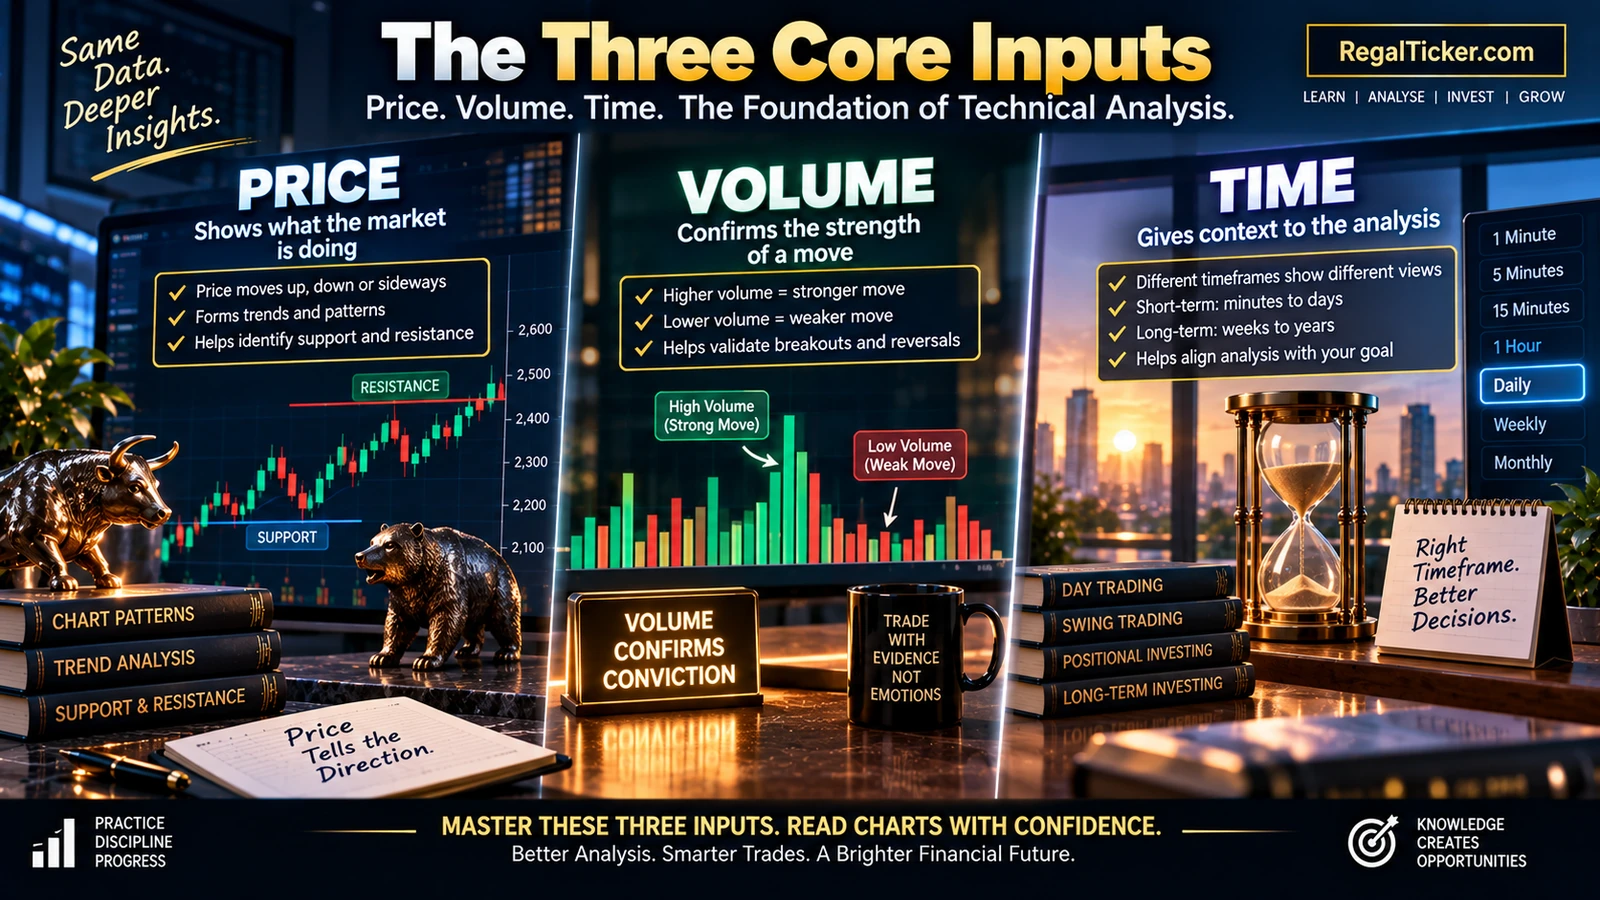
The Three Core Inputs: Price, Volume and Time
Technical analysis can become complicated, but its raw ingredients are surprisingly simple.
Price
Price is the most visible input.
Every market chart is built from traded prices. Depending on the chart type and timeframe, you may see:
- open;
- high;
- low;
- close;
- last traded price;
- percentage change;
- gaps between trading periods.
Price answers the basic question:
Where is the market actually transacting?
Technical analysts then study whether price is forming:
- higher highs and higher lows;
- lower highs and lower lows;
- ranges;
- breakouts;
- breakdowns;
- repeated reaction zones.
The dedicated lesson Trend Analysis: Uptrend, Downtrend and Sideways Market explains directional structure in detail.
Volume
Volume tells you how much trading activity occurred.
A move backed by unusually strong volume may carry different information from the same price move on very light activity.
But volume should not be treated as a magical confirmation switch.
High volume can appear during:
- accumulation;
- distribution;
- panic selling;
- news events;
- breakouts;
- failed breakouts;
- index rebalancing;
- block activity.
The correct question is not simply:
“Is volume high?”
It is:
What is price doing, where is it doing it, and how is volume behaving at the same time?
Go deeper in Trading Volume in the Stock Market.
Time and timeframe
A chart always describes price over a selected period.
The same stock can be:
- bullish on a five-minute chart;
- sideways on an hourly chart;
- bearish on a daily chart.
That is not necessarily a contradiction.
Each timeframe describes a different slice of market behaviour.
A short-term trader may care about intraday structure. A swing trader may focus on hourly and daily charts. A positional trader may place more weight on daily and weekly structure.
⭐ Pro tip
Match the Chart to the Decision
Do not choose a timeframe because it produces the signal you want to see.
Choose the timeframe that matches the decision you are actually making. A five-minute chart should not be used to justify a six-month investment thesis, and a weekly chart may be too slow for a trade you intend to exit within an hour.
How Technical Analysis Works
At a high level, technical analysis converts raw market data into a structured decision.
1
Define the market and timeframe
Choose the stock, index or other traded instrument and use a timeframe that matches the decision you are making.
2
Identify the broad trend
Decide whether price is trending upward, trending downward or moving sideways.
3
Mark important price zones
Identify meaningful support, resistance, previous swing highs, previous swing lows and major breakout areas.
4
Check market participation
Review volume and liquidity to understand whether the price move has meaningful participation.
5
Look for a setup
Look for price action, candlesticks, pullbacks, breakouts, chart patterns, moving-average relationships or momentum conditions.
6
Define invalidation
Decide exactly what price behaviour would prove the original setup wrong.
7
Define the target and risk
Estimate the logical target and compare the potential reward with the planned loss if the setup fails.
8
Size the position
Keep the possible loss within your predefined risk limit rather than choosing quantity only from available capital.
9
Execute the plan
Follow the predefined entry and risk rules instead of changing them because of fear, greed or hope.
10
Review the outcome
Record what happened, what you learned and whether you followed the process, regardless of whether the trade made money.

This workflow is intentionally simple.
The final lesson in this academy, How to Analyse a Stock Technically, brings the individual tools together into a complete technical-analysis checklist.
The Core Assumptions Behind Technical Analysis
Technical analysis is based on several broad assumptions.
These are working principles, not proven laws that guarantee profitable predictions.
1. Price reflects a large amount of available information
Technical analysts generally assume that public information, expectations, positioning and market psychology are expressed through buying and selling decisions and therefore influence price.
This does not mean every piece of information is instantly or perfectly reflected in every security.
It means technical analysis chooses to study the market response rather than independently valuing every underlying cause.
2. Prices can develop trends
Markets often move through identifiable phases:
- upward trends;
- downward trends;
- sideways consolidation.
A trend can persist because information, capital flows and participant behaviour do not all change at the same instant.
3. Behaviour can repeat
Fear, greed, hesitation, loss aversion, momentum chasing and profit-taking are recurring human behaviours.
That helps explain why similar chart structures can appear repeatedly.
But similar-looking structures can produce different outcomes.
❌ Myth
If a chart pattern worked before, it should work again.
✅ Fact
Historical behaviour can provide context, but no pattern has a guaranteed outcome. Market regime, liquidity, volatility, location, volume and broader conditions can change the probability of the setup.
4. Market context matters
A bullish candle at major support after a long decline does not carry the same context as the identical candle after an extended rally into resistance.
Technical analysis is therefore not just pattern recognition.
It is pattern + location + trend + timeframe + confirmation + risk.
Technical Analysis vs Fundamental Analysis
Technical analysis and fundamental analysis are often presented as competitors.
They are better understood as tools designed to answer different questions.
Technical Analysis
- Studies price, volume and market behaviour
- Focuses on trend, momentum and timing
- Uses charts, levels, patterns and indicators
- Helps define entry, invalidation and target
- Commonly used for trading and active timing
- Does not directly calculate intrinsic business value
Fundamental Analysis
- Studies the underlying business
- Focuses on financial quality and long-term value
- Uses revenue, profit, cash flow, debt and valuation
- Helps judge business quality and expected value
- Commonly used for longer-term investment decisions
- Does not directly tell you the best short-term entry price

If your primary question is:
“Is this company financially strong and reasonably valued?”
use What Is Fundamental Analysis?.
If your primary question is:
“What is price doing, where could the setup fail, and how can I structure the trade?”
technical analysis is the more relevant framework.
Investor note
You Do Not Always Have to Choose One
A long-term investor may use fundamental analysis to select a company and then use technical analysis to understand trend, major support/resistance or entry timing.
However, technical strength should not be used to hide a weak long-term investment thesis, and a fundamentally strong company does not automatically make every technical entry attractive.

The Technical Analysis Toolkit
Lesson 1 should help you understand what each tool does without turning into a duplicate of every later lesson.
Candlestick charts
Candlesticks compress open, high, low and close into a visual price structure.
They can help you see:
- buying and selling pressure;
- rejection;
- range;
- momentum;
- indecision.
But one candle is rarely enough.
Learn the full structure in How to Read Candlestick Charts.
Support and resistance
Support is an area where buying interest has previously become strong enough to slow or reverse a decline.
Resistance is an area where selling interest has previously become strong enough to slow or reverse an advance.
They are better treated as zones, not perfect single-price lines.
Read Support and Resistance in the Stock Market.
Trend analysis
Trend analysis asks whether market structure is:
- rising;
- falling;
- range-bound.
This is usually one of the first questions to answer before interpreting any indicator.
Use Trend Analysis: Uptrend, Downtrend and Sideways Market.
Chart patterns
Chart patterns organise repeated price structures into categories such as:
- continuation patterns;
- reversal patterns;
- range formations.
A pattern should be evaluated with trend, location, volume and invalidation — not traded because its shape looks familiar.
Continue with Chart Patterns: Reversal and Continuation.
Trading volume
Volume provides participation context.
It becomes especially useful around:
- breakouts;
- breakdowns;
- reversal areas;
- strong trend moves;
- failed moves.
Read Trading Volume in the Stock Market.
Moving averages
Moving averages smooth price data.
They can help identify:
- trend direction;
- dynamic support/resistance context;
- crossover relationships;
- distance from recent average price.
They are lagging tools because they are calculated from past price data.
Learn more in Moving Averages in the Stock Market.
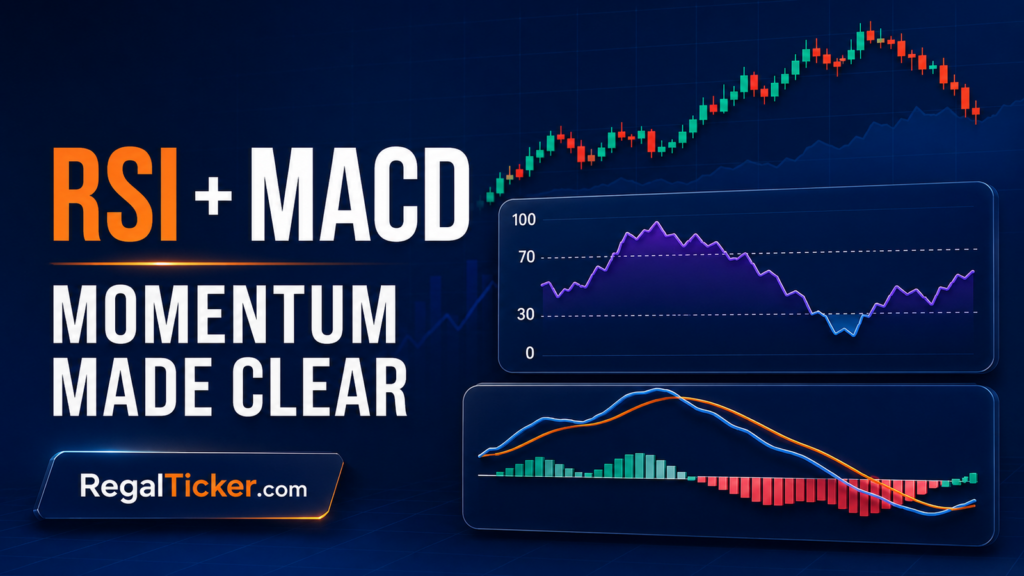
RSI and MACD
RSI and MACD are widely used momentum/trend indicators.
They can help organise information about:
- momentum;
- relative strength;
- trend changes;
- divergences;
- possible overextended conditions.
But indicators should not replace price structure.
See RSI and MACD in the Stock Market.
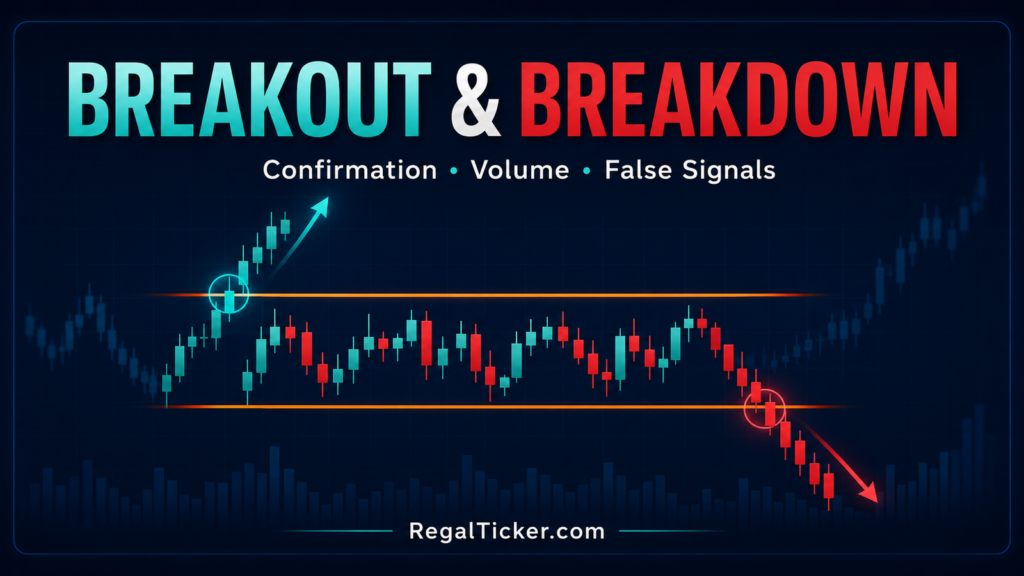
Breakouts and breakdowns
A breakout occurs when price moves above an important resistance or range boundary.
A breakdown occurs when price moves below an important support or range boundary.
The hard part is not identifying a line after the fact.
The hard part is evaluating:
- whether the level matters;
- whether the move is accepted;
- whether participation supports it;
- where the setup becomes invalid;
- whether the potential reward justifies the risk.
Read Breakout and Breakdown in the Stock Market.
⭐ Pro tip
Learn Fewer Tools More Deeply
A clean chart with trend, levels, volume and one or two supporting indicators is often easier to interpret than a screen covered with six momentum tools measuring similar information.
More indicators do not automatically mean more independent confirmation.
A Beginner Technical Analysis Process
A beginner does not need to analyse everything.
A practical sequence is:
Before You Consider a Technical Trade
- Is the broader trend clear?
- Is the security liquid enough for your intended position?
- Have you marked meaningful support and resistance zones?
- Is the setup occurring at a logical location?
- Is volume supportive, neutral or contradictory?
- Are you using indicators only as confirmation rather than as the whole thesis?
- What exact price behaviour invalidates the idea?
- Where is the logical target or next major price zone?
- What is the planned risk-reward relationship?
- Is the position size small enough that the loss is acceptable?
- Are transaction costs and slippage reasonable for the trade?
- Is there an event or gap risk that can make your stop behave differently from expected?
Real Example: Turning a Chart Opinion into a Trade Plan
Consider a hypothetical stock trading near ₹525.
The stock is in an established uptrend and has repeatedly faced resistance near ₹530.
After a short consolidation, price moves above ₹530 while volume expands relative to recent sessions.
A beginner might say:
> “Breakout! Buy.”
A structured technical process asks more.
💡 Real example
Breakout Setup with Defined Invalidation
Assume the trader is considering an entry near ₹532 after price moves above the resistance zone.
The trader notes:
Broader trend: Uptrend Previous resistance zone: Around ₹528–₹530 Possible entry: ₹532 Invalidation / stop: ₹516 Potential target: ₹564 Risk per share: ₹16 Potential reward per share: ₹32
The setup now has a defined condition for being wrong.
If price breaks above resistance but quickly falls back below the invalidation level, the breakout idea has failed even if the trader still likes the company.
🧮 Simple calculation
Risk-Reward for the Example
Entry = ₹532
Stop = ₹516
Risk per share = ₹532 − ₹516 = ₹16
Target = ₹564
Potential reward per share = ₹564 − ₹532 = ₹32
Risk-Reward = ₹16 : ₹32 = 1 : 2
A 1:2 risk-reward ratio means the planned potential reward is twice the planned risk.
It does not mean there is a two-thirds probability of profit, and it does not guarantee the target will be reached.

Use the calculator
Calculate the Setup Before You Trade
Use RegalTicker’s Risk-Reward Calculator to compare entry, stop and target before committing capital. If you trade frequently, also estimate transaction costs with the Brokerage Calculator, because a strategy that looks profitable before costs can produce a very different net result after repeated charges and slippage.
What Technical Analysis Can Help You Do
Technical analysis can be useful for:
1. Organising market information
Charts compress large amounts of price and volume data into a readable structure.
2. Identifying trend
Technical analysis can help distinguish:
- rising structure;
- falling structure;
- range-bound conditions.
3. Planning risk
A major advantage of chart-based analysis is that a setup can often be linked to a specific invalidation level.
4. Improving timing
A fundamentally attractive company can still be in a strong downtrend.
Technical analysis can help an investor understand whether price is stabilising, breaking support or showing improving market participation.
5. Reducing impulsive decisions
A checklist can reduce the temptation to:
- chase a sudden move;
- average a losing trade automatically;
- enter without a stop;
- buy because of social-media excitement.
6. Comparing multiple opportunities
A consistent technical framework lets you compare several charts using the same criteria rather than changing the rules for each stock.
Highlight
The Best Outcome Is Not Always a Trade
Technical analysis should sometimes lead to the decision not to trade.
If the trend is unclear, liquidity is poor, the stop is too wide, the reward is too small or the chart is highly event-sensitive, avoiding the setup can be a valid technical decision.
What Technical Analysis Cannot Do
Technical analysis has real limitations.
It cannot guarantee direction
Every setup can fail.
It cannot eliminate gaps
A stop-loss is an instruction or risk-management tool, not a promise that the market will always exit at the exact intended price.
It cannot fix bad position sizing
A technically valid trade can still create excessive damage if the position is too large.
It cannot make an illiquid stock easy to trade
Charts may look clean even when the bid-ask spread or available depth makes execution difficult.
It cannot explain every cause
Technical analysis may show that price is weakening without telling you whether the cause is earnings, regulation, forced selling, macro news or something else.
It cannot convert indicators into certainty
RSI, MACD, moving averages and other indicators are calculated from market data.
They can organise information but they do not know the future.

Risk
SEBI’s 2026 Derivatives Study Is a Reality Check
SEBI’s FY25–FY26 study of individual traders in the equity derivatives segment found that 87.7% incurred net losses in FY26, with aggregate net losses of about ₹91,685 crore.
This statistic applies specifically to individual equity-derivatives traders. It does not mean that 87.7% of every technical analyst, long-term investor or cash-market participant loses money.
The lesson is narrower but important: access to charts, indicators and leverage does not automatically produce a profitable trading process. Risk management, costs, position sizing, execution and behaviour matter alongside analysis.
For a broader safety framework, use the Stock Market Risk Checklist.
Common Technical Analysis Mistakes
1. Starting with indicators instead of price
Indicators are derived from market data.
Learn trend, price structure and levels first.
2. Using too many indicators
Five tools that all react to momentum can produce five similar signals rather than five independent pieces of evidence.
More indicators make a chart more accurate.
More indicators can create clutter and false confidence. A smaller set of complementary tools is often easier to test, understand and apply consistently.
3. Treating support and resistance as exact numbers
Price often reacts around zones.
A small move through a line does not automatically create a valid breakout.
4. Ignoring timeframe
A bullish signal on a five-minute chart may exist inside a much larger daily downtrend.
5. Entering before defining invalidation
If you decide where to stop only after the stock falls, emotion has already entered the risk decision.
6. Moving the stop because you do not want to lose
Changing the invalidation level after the setup fails can turn a planned trade into an uncontrolled loss.
7. Confusing a technical trade with an investment
A failed trade does not become a long-term investment because you decide to hold it.
Review Investing vs Trading if this distinction is unclear.
8. Ignoring liquidity and costs
Frequent trading in illiquid securities can make spreads, slippage and brokerage more important than the chart itself.
9. Trading every signal
Technical analysis should filter opportunities, not manufacture constant activity.
10. Back-fitting the explanation
After a move happens, almost any chart can be made to look obvious.
The useful test is whether the setup, risk and invalidation were defined before the outcome.
Caution
Do Not Judge a Method from One Trade
A profitable trade can come from a poor process, and a losing trade can come from a well-structured process.
Judge a technical approach across a meaningful sample of trades, including losses, costs, slippage and whether the rules were actually followed.
A Better Learning Order for Beginners
The fastest way to become confused is to jump randomly between indicators.
A cleaner learning path is:
1
Learn chart structure
Start with How to Read Candlestick Charts so you understand how open, high, low and close are represented visually.
2
Learn important price zones
Continue with Support and Resistance in the Stock Market to understand where price has previously reacted.
3
Learn trend structure
Study Trend Analysis: Uptrend, Downtrend and Sideways Market before relying heavily on indicators.
4
Learn recurring chart structures
Move to Chart Patterns: Reversal and Continuation and learn to evaluate patterns in context rather than by shape alone.
5
Add volume context
Learn Trading Volume in the Stock Market to judge participation behind price moves.
6
Add a simple trend indicator
Study Moving Averages in the Stock Market after you already understand price structure and trend.
7
Add momentum tools
Learn RSI and MACD in the Stock Market as supporting tools rather than standalone buy-or-sell signals.
8
Study breakouts and failed moves
Continue with Breakout and Breakdown in the Stock Market to understand confirmation, failure and invalidation.
9
Combine everything into one process
Finish with How to Analyse a Stock Technically and bring trend, levels, volume, indicators, confirmation and risk into one repeatable checklist.
Frequently asked questions
What is technical analysis in simple words?
Technical analysis is the study of price, volume and chart behaviour to understand market direction, momentum, important levels and possible trade setups. It is a decision framework based on probabilities, not a guaranteed prediction of future prices.
What are the main inputs in technical analysis?
The core inputs are price, volume and time or timeframe. Technical tools such as candlesticks, moving averages, RSI and MACD are ways of organising or interpreting that market data.
Is technical analysis only for traders?
No. It is most commonly used for trading and timing decisions, but long-term investors can also use trend, support/resistance and market structure as secondary timing or risk tools. Fundamental analysis should still own the long-term business thesis.
What is the difference between technical and fundamental analysis?
Technical analysis studies price, volume, charts and market behaviour. Fundamental analysis studies the company’s business, financial statements, management, risks and valuation. They answer different questions and can sometimes be used together.
Can technical analysis predict stock prices accurately?
Technical analysis can help identify scenarios and probabilities, but it cannot predict every future price movement accurately. Any setup can fail because market conditions, liquidity, news and participant behaviour can change.
Which technical indicator is best for beginners?
There is no universal best indicator. Beginners usually benefit more from learning price structure, trend, support/resistance and volume before adding a small number of indicators such as moving averages, RSI or MACD.
Are candlestick patterns enough to trade?
No. A candlestick pattern should be evaluated in context, including trend, location, support/resistance, volume, timeframe, invalidation and risk-reward.
What does invalidation mean in technical analysis?
Invalidation is the price behaviour or condition that tells you the original setup is no longer valid. Defining invalidation before entering a trade helps prevent emotion from deciding when to exit.
Is a 1:2 risk-reward ratio always good?
Not automatically. A 1:2 ratio means the planned reward is twice the planned risk, but it says nothing by itself about the probability of success, execution quality or whether the setup has a positive long-term expectancy.
Why do technical-analysis trades still lose money?
Technical analysis works with probabilities. Trades can fail because of false breakouts, gaps, changing market conditions, poor liquidity, slippage, excessive leverage, weak position sizing or simple randomness.
Can I use technical analysis for long-term investing?
Yes, as a secondary timing and risk-context tool. But a long-term investment thesis should normally be based on business quality, financial strength, valuation and portfolio fit rather than charts alone.
How should a beginner start learning technical analysis?
Start with candlesticks, support/resistance and trend. Then add volume, chart patterns, moving averages and momentum indicators. Finally combine the tools into a repeatable checklist with predefined risk.
Verify through official sources
Official references
Final takeaway
Technical Analysis Is a Process, Not a Prediction
Technical analysis becomes useful when it forces you to answer four questions before risking capital:
1. What is the market doing? 2. What is my setup? 3. What would prove the setup wrong? 4. Is the potential reward worth the risk?
If those questions are clear, charts become a decision tool.
If they are not clear, adding more indicators rarely solves the problem.
Educational disclaimer: This article is for investor education and general information only. It is not investment advice, a research recommendation or a trading strategy. Technical-analysis setups can fail, stop-loss orders may execute differently from the intended price during fast or gapping markets, and market-linked positions can lose capital. Verify current regulatory information through SEBI, recognised exchanges and registered intermediaries before acting.