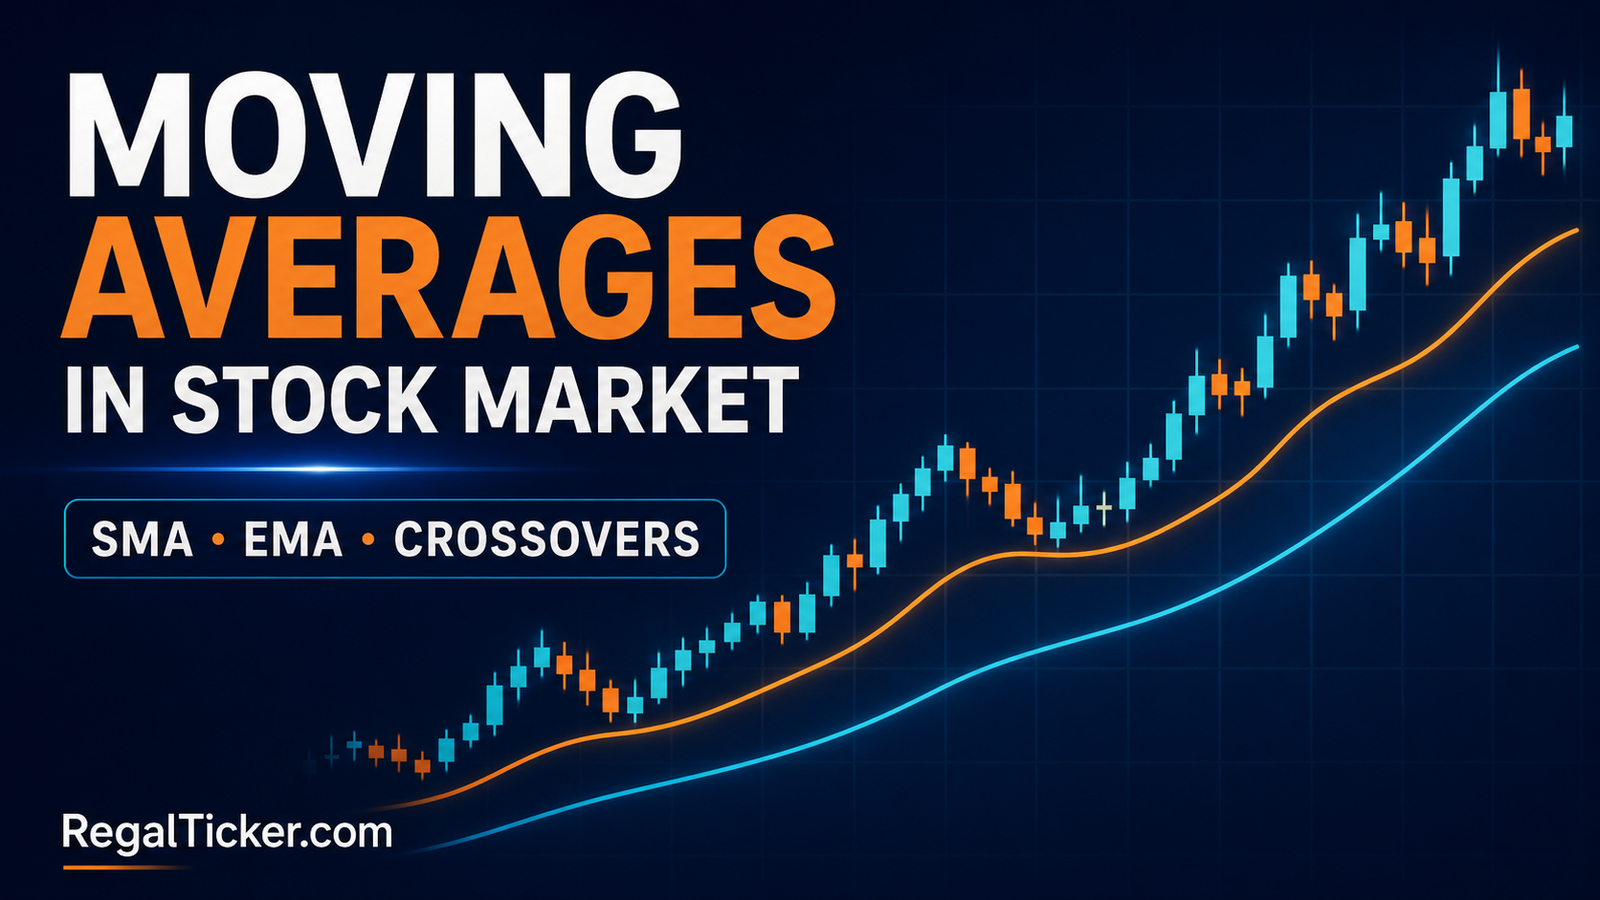
Moving averages in stock market analysis smooth a sequence of prices into a single line. That line helps you see the underlying direction when daily candles look noisy, compare short-term movement with a longer trend and identify changes that deserve closer examination.
Imagine a share that closes at ₹100, ₹103, ₹101, ₹105 and ₹107 across five sessions. The individual prices move up and down. Their five-session average is ₹103, which gives a calmer view of the recent level. When a new closing price arrives, the oldest observation leaves the calculation and the average “moves” forward.
This simplicity makes moving averages popular, but it also creates their biggest limitation: they are calculated from prices that have already occurred. A moving average confirms and organises price behaviour; it does not know the next price.
Before using an indicator, understand What Is Technical Analysis? Meaning, Tools and Examples, How to Read Candlestick Charts: A Beginner’s Guide and Trend Analysis: Uptrend, Downtrend and Sideways Market. Moving averages work best when they support price structure—not when they replace it.
What Are Moving Averages in Stock Market Analysis?
A moving average is the average price of a security over a selected number of chart periods. Most charting platforms calculate it from closing prices by default, although some allow open, high, low, typical price or another data source.
On a daily chart, a 20-period moving average uses 20 trading sessions. On a one-hour chart, it uses 20 one-hour bars. “20-period” does not automatically mean 20 calendar days.
SEBI’s investor-education material lists moving averages among popular technical indicators and notes the 50-day and 200-day averages as examples used to identify trend direction: SEBI Investor — Technical vs Fundamental Analysis. NSE’s Technical Analysis Module outline separately includes simple and exponential moving averages, moving-average settings, price crossovers and multiple-average signals: NSE Technical Analysis Module.
What a Moving Average Can Show
A moving average can help you examine:
- whether price is generally rising, falling or moving sideways;
- whether price is above or below its recent average;
- whether a short-term trend is strengthening or weakening relative to a longer trend;
- whether a pullback is approaching a widely observed reference area;
- whether a crossover has confirmed a change that price has already begun.
It can also create a consistent rule for research. For example, instead of describing a chart as “looking strong,” you can ask whether price is above a rising 50-period average and whether swing structure still shows higher highs and higher lows.
What It Cannot Tell You
| A moving average can help assess | A moving average cannot prove |
|---|---|
| Direction of smoothed historical prices | Where the next candle will close |
| Relationship between price and its recent average | That a crossover must become a profitable trade |
| Whether short-term movement is above a longer trend | Why the price moved |
| Possible dynamic support or resistance areas | That the line will hold exactly |
| A repeatable condition for testing | That one setting works for every stock and timeframe |
The line does not assess earnings, cash flow, debt, valuation, corporate governance or business quality. Those questions belong to fundamental analysis. An investor may use fundamental analysis to decide what deserves study and a moving average to understand price context, but neither method removes risk.
Why Moving Averages Lag
Every value in the line comes from historical price data. A longer lookback includes more old observations and usually responds more slowly. A shorter lookback reacts faster, but it also follows more market noise.
This trade-off cannot be eliminated:
- Faster average: earlier response, more false changes.
- Slower average: smoother trend, later response.
A lagging indicator is not automatically useless. A rear-view mirror is also backward-looking, yet it provides context. The mistake is expecting a moving average to behave like a forecast.
SMA vs EMA: Calculation and Practical Difference
The two moving averages beginners encounter most often are the simple moving average (SMA) and exponential moving average (EMA). Both use past prices, but they assign weight differently.
Simple Moving Average Formula
An SMA gives equal weight to every observation in the selected window:
SMA = Sum of prices over n periods ÷ n
Suppose five daily closing prices are:
| Session | Closing price |
|---|---|
| 1 | ₹100 |
| 2 | ₹102 |
| 3 | ₹101 |
| 4 | ₹105 |
| 5 | ₹107 |
The five-day SMA is:
(₹100 + ₹102 + ₹101 + ₹105 + ₹107) ÷ 5 = ₹103
If the next closing price is ₹109, the oldest price—₹100—leaves the window:
(₹102 + ₹101 + ₹105 + ₹107 + ₹109) ÷ 5 = ₹104.80
The average moves from ₹103 to ₹104.80. The calculation is transparent, stable and easy to reproduce.
Exponential Moving Average Formula
An EMA assigns more weight to recent prices. A commonly used smoothing multiplier is:
Multiplier = 2 ÷ (n + 1)
The updated EMA is then:
Current EMA = (Current price × multiplier) + (Previous EMA × (1 − multiplier))
For a five-period EMA:
Multiplier = 2 ÷ (5 + 1) = 0.3333
If the previous EMA is ₹103 and the new close is ₹109:
Current EMA = (₹109 × 0.3333) + (₹103 × 0.6667) ≈ ₹105
Because the new price receives greater weight, the EMA responds sooner than the five-period SMA in this example. Platforms usually seed the first EMA with an SMA or another initial value. Very early plotted values can vary slightly depending on available history, but the difference generally fades as more data accumulates.
SMA vs EMA Comparison
| Feature | SMA | EMA |
|---|---|---|
| Weighting | Equal weight to every price in the window | More weight to recent prices |
| Responsiveness | Slower | Faster |
| Smoothness | Usually smoother | Usually follows price more closely |
| Reaction to a sudden price change | More gradual | Quicker |
| Common weakness | Can confirm a turn late | Can whipsaw more often |
| Universally better? | No | No |
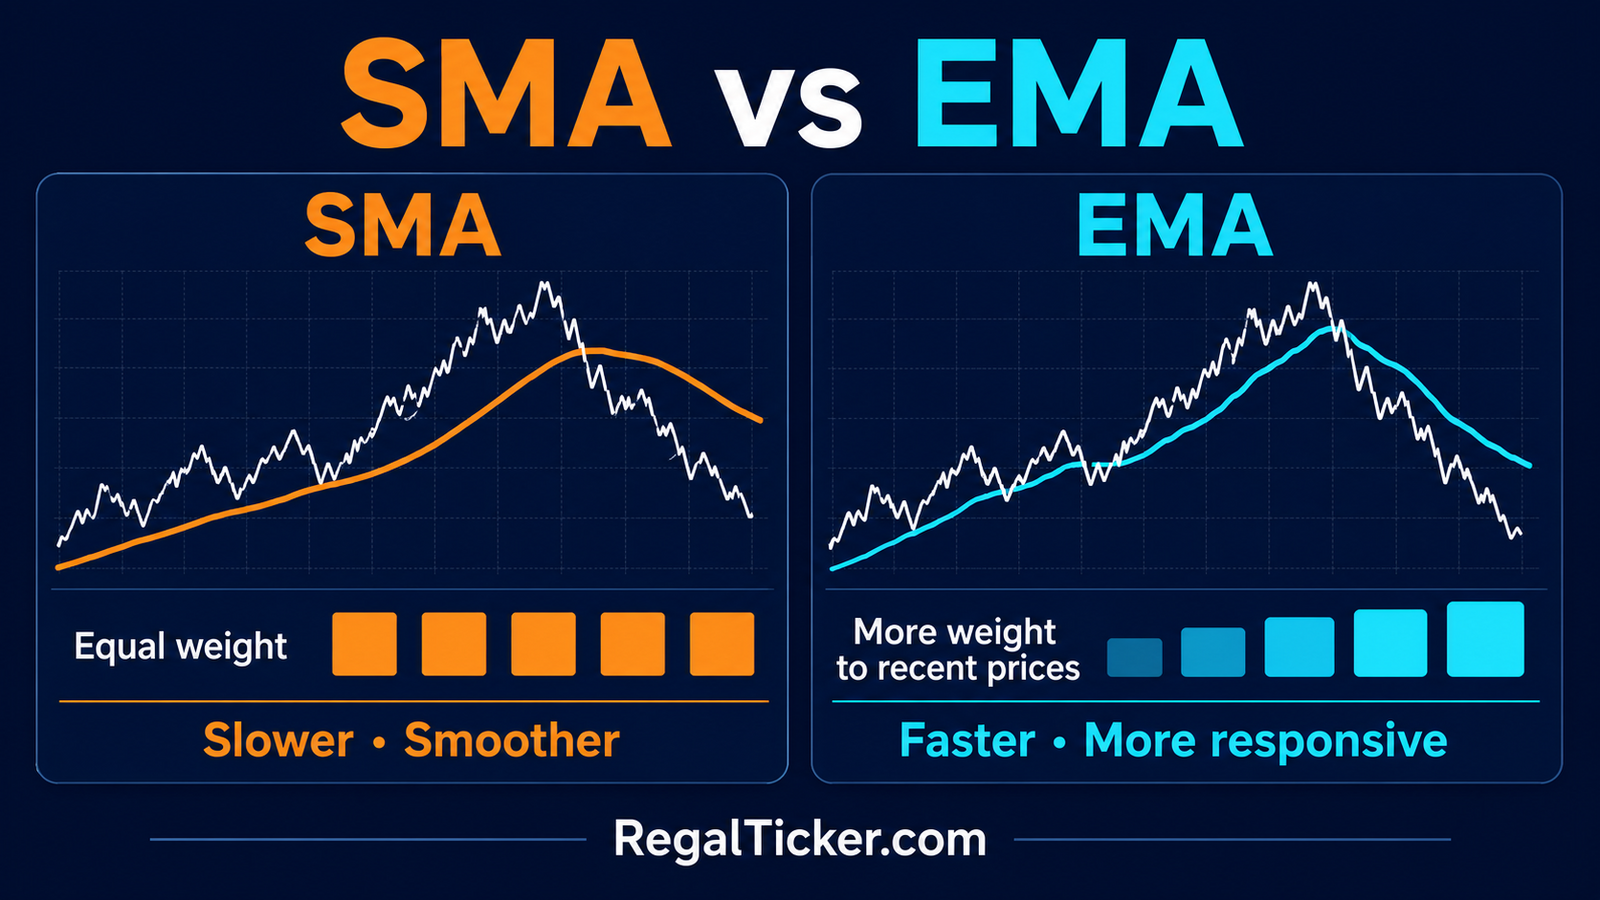
The correct choice is not “EMA for traders and SMA for investors” in every case. A long-period EMA can be slower than a short-period SMA. Period length, timeframe, instrument and market condition all influence behaviour.
If two analysts use different moving-average types, they may receive different crossover dates. Document your method before testing it; do not switch between SMA and EMA after seeing which one would have produced the more attractive historical result.
How to Choose the Period and Timeframe
Moving-average settings such as 10, 20, 50, 100 and 200 are conventions—not natural laws. The right period depends on the question, holding horizon and chart interval.
What 20, 50 and 200 Periods Usually Represent
| Setting | Common use | Important limitation |
|---|---|---|
| 10 or 20 periods | Short-term rhythm and quicker trend changes | Highly sensitive in a choppy market |
| 50 periods | Intermediate trend context | Still lags a sudden reversal |
| 100 periods | Broader medium-to-long trend | Less responsive to recent changes |
| 200 periods | Long-term reference on daily charts | Can be far from current price and very late |
These labels describe common practice, not a recommendation. A 200-period average on a five-minute chart is not equivalent to a 200-day moving average. A 20-week average is also very different from a 20-day average.
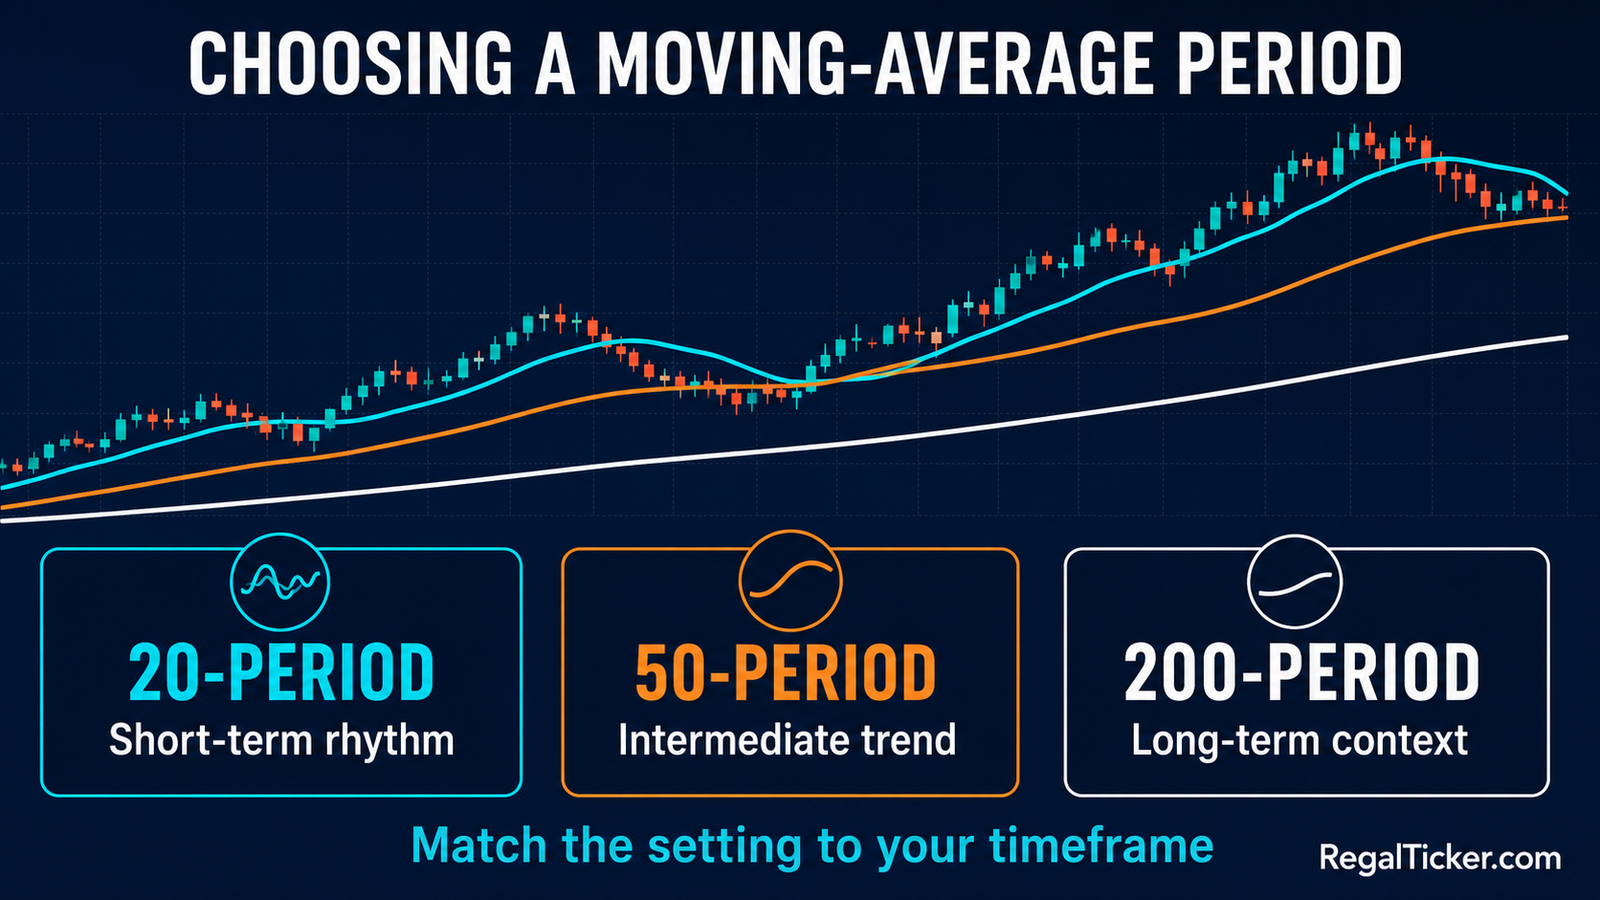
Match the Setting to the Decision
Start with the decision you are trying to make:
- What is the chart timeframe?
- What is the expected holding period?
- Do you want a faster signal or a smoother filter?
- Is the stock trending or repeatedly ranging?
- How will you confirm and invalidate the signal?
An investor studying a multi-year trend may prioritise weekly price structure and a long-period average. A swing trader may compare daily price with 20- and 50-period averages. An intraday trader may use shorter settings, but shorter bars also contain more noise and transaction costs become more important.
Use Consistent and Adjusted Data
Moving averages depend completely on their input. Check that:
- the exchange and security are correct;
- the chart uses the intended timeframe;
- the data series has enough history;
- corporate actions are adjusted appropriately;
- missing or illiquid sessions are understood;
- the price source is consistent during testing.
A stock split, bonus issue or similar corporate action can create an artificial historical gap if old prices are not adjusted. That gap can distort an average and generate a meaningless crossover. Use a reliable adjusted series when comparing prices across such events.
NSE provides security-wise historical price and volume information through its Equity Security-wise Archives. The calculation is simple, but the quality and consistency of the underlying data still matter.
Do Not Optimise Until the Past Looks Perfect
If a 47-period EMA happened to catch every visible turn on one historical chart, that does not make it a universal setting. Excessive adjustment to past data is curve fitting.
A stronger research process tests:
- multiple market phases;
- trending and sideways conditions;
- several securities with different liquidity;
- realistic brokerage, taxes, slippage and gaps;
- rules that were defined before the test;
- data that was not used to design the rule.
The purpose is not to find a line that explains yesterday perfectly. It is to discover whether a repeatable method remains useful under conditions it has not memorised.
How to Use Moving Averages in Stock Market Analysis
Moving averages in stock market charts can be read in several ways. None should become a standalone instruction to buy or sell.
Direction and Slope
A rising average shows that its underlying price window is increasing. A falling average shows that the window is decreasing. A nearly flat average suggests limited net progress across the selected lookback.
Slope is more useful with price structure:
- Price above a rising average plus higher highs and higher lows supports an uptrend reading.
- Price below a falling average plus lower highs and lower lows supports a downtrend reading.
- A flat average repeatedly crossed by price suggests a sideways or unstable condition.
Read Trend Analysis: Uptrend, Downtrend and Sideways Market before treating slope as evidence. The swing structure explains the trend; the average summarises it.
Price Above or Below the Average
Price above an average means the current price is above that historical reference. It does not automatically mean “overvalued” or “buy.” Price below it does not mean “cheap” or “sell.”
A price crossover can still be useful as an alert:
- Price closes above a rising average.
- The chart also regains a prior resistance or forms a higher low.
- Volume and follow-through support the move.
- A clear level exists where the idea becomes invalid.
This sequence carries more evidence than an intraday wick briefly touching the line.
Dynamic Support and Resistance
Traders sometimes describe moving averages as dynamic support or resistance. In an uptrend, pullbacks may repeatedly stabilise near a rising average. In a downtrend, rallies may struggle near a falling average.
Treat this as an area of observation, not a guaranteed floor or ceiling. The average changes each period and price can overshoot it. A more robust reading combines the line with:
- a prior swing high or swing low;
- a horizontal support or resistance zone;
- a trendline or pattern boundary;
- a candlestick reaction;
- trading volume and follow-through.
Learn the difference between a level and a zone in Support and Resistance in the Stock Market: Beginner’s Guide.
Moving-Average Ribbon or Alignment
Some analysts use several averages together. A bullish alignment might place a short average above an intermediate average, which is above a long average, with all three rising. Bearish alignment reverses that order.
Alignment shows that several lookbacks agree on direction. It can also become crowded information because every line is derived from the same price series. Adding five similar averages does not create five independent confirmations.
Keep only the lines that answer distinct questions. If two settings lead to the same decision nearly every time, one may be unnecessary.
Moving Average Crossovers, Golden Cross and Death Cross
A crossover occurs when one plotted series moves from one side of another to the opposite side. There are two main types.
Price–Moving Average Crossover
Price crossing above a moving average shows that the latest price has moved above its selected historical average. Price crossing below shows the opposite.
Faster settings create more crossovers and more false signals. Slower settings reduce noise but enter and exit later. In a strong trend, a crossover rule can keep attention aligned with direction. In a range, it can switch repeatedly.
Wait for the period to close if your rule is based on closing prices. A daily candle can cross above the average during the session and finish below it.
Fast–Slow Moving Average Crossover
This method compares a shorter, faster average with a longer, slower average:
- Fast average crosses above slow average: recent prices have strengthened relative to the longer window.
- Fast average crosses below slow average: recent prices have weakened relative to the longer window.
The crossover confirms that the relationship has changed. Because both lines lag price, the actual market turn may have begun well before the cross appears.
Golden Cross and Death Cross
A golden cross commonly refers to the 50-day moving average crossing above the 200-day moving average. A death cross commonly refers to the 50-day average crossing below the 200-day average.
| Signal | Line relationship | Usual interpretation | What it does not guarantee |
|---|---|---|---|
| Golden cross | 50-day MA crosses above 200-day MA | Longer-term trend evidence has improved | Price will continue rising |
| Death cross | 50-day MA crosses below 200-day MA | Longer-term trend evidence has weakened | A crash or permanent decline |
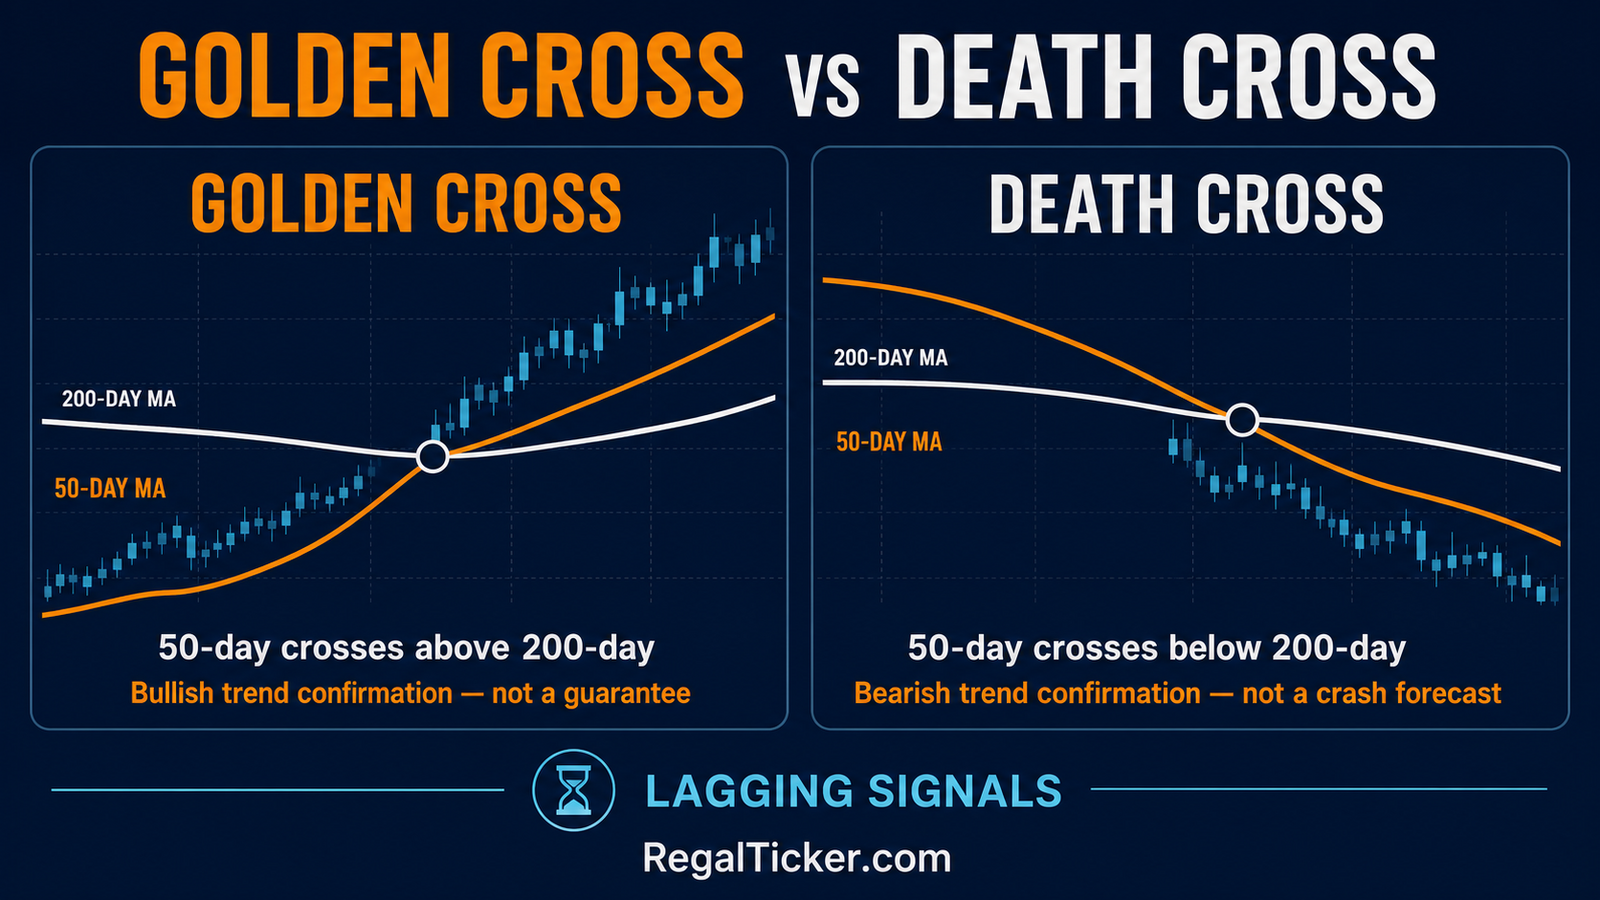
The names sound dramatic, but both signals are mathematical outcomes of previous price movement. A golden cross can arrive after a substantial rally. A death cross can arrive after a substantial fall. Either can fail if price reverses again.
Analyse what happened before the cross:
- Did price already break meaningful support or resistance?
- Are the 50-day and 200-day averages rising, falling or flat?
- Is the cross decisive or are the lines almost horizontal?
- Did volume expand during the underlying price move?
- Is a major result, announcement or market-wide event driving the change?
- Does the higher-timeframe structure agree?
The signal’s context matters more than its dramatic label.
Crossovers and Chart Patterns
A crossover occurring during a valid pattern breakout can add context, but it does not validate a poorly drawn pattern. First identify the formation and its boundary using Chart Patterns Explained: Reversal and Continuation Patterns. Then ask whether the average supports the same direction.
Avoid counting related evidence twice. A breakout, rising short average and bullish crossover may all be consequences of the same recent price advance—not three independent facts.
Confirmation, Risk and a Practical Workflow
The most responsible use of moving averages is as one layer inside a complete process.
A Seven-Step Moving-Average Check
- Define the timeframe. A daily setup must be evaluated using daily rules.
- Read price structure first. Mark trend, swings, support and resistance.
- Choose the average in advance. Record SMA or EMA, period and price source.
- Wait for confirmation. If the rule uses closing price, wait for the candle to close.
- Check participation and context. Review volume, disclosures, results and broad-market conditions.
- Define invalidation. Decide what price behaviour would prove the idea wrong.
- Control risk. Position size must reflect the distance to invalidation and the loss you can tolerate.
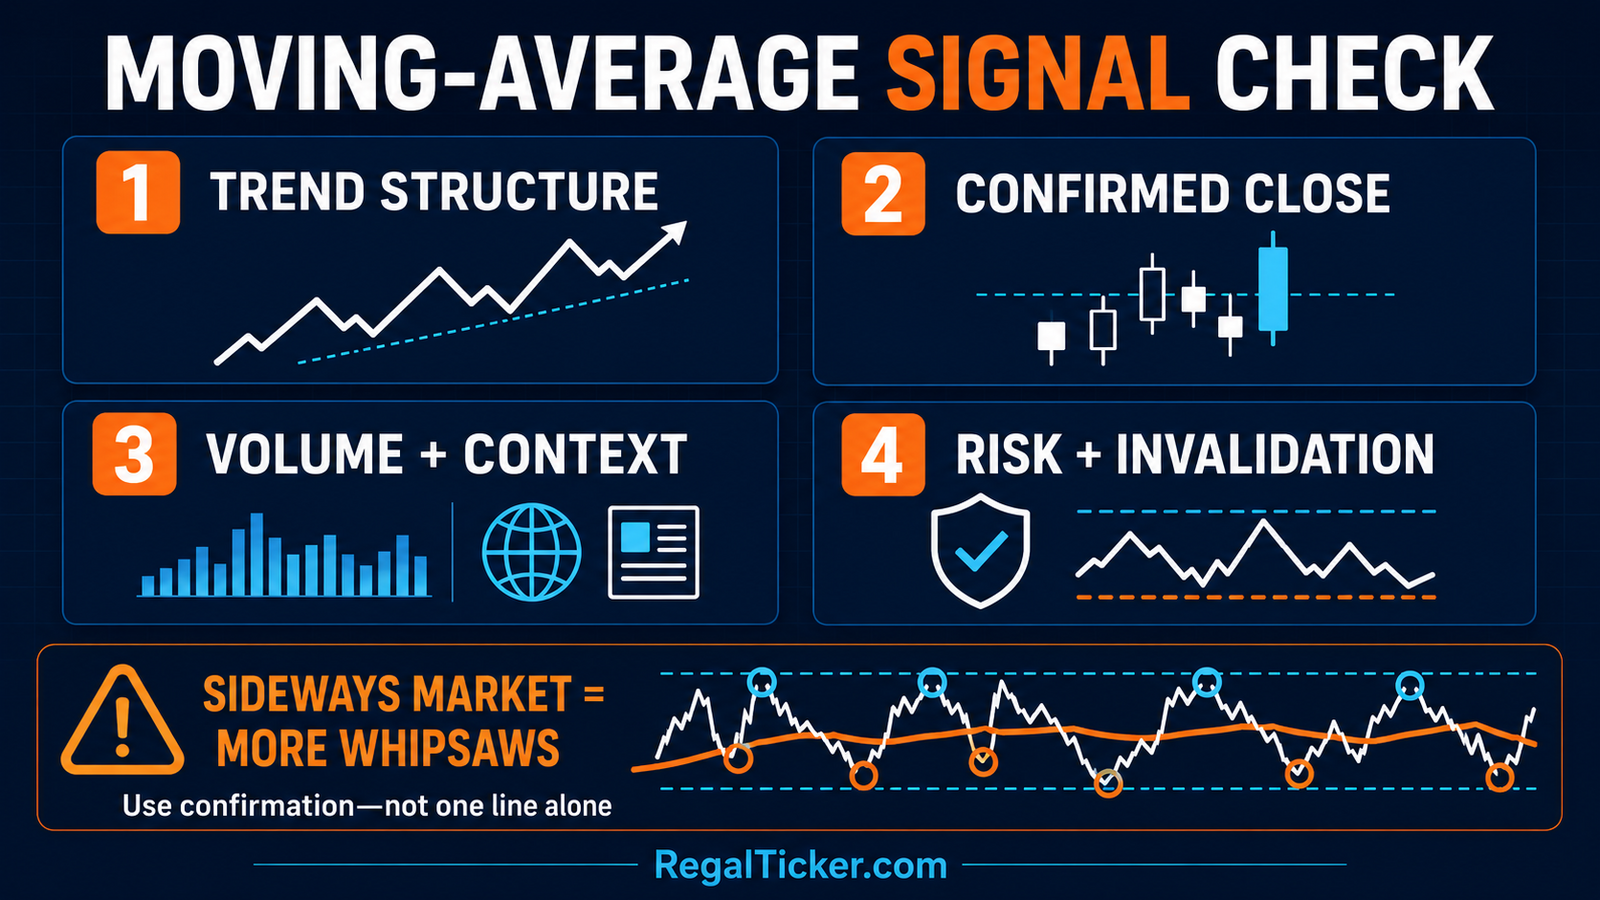
The visual signal is only step four. A moving average cannot choose position size, prevent a gap, verify an announcement or protect against a false breakout.
Combine Price, Volume and Context
Suppose price closes above a 50-day average. Compare two situations:
| Situation A | Situation B |
|---|---|
| Average is rising | Average is flat |
| Price forms a higher low | Price remains inside a sideways range |
| Resistance also breaks | Resistance remains overhead |
| Volume expands | Volume is unusually weak |
| Follow-through holds above the level | Price immediately returns below the line |
Situation A contains several mutually supportive observations. Situation B is vulnerable to whipsaw. Study participation in Trading Volume in Stock Market: How to Confirm Price Movements.
Use an Invalidation Level, Not Blind Faith
An invalidation level is a price or structure condition that tells you the original interpretation is no longer valid. It may be:
- below a meaningful higher low in an uptrend;
- above a meaningful lower high in a downtrend;
- back inside a broken range;
- beyond a pattern boundary;
- or another rule defined and tested before entry.
The moving average itself may be part of the rule, but it should not be moved after the fact merely to avoid acknowledging a failed setup.
Backtest Before Depending on a Rule
A chart screenshot can make any crossover look convincing. A proper test must include every qualifying signal, not only successful examples.
Record:
- entry and exit definition;
- closing or intraday execution;
- brokerage, taxes and slippage;
- gaps and suspended trading;
- losing streaks and maximum drawdown;
- performance by market condition;
- comparison with a simple benchmark.
Past performance does not ensure future results, and a backtest can be misleading if its rules change after each failure.
Limitations and Common Mistakes
Moving averages are simple, but misuse often comes from expecting too much from them.
Whipsaw in Sideways Markets
When price has no sustained direction, it can cross above and below an average repeatedly. Each change may look like a fresh signal and then fail. This is called whipsaw.
Signs of a poor environment for a trend-following average include:
- a flat or frequently changing slope;
- overlapping candles on both sides of the line;
- repeated failed breaks of the same range;
- averages tightly tangled together;
- low follow-through after crossovers.
The solution is not always a faster average. A faster line can create even more signals. Sometimes the best conclusion is that the market condition does not suit the method.
Treating the Average as an Exact Price
If a 50-day average is ₹500, price does not have to reverse at exactly ₹500. Different platforms, adjustment methods and SMA/EMA choices can produce slightly different values. Real markets also overshoot reference areas.
Use the average as context alongside nearby structure, rather than placing unlimited confidence in one decimal point.
Assuming “Above 200-Day” Means Safe
Price above a 200-day average can still fall sharply. Price below it can recover. Long averages reduce noise; they do not remove business, liquidity, event or valuation risk.
Check company quality, market capitalisation and trading conditions separately. Technical position cannot convert a weak or fraudulent business into a safe investment.
Indicator Overload
SMA, EMA, MACD and several crossover systems may all rely on the same underlying prices. Stacking them can create the illusion of independent confirmation.
Use a compact framework:
- price structure for direction;
- one trend tool if it adds clarity;
- volume for participation;
- a defined risk rule;
- fundamental or event context where relevant.
The next Technical Analysis lesson will explain RSI and MACD as momentum tools and will distinguish what they add from what a basic moving average already shows.
Ignoring Liquidity and Execution
A moving-average line can look smooth on an illiquid stock even when actual execution is difficult. Wide spreads, sparse trades, price gaps and lower depth can materially change results.
Candles and averages represent recorded prices; they do not promise that your full order can execute at the plotted level. Review order mechanics through Bid Price, Ask Price, Spread and Order Book Explained and use the RegalTicker Investor Tools for calculation support—not as a substitute for judgment.
Frequently Asked Questions
Which Moving Average Is Best for Beginners?
There is no universally best average. A 20-period average is faster, a 50-period average provides intermediate context and a 200-period average is a slower long-term reference on daily charts. Beginners should choose one simple setting that matches the timeframe, understand its behaviour and test it before adding more lines.
Is EMA Better Than SMA?
EMA reacts faster because it weights recent prices more heavily. SMA is generally smoother because every observation in the window has equal weight. Faster is not automatically better: an EMA can respond earlier but also whipsaw more frequently. The better choice is the one that suits a clearly defined, tested method.
What Is the Difference Between a 50-Day and 200-Day Moving Average?
The 50-day average reflects a shorter price window and usually changes faster. The 200-day average includes much more history and changes more slowly. Their relationship is often used for longer-term trend context, including the golden cross and death cross.
Does a Golden Cross Mean I Should Buy?
No. A golden cross is a lagging confirmation that a shorter average has moved above a longer average, commonly the 50-day above the 200-day. Examine price structure, valuation or event context, volume, risk and the possibility that much of the advance has already occurred.
Does a Death Cross Predict a Market Crash?
No. A death cross commonly shows the 50-day average falling below the 200-day average. It confirms prior weakness but cannot predict the size or duration of a decline. Some death crosses are followed by further falls; others whipsaw or occur near a recovery.
Can Moving Averages Work in a Sideways Market?
They can describe the average level, but trend-following signals often perform poorly when price repeatedly crosses a flat line. Support and resistance zones or a decision to wait for a valid range break may be more useful than reacting to every crossover.
Should Moving Averages Use Closing Price?
Closing price is the common default and keeps calculations consistent, but some platforms allow other sources. The important rule is to know which price source is selected and use it consistently in research and live decisions.
Are Moving Averages Useful for Long-Term Investors?
They can provide trend and risk context, but they do not analyse the company. A long-term investor should still examine financial statements, business quality, management, valuation and portfolio fit. The average can support timing or monitoring; it cannot replace the investment thesis.
Key Takeaways
- Moving averages smooth historical prices; they do not forecast the next price.
- SMA weights each observation equally, while EMA gives more weight to recent prices.
- A shorter period reacts faster and creates more noise; a longer period is smoother and slower.
- Match the moving-average setting to the chart timeframe and decision horizon.
- Read slope and price position together with swing structure, support and resistance.
- A golden cross commonly means the 50-day average crossed above the 200-day; a death cross means it crossed below.
- Crossovers are lagging confirmations, not automatic buy or sell instructions.
- Sideways markets create frequent whipsaws.
- Confirm signals with closing price, volume, context and a clear invalidation rule.
- Use adjusted, consistent data and test complete rules with realistic costs.
Moving averages in stock market analysis are valuable precisely because they are simple. Used with discipline, they reduce noise and make a trend easier to describe. Used without context, the same simplicity can produce false confidence. Let price structure lead, let the average summarise, and let risk management decide how much uncertainty you can accept.