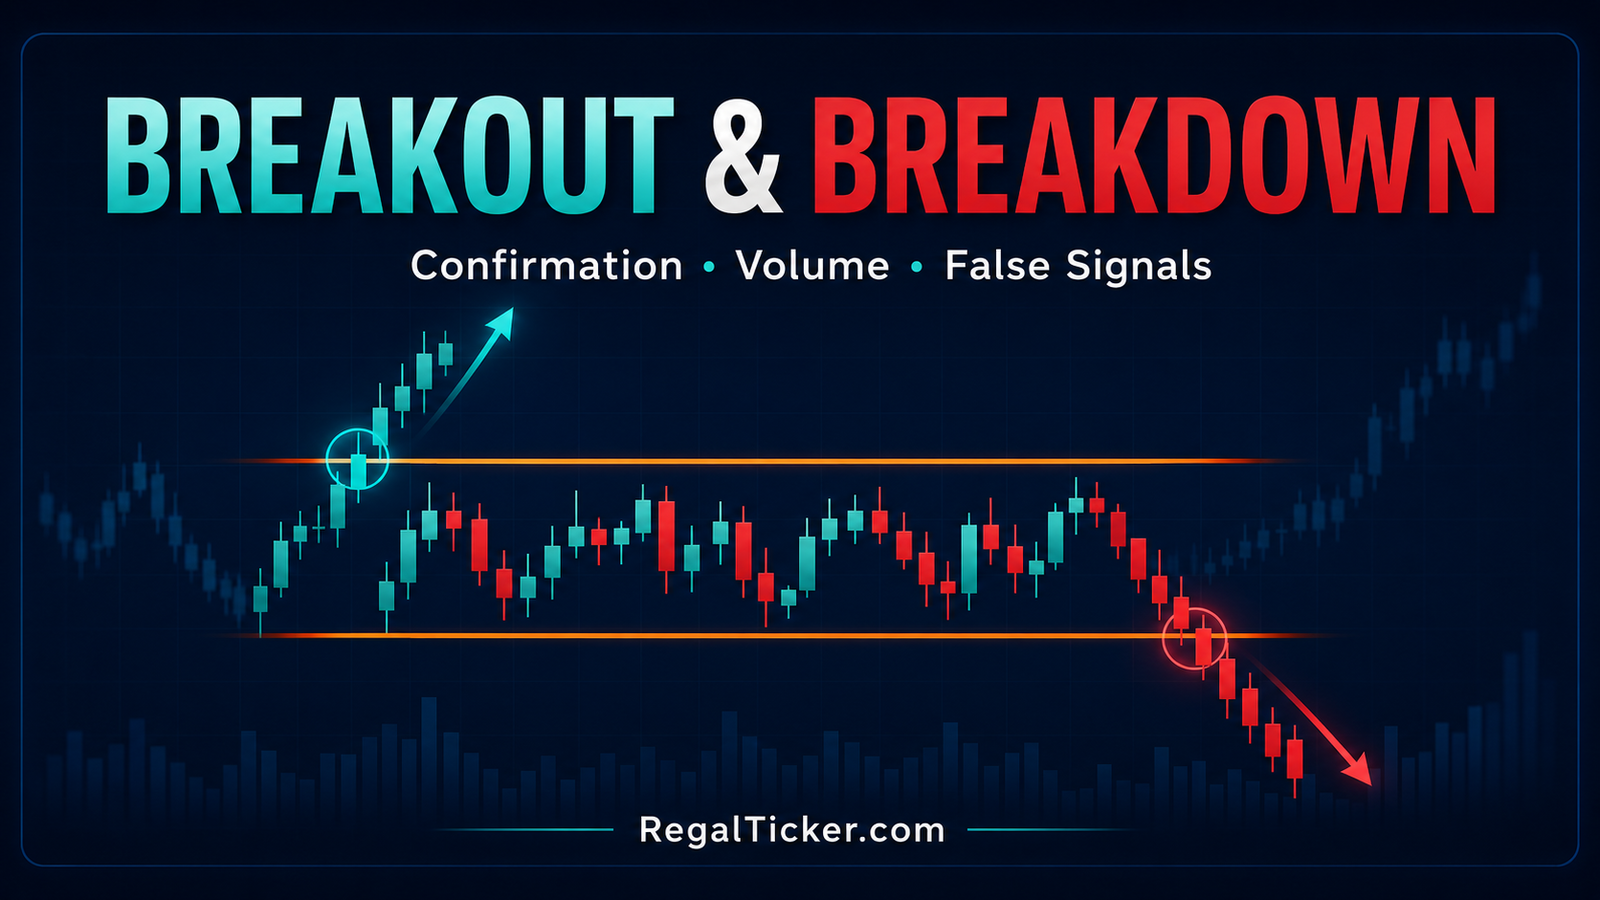
Breakout and breakdown in stock market analysis describe price moving beyond a well-observed resistance or support area. An upside breakout occurs when price crosses above resistance; a downside breakdown occurs when price crosses below support. The crossing itself is only the first event. The real analytical work is deciding whether the market has accepted prices outside the old range or is likely to retreat back inside it.
That distinction matters because charts are full of brief level violations. A candle may push above resistance during the session, attract late buying and close back below it. Price may fall under support in a volatile opening, recover quickly and finish within the range. These failed moves are commonly called false breakouts, fakeouts or bear/bull traps.
A careful analyst therefore asks several questions:
- Was the support or resistance area meaningful before the move?
- Did the candle close beyond the level, or did only its wick cross?
- Was participation stronger than normal?
- Did price hold outside the range on the next bars?
- If a retest occurred, did the former level change its role?
- Where would the setup be invalidated?
- Is the potential loss acceptable before any entry is considered?
This lesson builds directly on Support and Resistance in the Stock Market: Beginner’s Guide, Trend Analysis: Uptrend, Downtrend and Sideways Market, Chart Patterns Explained: Reversal and Continuation Patterns and Trading Volume in Stock Market: How to Confirm Price Movements. Read those foundations first if levels, market structure, patterns or volume are still unfamiliar.
What Is Breakout and Breakdown in Stock Market Analysis?
A breakout or breakdown is best understood as a change in where price is being accepted.
Imagine a share trading between ₹480 support and ₹500 resistance for several weeks. Buyers have repeatedly appeared near ₹480, while sellers have repeatedly stopped advances near ₹500. The range contains the ongoing negotiation.
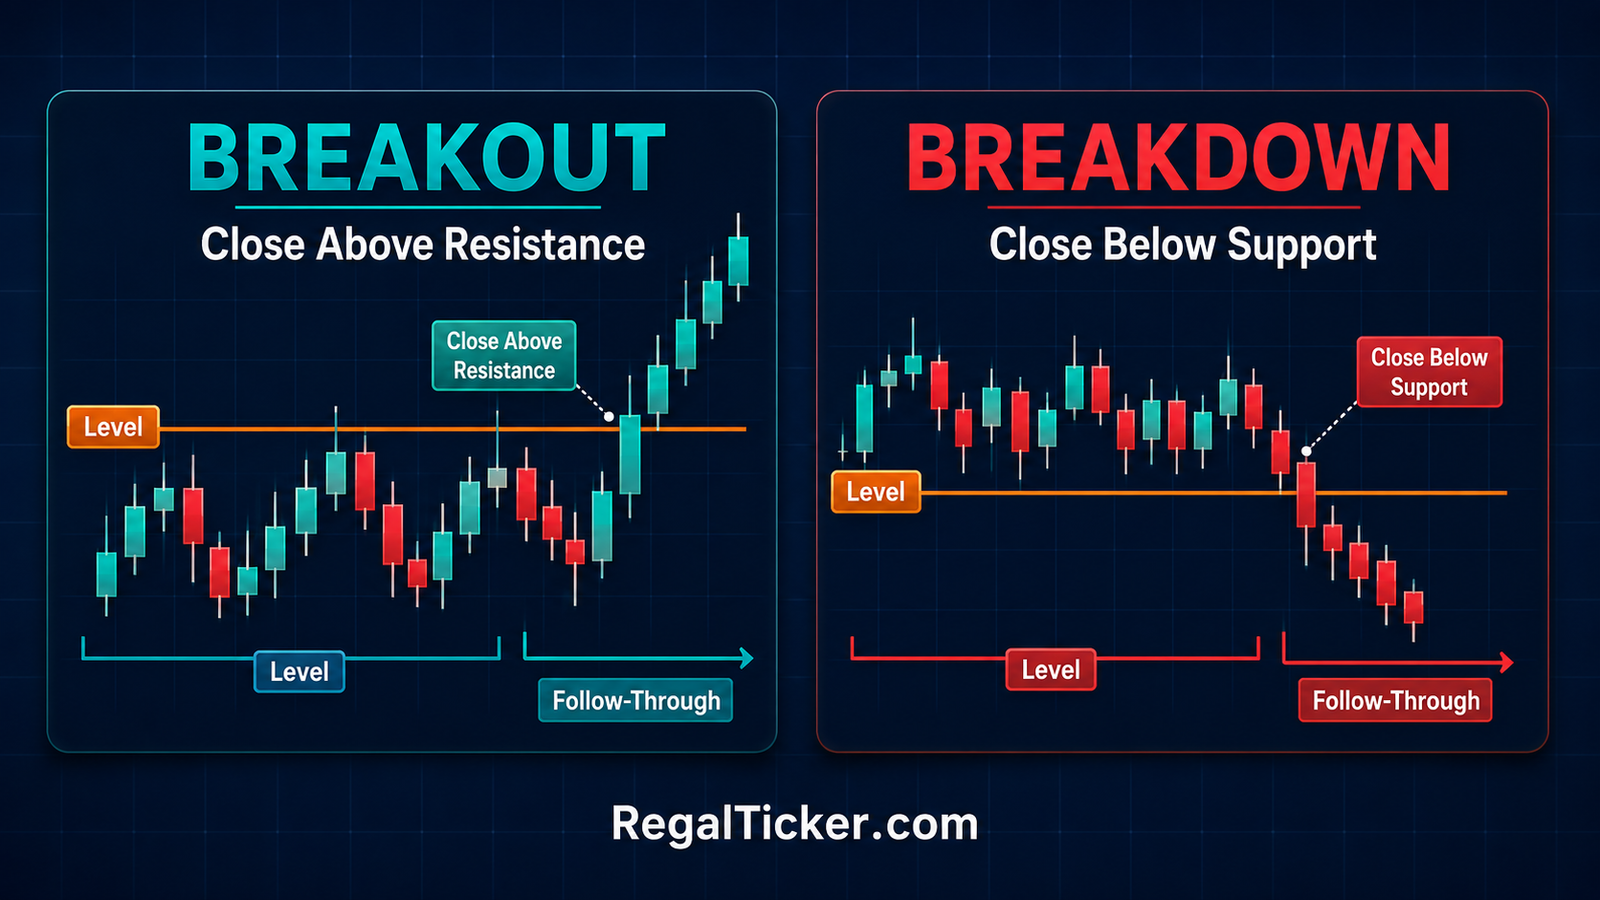
- If price closes decisively above ₹500 and remains outside the range, the old ceiling may no longer be controlling the market. That is an upside breakout.
- If price closes decisively below ₹480 and remains outside the range, the old floor may no longer be controlling the market. That is a downside breakdown.
SEBI’s investor education page explains that technical analysis studies price movements, patterns and trading volumes, while fundamental analysis examines the business and its financial condition: SEBI Investor — Technical Analysis vs Fundamental Analysis. Breakouts belong to the technical side of that distinction. They describe market behaviour; they do not reveal a company’s intrinsic value.
Breakout vs Breakdown
| Feature | Upside breakout | Downside breakdown |
|---|---|---|
| Level crossed | Resistance | Support |
| Direction | Price moves and closes above | Price moves and closes below |
| Market message | Supply at the old ceiling may have been absorbed | Demand at the old floor may have weakened |
| Common confirmation | Strong close, participation, follow-through or held retest | Strong close, participation, follow-through or failed recovery |
| Common failure | Price returns below resistance and into the range | Price recovers above support and back into the range |
| Automatic trade signal? | No | No |
A breakdown is not automatically an instruction to sell or short. For an existing investor, it can simply be a risk-review event. For a trader, the permitted instrument, settlement rules, costs, liquidity and personal risk plan all matter. The chart event and the transaction decision are separate.
A Wick Is Not the Same as Acceptance
Candlesticks show the open, high, low and close. The wick records where price travelled; the body records the relationship between open and close.
Suppose resistance is ₹500:
- Candle high ₹504, close ₹498: price tested above resistance but was rejected before the close.
- Candle high ₹506, close ₹504: price finished beyond resistance, giving stronger evidence.
- Candle close ₹504 followed by the next close at ₹507: price also produced follow-through.
The first case may still lead to a later breakout, but it has not shown the same acceptance as the second and third. This is why How to Read Candlestick Charts: A Beginner’s Guide is essential preparation.
Breakouts Can Emerge From Different Structures
The crossed boundary can come from:
- a horizontal trading range;
- a previous swing high or swing low;
- a triangle, flag, rectangle or other chart pattern;
- a trendline or price channel;
- an all-time or 52-week high;
- a multi-timeframe support or resistance zone.
Not all structures carry equal weight. A clean boundary tested several times over weeks usually attracts more attention than an arbitrary line drawn through two intraday points. However, more tests do not make a level unbreakable. Repeated pressure can either reinforce a visible boundary or gradually consume the orders sitting there.
Build a Valid Setup Around the Level
The quality of the level determines the quality of the breakout question. If the boundary is vague, confirmation becomes vague too.
Use an Area, Not False Precision
Support and resistance are often zones rather than single exact prices. One candle may turn at ₹498.70, another at ₹500.20 and a third at ₹499.40. Drawing resistance as a narrow ₹499–₹500.50 area may reflect the market better than insisting that ₹500.00 is the only valid price.
False precision creates two problems:
- Normal noise looks like a breakout.
- The analyst repeatedly moves the line to fit a preferred conclusion.
Mark the zone before the move whenever possible. Record why it matters: previous swing, repeated closes, high-volume rejection, pattern boundary or higher-timeframe level. A pre-defined level reduces hindsight bias.
Look for Repeated Market Recognition
A useful level normally has visible evidence:
- price reacted there more than once;
- reactions were separated in time rather than clustered in one candle;
- the level is visible without excessive chart adjustment;
- it aligns with market structure or a recognised pattern;
- it matters on the timeframe being traded;
- sufficient liquidity exists for price and volume data to be meaningful.
This does not mean you should count touches mechanically. Three weak touches in an illiquid share do not necessarily create a stronger level than one major weekly reversal in a liquid index constituent.
Read the Trend Before the Break
The same upside breakout means different things in different structures:
- Uptrend continuation: price pauses beneath resistance, then breaks higher.
- Range expansion: price leaves a neutral consolidation.
- Potential reversal: price breaks above a lower high within a prior downtrend.
- Late-stage extension: price accelerates far above moving averages after an already mature rally.
Direction alone cannot supply context. Use the higher highs and higher lows from the trend lesson before deciding what role the breakout plays.
Observe Compression and Pressure
Price sometimes compresses near a boundary:
- pullbacks become shallower;
- candles narrow;
- lows rise toward horizontal resistance;
- highs fall toward horizontal support;
- volatility contracts within a triangle or range.
Compression can show that the market is preparing for expansion, but it does not reveal direction with certainty. An ascending pattern can break downward; a descending pattern can break upward. Treat the actual close outside the structure as new evidence rather than predicting the move from the shape alone.
Check the Broader Market and Event Calendar
A stock-specific breakout is more vulnerable when the overall market or sector moves sharply in the opposite direction. Earnings, regulatory announcements, corporate actions and other events can also cause gaps that jump far beyond a technical level.
A gap is not automatically a high-quality breakout. If the opening price is far from the invalidation level, the required risk may become too large. A sound chart idea can still be untradeable at the available price.
How to Confirm a Breakout or Breakdown
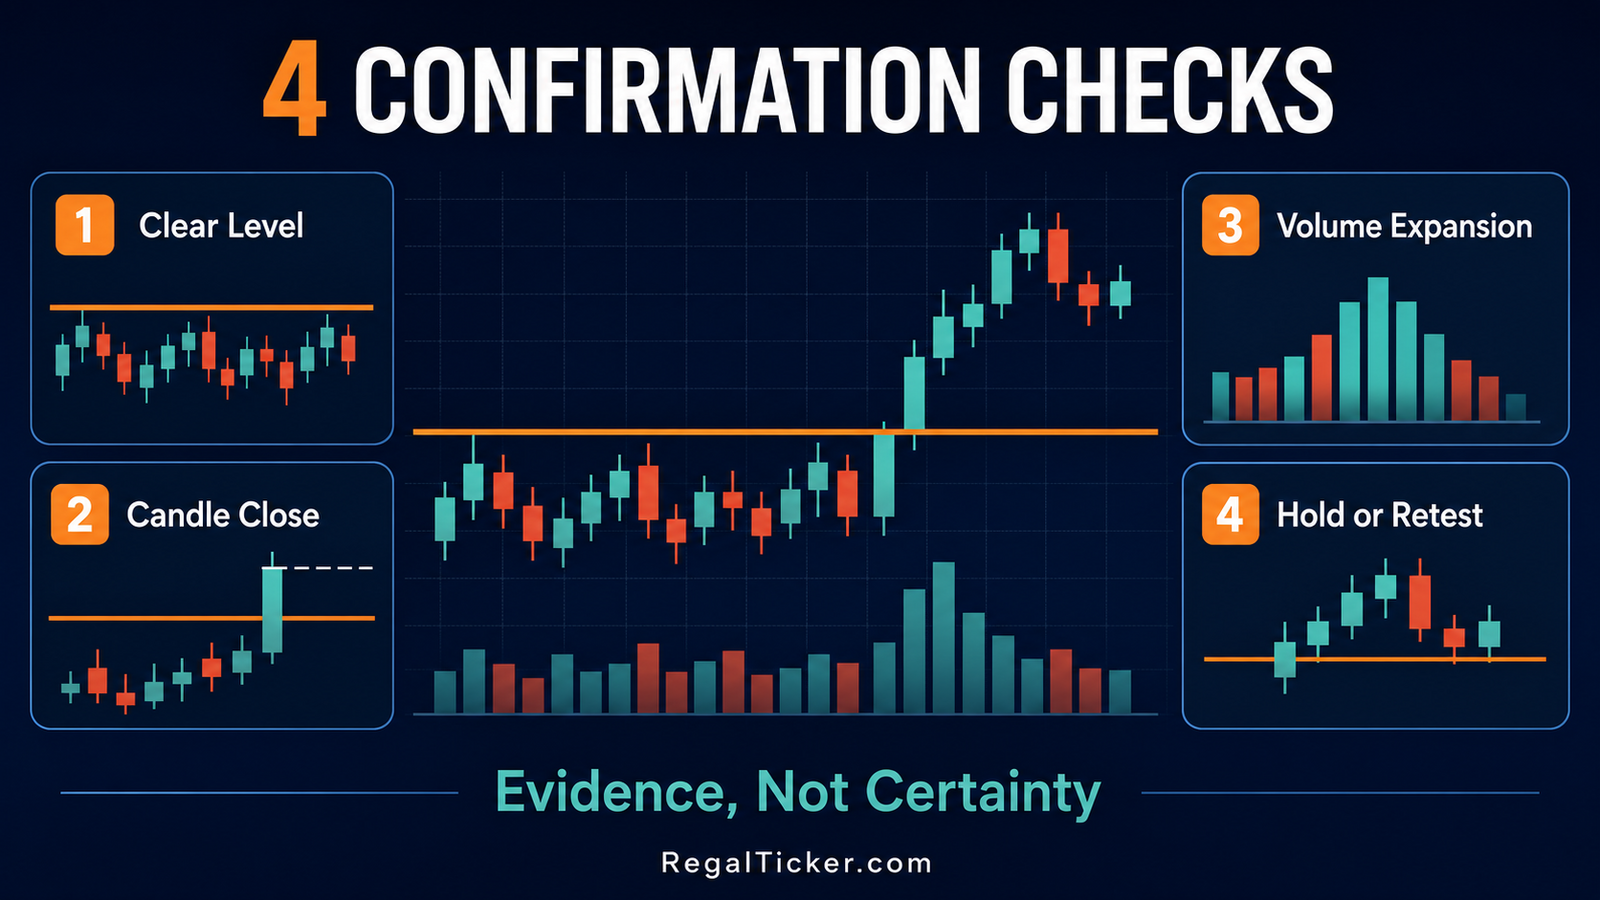
Confirmation means collecting independent evidence. It does not mean removing uncertainty.
NSE educational material describes technical analysis as studying market participants through charts, indicators and patterns, and includes price action with volume among its learning areas: NSE — Technical Analysis and Chart Patterns for Capital Markets. The practical implication is to combine price structure with participation instead of depending on one indicator.
Check 1: Was the Level Clear Before the Move?
Ask whether another careful observer could identify approximately the same zone without seeing the future candles. A level invented after price has already moved offers little analytical value.
A clearer setup has:
- a defined boundary;
- enough history to explain its importance;
- an appropriate timeframe;
- no need for repeated redrawing;
- room to distinguish a real close from normal noise.
Check 2: Did the Candle Close Beyond the Zone?
The close is one of the simplest filters.
For an upside move, compare:
- the candle close with the top of the resistance zone;
- the size of the body with recent candle bodies;
- the upper wick with the body;
- the closing position within the candle’s total range.
A large bullish body closing near its high and above the full resistance zone usually demonstrates more conviction than a small body with a long upper wick barely above the line.
For a downside move, reverse the logic. A firm close below support with a body near the candle low generally shows more acceptance than a long lower wick that recovers before the session ends.
There is no universal rule that price must close a fixed percentage beyond every level. Volatility differs across securities. A rigid 1% or 3% filter may be too wide for one share and meaningless for another. Compare the move with the instrument’s recent range and volatility.
Check 3: Did Volume Expand?
Volume shows participation, not direction by itself. A breakout accompanied by volume materially above the security’s recent baseline suggests that more shares changed hands during the level transition.
Compare the breakout bar with:
- the previous 10–20 bars on the same timeframe;
- the volume of earlier attempts at the level;
- the security’s normal liquidity;
- delivery data or other official market data when relevant;
- any one-off event that may distort activity.
NSE provides security-wise price-volume archives and daily market reports for exchange-traded data verification: NSE — Daily Market Reports and Historical Price-Volume Data. This is a more reliable reference for historical exchange data than an unexplained social-media screenshot.
High volume improves the evidence but does not guarantee continuation. A very large volume bar with a long rejection wick can represent aggressive buying that was absorbed by sellers. Read the candle and location together.
Check 4: Did Price Hold or Retest?
After crossing the boundary, price may:
- continue immediately;
- pause above or below the level;
- return to test the old boundary;
- fall back completely inside the range.
An upside retest asks whether former resistance can act as support. A downside retest asks whether former support can act as resistance.
A constructive upside retest may show:
- lower volume during the pullback than during the breakout;
- smaller bearish candles;
- rejection of the old resistance zone from above;
- a close back away from the level;
- a higher low that preserves the new structure.
A retest is not mandatory. Some strong moves never return to the level. Waiting for a retest can reduce the risk of chasing but can also mean no entry occurs. That is a trade-off, not a defect in the method.
Use Indicators as Supporting Evidence
Moving averages, RSI and MACD can add context:
- price above a rising moving average may support an upside continuation setup;
- RSI strengthening through its midpoint may show improving momentum;
- MACD expansion may support acceleration;
- weakening momentum can warn that participation is not translating into strength.
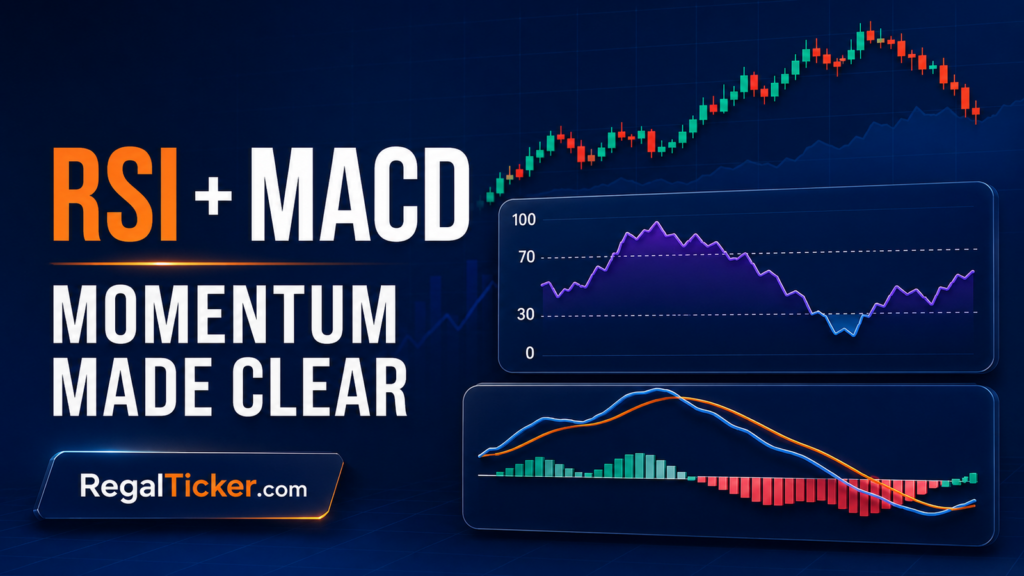
Indicators are calculated from price, so stacking many of them does not necessarily create independent confirmation. Moving Averages in Stock Market: SMA, EMA, Golden Cross and Death Cross and RSI and MACD in Stock Market: Momentum Indicators for Beginners explain their limits.
Confirmation Evidence Table
| Evidence | What it can support | What it cannot prove |
|---|---|---|
| Clear pre-marked level | The boundary was recognised before the move | That the next attempt must succeed |
| Close outside the zone | Price was accepted beyond the boundary at the close | That price will remain there |
| Expanded volume | Participation increased during the move | That every participant agrees on direction |
| Follow-through | Price continued outside the old range | That reversal risk has disappeared |
| Held retest | The former boundary changed role temporarily | That the level will never fail |
| Momentum agreement | Recent price speed supports the move | Fair value or business quality |
Retests, False Breakouts and Traps
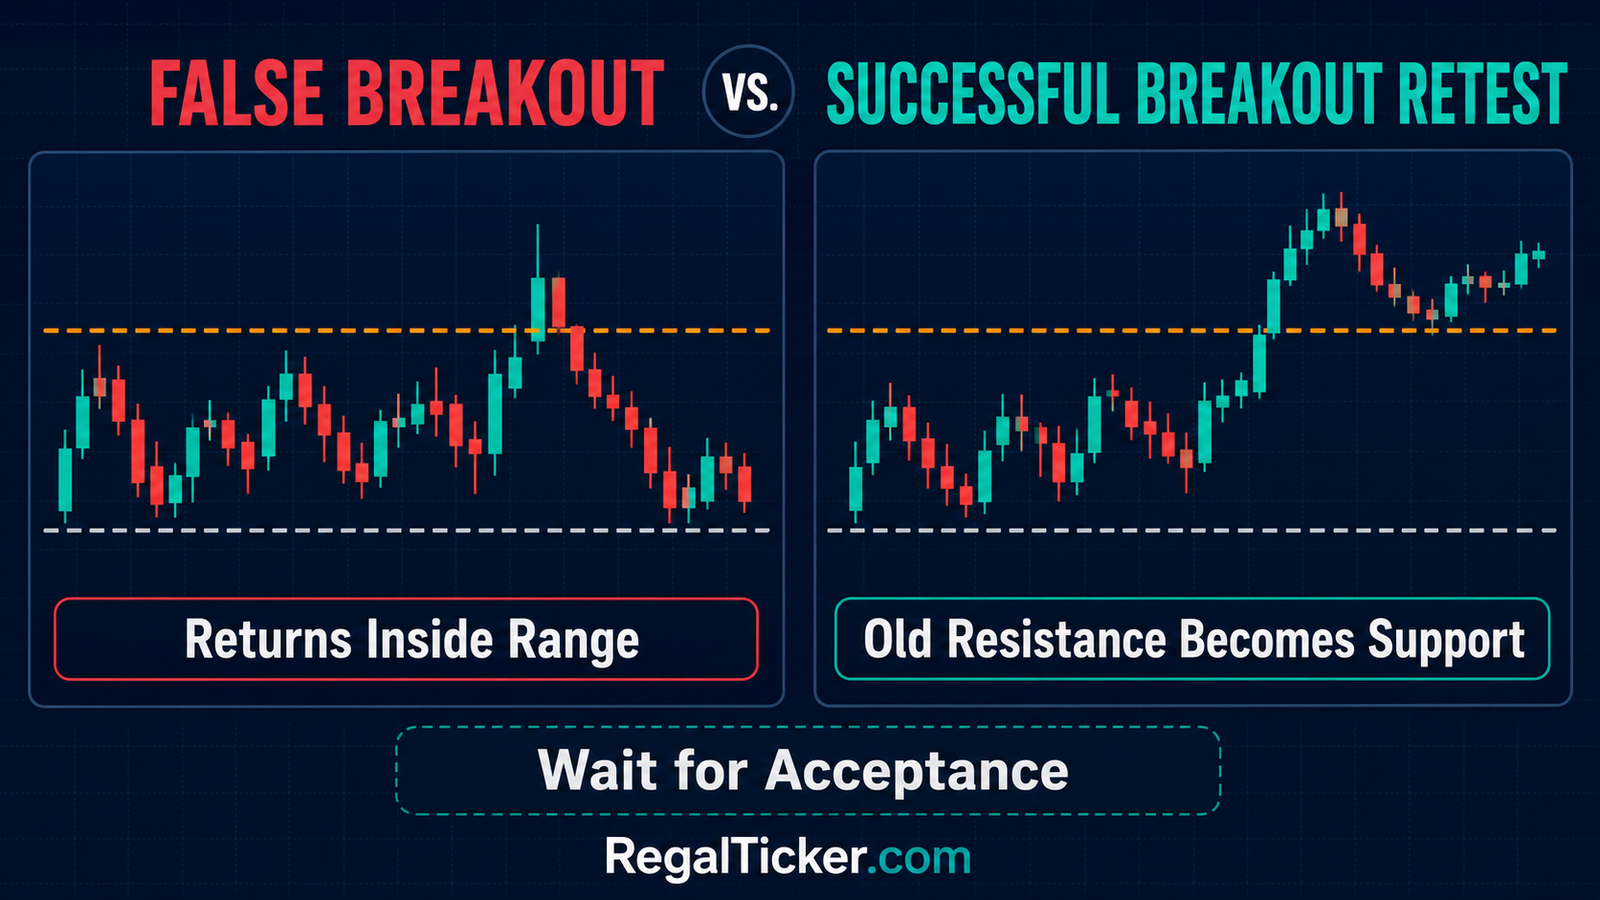
A false breakout occurs when price crosses an observed boundary but fails to remain outside the old structure. The move may reverse quickly or after a short period of apparent success.
Why False Breakouts Happen
Common causes include:
- insufficient participation;
- a move driven by temporary news or an opening gap;
- orders clustered just beyond an obvious level;
- a broader market reversal;
- an illiquid security with irregular prints;
- traders chasing an extended candle;
- a level defined too precisely;
- a genuine breakout that fails because new information changes conditions.
The last point is important. Not every failed breakout was “fake” from the beginning. Markets process new orders and information continuously. A valid setup can fail without the original analysis being dishonest.
Warning Signs of a Weak Breakout
Potential warning signs include:
- only the wick crosses the zone;
- the candle closes near the opposite end of its range;
- volume is below its recent average;
- price breaks directly into another nearby higher-timeframe level;
- follow-through candles are small and overlapping;
- the next session closes back inside the range;
- the move is extremely extended from a sensible invalidation point;
- the broad market or sector strongly disagrees.
No single warning sign guarantees failure. The purpose is to evaluate the balance of evidence.
Bull Trap and Bear Trap
A bull trap commonly describes an upside breakout that attracts buyers before price falls back below resistance. A bear trap commonly describes a downside breakdown that attracts selling before price recovers above support.
The terms describe the chart outcome, not an organised conspiracy. It is more useful to identify the invalidation event than to blame unnamed market participants.
For an upside setup, a close back inside the old range may invalidate the idea. For a downside setup, recovery above the broken support zone may do the same. The exact rule should be defined before acting.
Retest Acceptance vs Rejection
On an upside retest:
- Acceptance above the level: pullback holds, candle rejects lower prices and closes above the zone.
- Rejection of the breakout: price closes decisively back below the old resistance and into the range.
On a downside retest:
- Acceptance below the level: recovery fails beneath old support and price turns lower.
- Rejection of the breakdown: price closes back above support and into the old range.
Time Filters Can Reduce Noise
Some analysts wait for:
- a candle close;
- the next candle to hold;
- a daily close instead of an intraday cross;
- a weekly close for a long-term level;
- a retest and rejection candle.
Every added filter has a cost. Waiting can improve confirmation but produce a later entry and wider distance from the original level. Faster entries offer a closer price but more false signals. There is no method that simultaneously guarantees the earliest entry, tightest risk and strongest confirmation.
Entry Approaches, Invalidation and Risk
This section explains analytical frameworks, not personalised trading instructions. The correct approach depends on timeframe, experience, costs, liquidity and risk capacity.
Three Common Entry Frameworks
| Framework | Basic idea | Main advantage | Main limitation |
|---|---|---|---|
| Close-based | Consider the setup after a candle closes beyond the zone | Avoids acting on many intrabar wicks | Entry may be extended after a large candle |
| Follow-through | Wait for the next bar to remain outside or exceed the breakout bar | Adds evidence of acceptance | Later entry and possible missed move |
| Retest-based | Wait for price to revisit and hold the old boundary | Invalidation may be easier to define | Retest may never occur or may fail |
None of these frameworks is automatically superior. The key is consistency: define the method before reviewing the result.
Place Invalidation Where the Idea Is Wrong
Invalidation is the chart condition that contradicts the setup.
Possible upside invalidation references include:
- a close back inside the old range;
- a close below the retest low;
- a break below the most recent higher low;
- failure beneath a pattern boundary.
Possible downside invalidation references reverse the logic.
An invalidation point should not be placed randomly at the exact amount a trader hopes to lose. First identify where the chart thesis is wrong; then calculate whether the distance creates acceptable risk. If the required risk is too large, the appropriate decision may be to skip the setup.
Learn the mechanics of protective orders in Market Order, Limit Order, Stop-Loss and Stop-Limit Order. A stop order manages execution after a threshold is reached; it does not guarantee the exact exit price in a fast or gapping market.
Calculate Risk Before Position Size
Suppose an educational example has:
- potential entry after confirmation: ₹505;
- invalidation reference: ₹495;
- risk per share: ₹10;
- maximum planned loss: ₹1,000.
The theoretical position size before charges and slippage is:
Position size = Maximum planned loss ÷ Risk per share
₹1,000 ÷ ₹10 = 100 shares
This calculation does not make the setup profitable. It only aligns the number of shares with a pre-defined loss limit. Brokerage, taxes, slippage, gaps and execution rules can increase the actual result.
| Input | Example |
|---|---|
| Reference entry | ₹505 |
| Invalidation | ₹495 |
| Risk per share | ₹10 |
| Maximum planned loss | ₹1,000 |
| Theoretical shares before costs | 100 |
Do Not Invent a Target From Hope
Common target frameworks include:
- the height of the old range projected from the breakout point;
- the next visible support or resistance zone;
- a fixed reward-to-risk multiple;
- trailing behind new swing lows or highs.
A projected target is a planning tool, not a forecast. If major resistance sits before an upside projection, the available reward may be smaller than the pattern suggests. If the required target depends on perfect execution, it may not be realistic.
Avoid Chasing an Extended Candle
A breakout candle can be technically strong but operationally poor. If price has moved far beyond the level, entering late can create:
- a wide invalidation distance;
- a small position size;
- weak reward relative to risk;
- emotional pressure to move the stop;
- vulnerability to a normal retest.
Missing a move is not a trading loss. A disciplined process should allow “no trade” when the price no longer offers an acceptable structure.
Worked Breakout and Breakdown Examples
Examples make the sequence clearer. These are simplified illustrations, not recommendations or predictions.
Example 1: Upside Breakout With Confirmation
A liquid share trades between ₹480 and ₹500 for 18 sessions. Resistance near ₹500 has been tested three times. On the fourth attempt:
- Price opens at ₹496.
- It trades through the resistance zone.
- The daily candle closes at ₹504 near its high.
- Volume is 1.8 times its 20-day average.
- The next session holds above ₹500 and closes at ₹506.
- A later pullback reaches ₹501 on lower volume and rejects the level.
Interpretation:
- the level was visible before the move;
- the body closed beyond resistance;
- participation expanded;
- follow-through appeared;
- the retest held.
The setup has several confirmations, but it can still fail. A close back below the retest low or deep inside the old range would weaken the thesis.
Example 2: False Upside Breakout
Another share has resistance at ₹250. It opens at ₹248, reaches ₹257 and closes at ₹249 with a long upper wick. Volume is high.
It is tempting to treat high volume as proof of a breakout. The candle tells a different story:
- price travelled above the level;
- sellers absorbed the advance;
- the close returned below resistance;
- the upper wick records rejection;
- the old range remains intact.
High volume plus rejection can be evidence of a failed attempt rather than successful acceptance. Volume must be interpreted with the price outcome.
Example 3: Downside Breakdown and Failed Recovery
A share holds support near ₹720 for several weeks. It closes at ₹708 on expanding volume. Two sessions later, price recovers to ₹718 but forms a bearish rejection candle and closes at ₹711.
The sequence suggests:
- support was lost;
- price remained below the level;
- the recovery tested old support from underneath;
- the failed recovery supports the role reversal.
For an existing holder, this could trigger a review of the original investment thesis and risk limit. It still does not prove that price must continue lower.
Example 4: Breakdown That Becomes a Bear Trap
Support is marked around ₹1,000. Price falls to ₹982 intraday but closes at ₹1,008. The next session advances to ₹1,025 on stronger volume.
The intraday move below support did not achieve acceptance. Traders who reacted only to the low may have acted on a wick. A close-based method would have classified the breakdown as unconfirmed.
Keep a Setup Record
A useful journal entry can record:
- screenshot before the move;
- level and reason;
- timeframe;
- trend context;
- breakout candle open, high, low and close;
- volume relative to baseline;
- confirmation method;
- invalidation rule;
- planned risk;
- result and process review.
The purpose is not to prove that every loss was avoidable. It is to learn whether the same rules were applied consistently.
Timeframe, Liquidity and Market Conditions
A breakout must be interpreted on the timeframe that created the level.
Match Confirmation to the Level
- An intraday resistance level can be evaluated with intraday closes.
- A daily range usually deserves a daily close.
- A multi-month weekly level may require weekly evidence.
A five-minute candle above a weekly resistance zone is not the same as a weekly close above it. Lower timeframes can show the path within the larger candle, but they should not silently replace the timeframe of the original setup.
Use Multiple Timeframes Carefully
A practical sequence is:
- Higher timeframe: identify trend and major levels.
- Setup timeframe: define the range, pattern and breakout rule.
- Lower timeframe: refine observation only if it does not contradict the plan.
Too many timeframes create conflicting signals. A daily breakout can coexist with a five-minute pullback and a weekly downtrend. Decide which timeframe owns the thesis.
Liquidity Affects Signal Quality
Illiquid shares may show:
- large gaps between trades;
- unreliable wicks;
- small absolute volume spikes;
- wide bid–ask spreads;
- slippage;
- abrupt moves caused by few orders.
Read Bid Price, Ask Price, Spread and Order Book Explained before judging a chart without considering execution quality.
A technically attractive breakout in an illiquid security can be difficult to enter or exit near the displayed price. Liquidity risk belongs in the setup evaluation.
News and Gaps Change the Risk
Corporate results, regulatory decisions or unexpected announcements can move price beyond a level before normal trading begins. A gap above resistance may confirm strong demand, but it can also create a large distance to invalidation.
Do not assume that “stronger gap” means “better entry.” Separate signal strength from entry quality.
Short-Term Trading Has Real Loss Risk
Breakout strategies are often used for short-term or intraday decisions, where costs and repeated execution matter. SEBI has published a dedicated study on outcomes for individuals in equity cash intraday trading: SEBI — Study on Intraday Trading by Individuals in the Equity Cash Segment. The existence of an identifiable chart pattern does not remove the financial risk documented in real trading data.
Avoid leverage until you fully understand losses, margin calls, gaps and execution. Technical analysis is an analytical method, not a guarantee.
Breakout Checklist and Common Mistakes
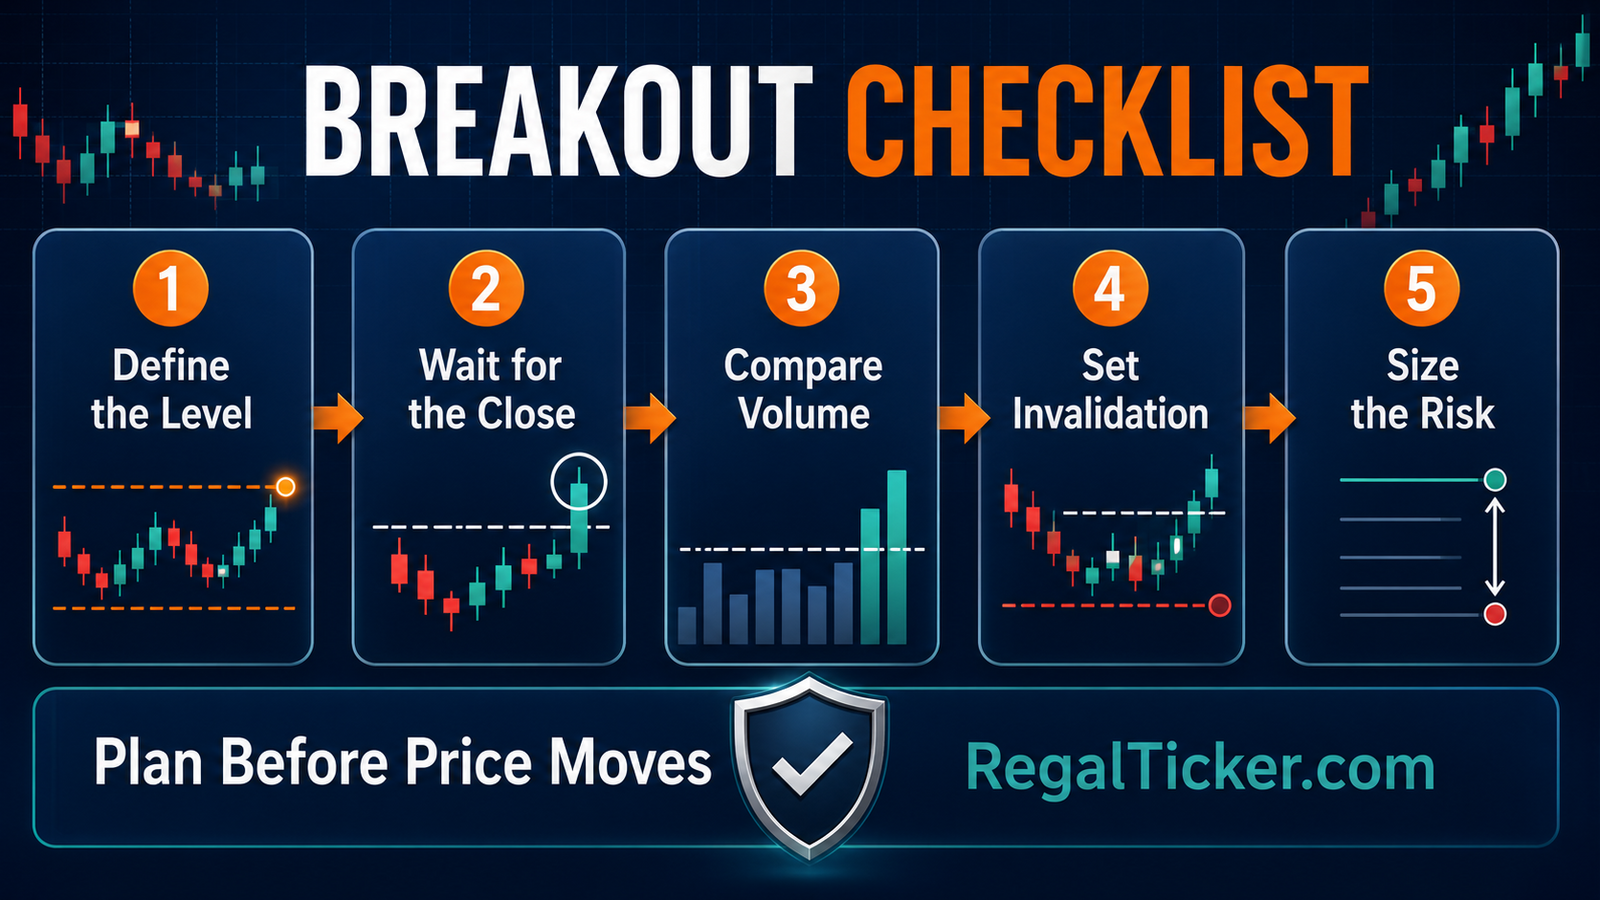
A short checklist is more useful than adding another indicator after the move.
Nine Checks Before Treating the Move as Confirmed
- Level: Was support or resistance marked before the move?
- Timeframe: Does the confirmation match the timeframe of the level?
- Context: Is this continuation, range expansion or possible reversal?
- Close: Did the candle body finish beyond the full zone?
- Volume: Did participation expand relative to a sensible baseline?
- Obstacle: Is another major level immediately ahead?
- Acceptance: Did price hold outside, follow through or survive a retest?
- Invalidation: Is there an objective condition that proves the idea wrong?
- Risk: Is the loss acceptable after position size, costs and slippage?
Common Mistakes
| Mistake | Why it is dangerous | Better process |
|---|---|---|
| Buying or selling the first wick | Price may close back inside the range | Wait for the chosen confirmation rule |
| Drawing the level after the move | Creates hindsight bias | Mark and explain the zone beforehand |
| Treating high volume as always bullish | High volume can accompany rejection | Read volume with candle and location |
| Chasing a large candle | Invalidation may become too distant | Recalculate risk or wait for another setup |
| Moving the stop to avoid a loss | Changes the original risk after entry | Define invalidation before acting |
| Using many correlated indicators | Creates false confidence | Prioritise price, level, volume and risk |
| Ignoring higher-timeframe obstacles | Breakout may run directly into supply | Map the next major zone first |
| Trading illiquid shares from clean-looking charts | Displayed prices may not be executable | Check volume, spread and order-book conditions |
| Assuming every failure was manipulation | Prevents honest process review | Study acceptance, rejection and new information |
A Simple Decision Tree
Use this sequence:
- No clear level → no breakout setup.
- Clear level but no close beyond it → unconfirmed test.
- Close beyond, weak participation and immediate return → higher false-breakout risk.
- Close beyond with participation and hold → stronger evidence.
- Strong evidence but unacceptable risk → skip.
- Acceptable setup and risk → follow the pre-written plan.
The final decision is not “Will it certainly work?” The useful question is “Does the evidence meet my rules, and is the defined loss acceptable if I am wrong?”
FAQs and Final Takeaway
What is a breakout in the stock market?
A breakout occurs when price moves and is accepted above an observed resistance area or pattern boundary. A candle close, volume context and follow-through can provide stronger evidence than an intraday wick alone.
What is a breakdown in the stock market?
A breakdown occurs when price moves and is accepted below an observed support area. It can signal weakening demand or a change in market structure, but it is not a guaranteed forecast or automatic instruction to short.
How can I confirm a stock breakout?
Start with a pre-defined level. Then evaluate the candle close, body and wick, volume relative to recent activity, follow-through, nearby obstacles and any retest. Confirmation improves evidence; it cannot eliminate failure.
Is high volume necessary for every breakout?
No universal rule makes high volume mandatory in every market and timeframe. However, volume expansion can show stronger participation. Low-volume breakouts generally deserve more caution, while high volume must still be interpreted with the candle’s close and rejection.
What is a false breakout?
A false breakout is a move beyond support or resistance that fails to remain outside the old structure. Price may return inside the range quickly or after a brief period of apparent acceptance.
Should I wait for a retest after a breakout?
A retest can offer additional confirmation and a clearer invalidation point, but it may never occur. Waiting reduces some chasing risk while increasing the chance of missing the move. Choose the rule before the setup, not after seeing the result.
Can RSI or MACD confirm a breakout?
They can support momentum analysis, but both are derived from price. A clear level, candle close and market structure remain primary. RSI or MACD disagreement is a warning to investigate, not a guaranteed reversal.
Where should invalidation be placed?
Invalidation should sit where the chart thesis becomes wrong, such as back inside the range, beyond the retest swing or outside the relevant pattern. After identifying that level, calculate whether the distance creates acceptable risk.
Are breakout strategies profitable?
No breakout method is automatically profitable. Results depend on market conditions, execution, costs, risk control, sample size and discipline. False breakouts and gaps can create losses even when the original setup appeared strong.
Final Takeaway
Breakout and breakdown in stock market analysis are not about drawing a line and reacting whenever price crosses it. A complete process begins with a meaningful pre-marked zone, reads the close and participation, watches whether price is accepted outside the range, defines invalidation and sizes risk before acting.
The strongest lesson is simple: confirmation is evidence, not certainty. A clear breakout can fail; a cautious analyst plans for that failure before thinking about potential reward.
Next, complete the Technical Analysis learning path with How to Analyse a Stock Technically: Complete Checklist, where trend, levels, candles, patterns, volume, moving averages, momentum, breakouts and risk will be combined into one repeatable process.
Educational note: This article explains technical-analysis concepts for learning purposes. It is not investment advice, a recommendation, a return promise or a substitute for advice from a SEBI-registered professional who understands your circumstances.