

⚡ Quick answer
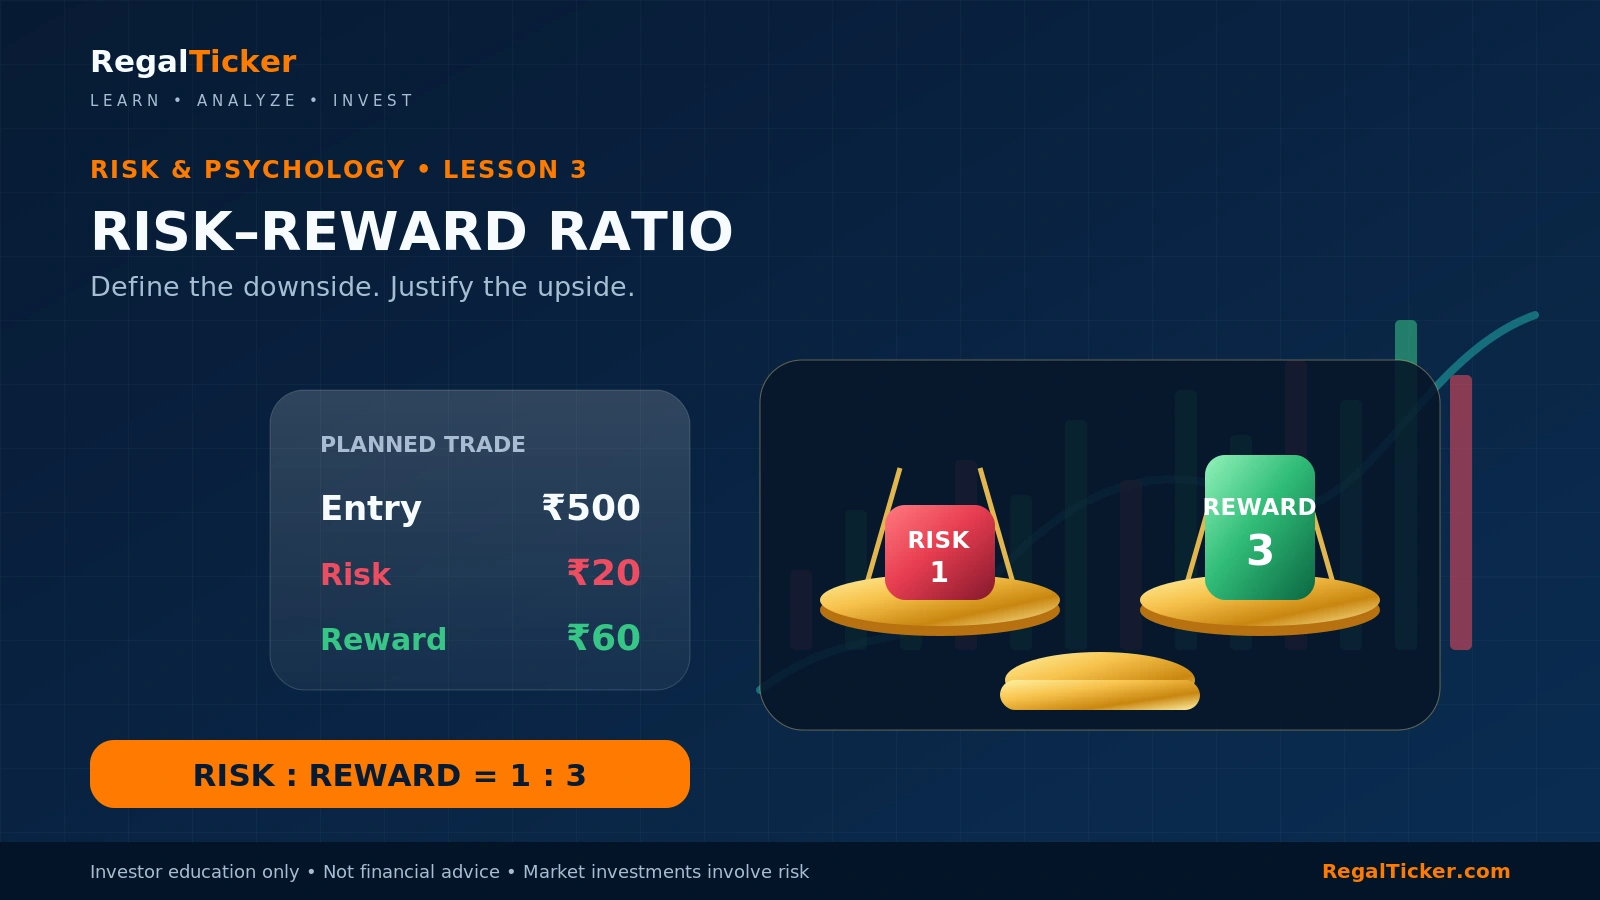
The risk-reward ratio in stock market trading compares the amount a planned position may lose with the amount it may gain. If a trade risks ₹20 per share to pursue ₹60 per share, the plan has a 1:3 risk-reward ratio. The calculation is useful only when the stop-loss is logical, the target is realistic, the position size is controlled and transaction costs are considered.
Investor note
Key Takeaways
The ratio compares planned downside with potential upside before entry. A 1:3 ratio means risking one unit to pursue three units. A high ratio does not prove that a target is likely to be reached. Break-even win rate, trading expectancy, costs and execution matter alongside the ratio. Position size determines the total rupee loss; the ratio alone does not control exposure. Use the Risk-Reward Calculator first, then check position size, brokerage and the realised return.
The risk-reward ratio in stock market trading compares how much money a trader may lose if a planned position fails with how much the trader may gain if the target is reached. It is calculated before entry using three essential prices: the proposed entry, the invalidation or stop-loss level, and the planned target.
A position with ₹20 of risk per share and ₹60 of possible reward per share has a reward-to-risk ratio of 3:1, commonly written as a 1:3 risk-reward ratio when risk is stated first. In simple words, the plan is risking ₹1 to pursue ₹3.
The calculation is useful because it forces a trader to define the downside and upside before emotions, price movement and open profit or loss influence the decision. However, a high ratio does not prove that a trade will work. An unrealistic target can make a weak setup look attractive, while a stop-loss placed too close to the entry can make the ratio appear better than the actual market structure supports.
This lesson follows Risk Management in Stock Market: A Beginner’s Guide and Position Sizing in Stock Market: Formula, Methods and Examples. The previous lessons explain how to control the amount at risk. This article explains how to compare that risk with the possible reward.
Before placing a position, use the RegalTicker Risk-Reward Calculator to enter the proposed entry, stop-loss, target and quantity. It displays the ratio, risk per share, total potential loss and total potential gain in one place.
Key idea: A risk-reward ratio describes the arithmetic of a plan. It does not describe the probability that the plan will succeed.
What Is the Risk-Reward Ratio?
The risk-reward ratio compares two distances:
- the distance from entry to the level where the trade idea is considered wrong; and
- the distance from entry to the level where the trader plans to realise a gain.
For a long position, risk is normally below the entry and reward is above it. For a short position, risk is above the entry and reward is below it.
Suppose a trader plans to:
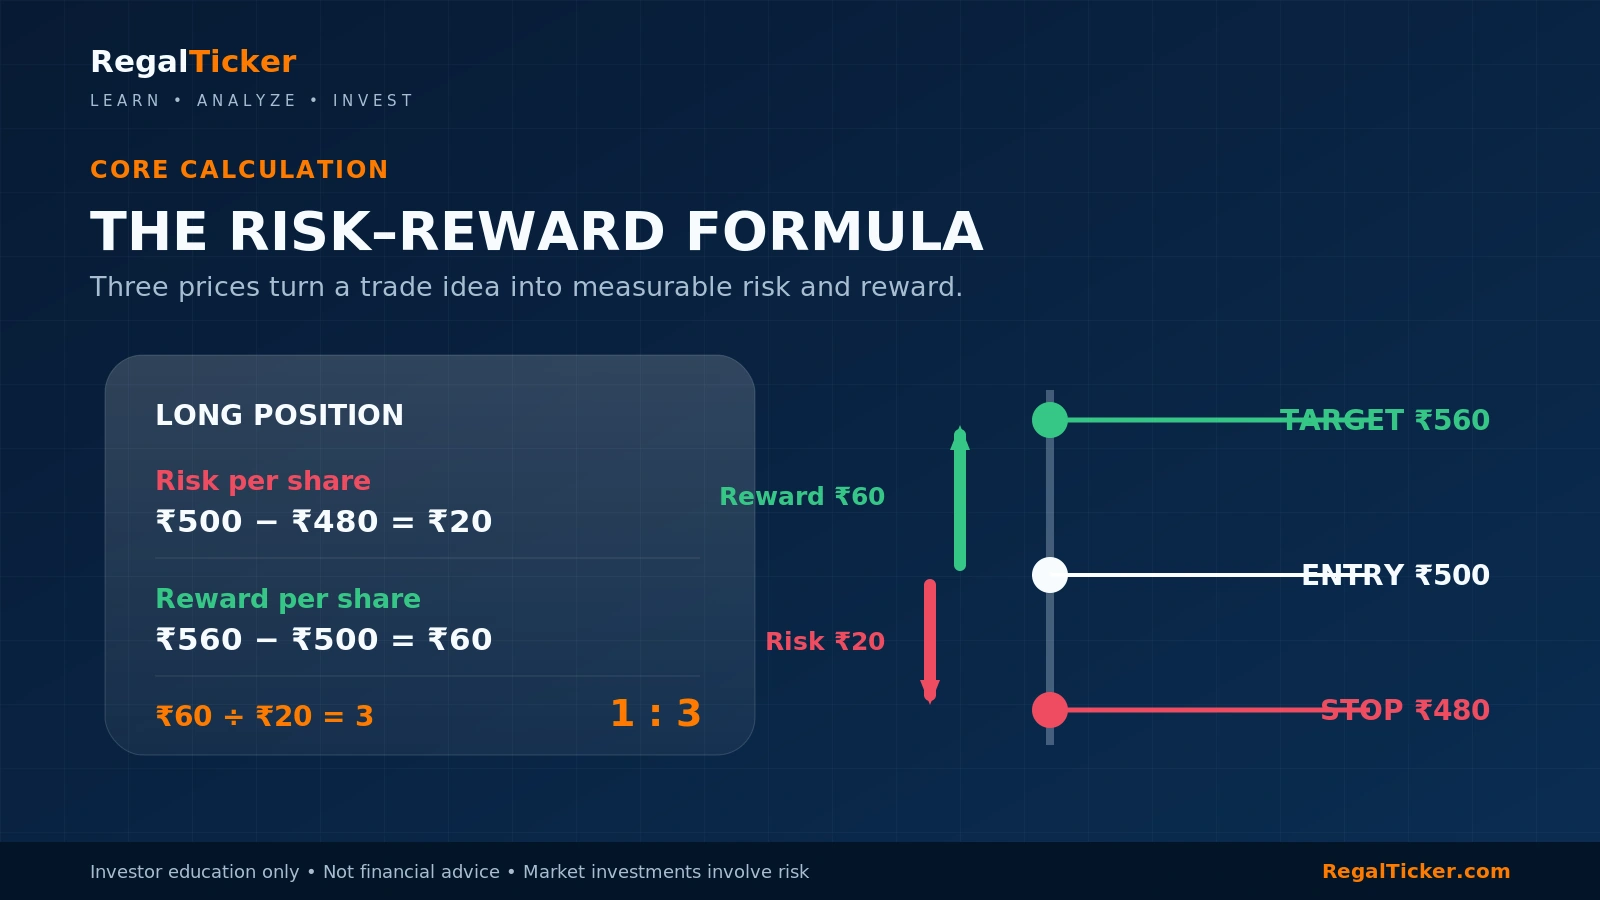
- buy at ₹500;
- exit if wrong at ₹480;
- take profit at ₹560.
The risk per share is ₹20, while the potential reward is ₹60.
Reward-to-risk ratio:
₹60 ÷ ₹20 = 3
The plan therefore has a reward-to-risk ratio of 3:1, or a risk-reward ratio of 1:3.
The Risk-Reward Calculator performs the same calculation and also multiplies the per-share figures by the selected quantity.
Risk-Reward Ratio vs Reward-to-Risk Ratio
Both expressions are widely used, which can create confusion.
- Risk-to-reward may be written as 1:3.
- Reward-to-risk may be written as 3:1.
They describe the same planned trade when the order of the numbers is clearly stated.
RegalTicker uses the beginner-friendly expression 1:3 risk-reward ratio, meaning ₹1 of planned risk for ₹3 of possible reward. The calculator labels the numerical result as reward-to-risk because the formula divides reward by risk.
Always check which number comes first. A ratio written without explanation can be misunderstood.
Planned Risk Is Not Guaranteed Maximum Loss
The calculated loss assumes that the position can be exited near the chosen stop-loss price. Actual execution can differ because of:
- price gaps;
- low liquidity;
- fast market movement;
- order rejection;
- trading halts;
- circuit limits;
- slippage;
- partial execution;
- technical problems.
NSE explains that a stop-loss order becomes active only when the relevant trigger condition is reached. Triggering an order is not the same as guaranteeing execution at the trigger price. Review Market Order, Limit Order, Stop-Loss and Stop-Limit Order before treating a stop-loss as certainty.
SEBI also identifies market risk, liquidity risk, business risk and volatility risk as important securities-market risks. The ratio helps structure exposure, but it cannot remove these risks.
Why Traders Use the Ratio
A risk-reward framework can help a trader:
- reject trades where the possible upside is too small for the planned downside;
- compare different entry opportunities;
- decide whether waiting for a better entry improves the plan;
- connect the stop-loss with position size;
- avoid chasing price after a move has already occurred;
- define a target before greed expands expectations;
- evaluate whether a strategy can survive a moderate win rate;
- record planned versus realised outcomes.
It also creates a common language for reviewing trades. Instead of saying, “The trade looked good,” a trader can record that the plan risked one unit to pursue two units, then compare the realised outcome with the original assumptions.
Risk-Reward Ratio Formula
For a long position:
Risk per share = Entry price − Stop-loss price
Reward per share = Target price − Entry price
Reward-to-risk ratio = Reward per share ÷ Risk per share
The result can be written as:
Risk-reward ratio = 1 : Reward-to-risk result
For a short position:
Risk per share = Stop-loss price − Entry price
Reward per share = Entry price − Target price
A general formula that works for both directions is:
Risk per share = |Entry price − Stop-loss price|
Reward per share = |Target price − Entry price|
The RegalTicker Risk-Reward Calculator uses these absolute price differences, so it can evaluate both long and short examples.
Total Risk and Total Reward
The per-share ratio does not change when quantity changes, but the money at stake does.
Total planned risk = Risk per share × Quantity
Total potential reward = Reward per share × Quantity
Assume:
- entry: ₹820;
- stop-loss: ₹780;
- target: ₹940;
- quantity: 150 shares.
Calculations:
- risk per share = ₹820 − ₹780 = ₹40;
- reward per share = ₹940 − ₹820 = ₹120;
- total planned risk = ₹40 × 150 = ₹6,000;
- total potential reward = ₹120 × 150 = ₹18,000;
- reward-to-risk ratio = ₹120 ÷ ₹40 = 3.
The ratio is 1:3.
Enter these values in the Risk-Reward Calculator to see the price line, total risk and total reward together.
The ₹6,000 planned risk should also be checked against the overall capital limit explained in the position sizing guide. A 1:3 setup can still be unsuitable if the quantity makes the potential loss too large for the account.
Break-Even Win Rate Formula
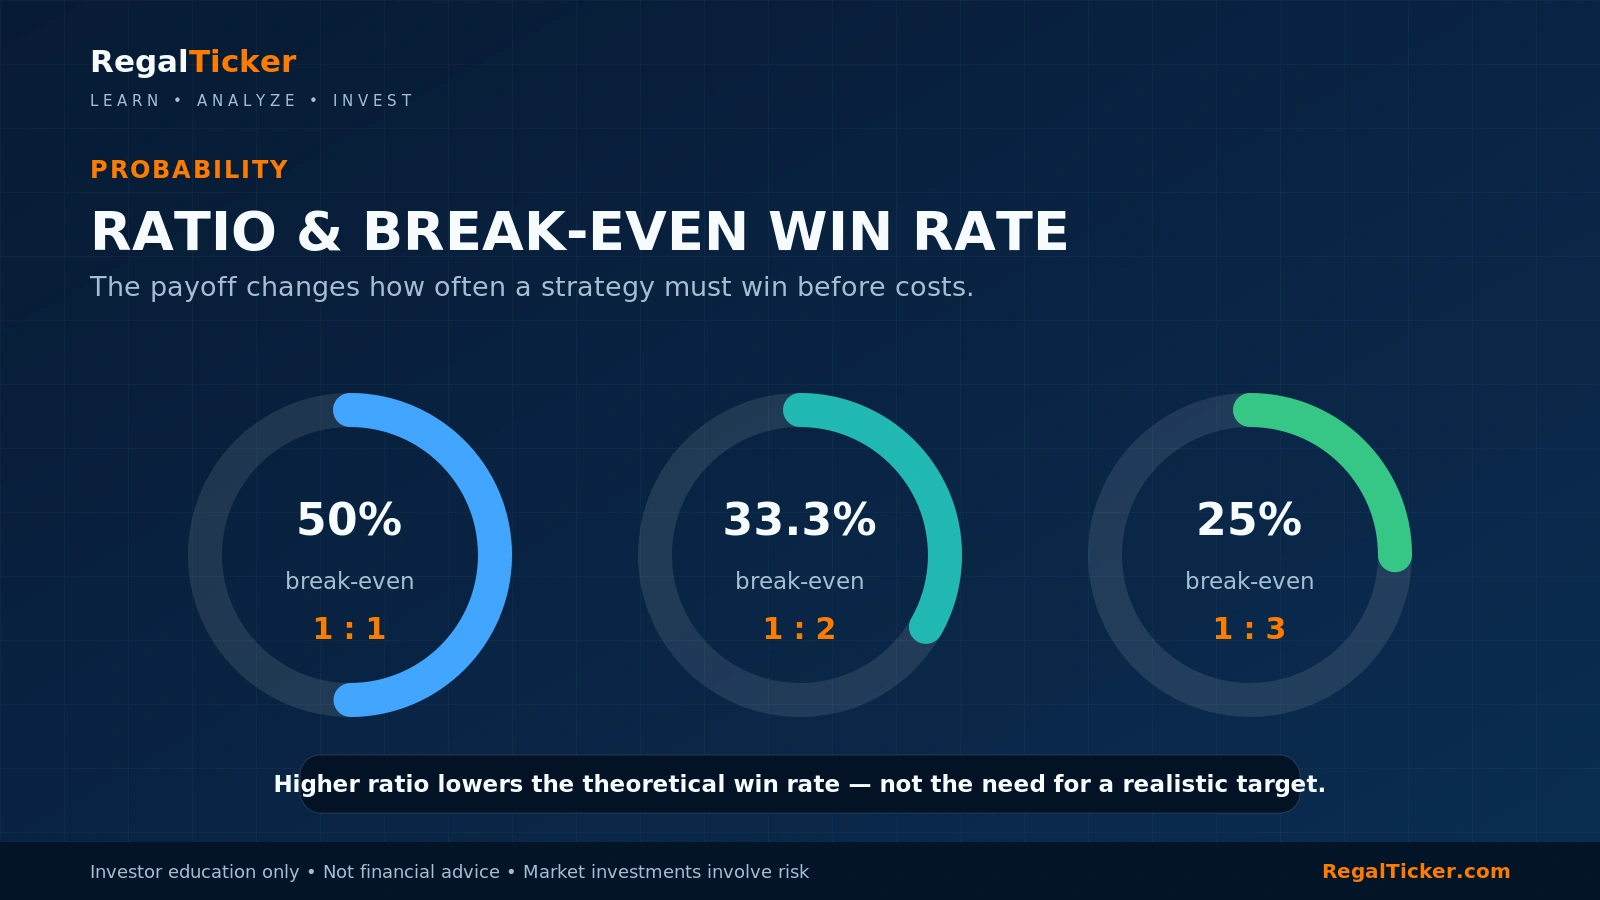
The theoretical break-even win rate shows how often a strategy must win to cover losses before charges, slippage and taxes.
Using the reward-to-risk multiple:
Break-even win rate = 1 ÷ (1 + Reward-to-risk multiple)
For a 1:2 risk-reward ratio:
1 ÷ (1 + 2) = 33.33%
For a 1:3 ratio:
1 ÷ (1 + 3) = 25%
For a 1:1 ratio:
1 ÷ (1 + 1) = 50%
These percentages assume every loss equals exactly one risk unit and every win reaches the full target. Real trading rarely behaves this neatly. Some trades exit early, some stops slip, some gains are partially booked and transaction costs reduce the result.
Quick Break-Even Table
| Risk-reward plan | Reward-to-risk multiple | Theoretical break-even win rate* |
|---|---|---|
| 1:0.5 | 0.5 | 66.67% |
| 1:1 | 1.0 | 50.00% |
| 1:1.5 | 1.5 | 40.00% |
| 1:2 | 2.0 | 33.33% |
| 1:2.5 | 2.5 | 28.57% |
| 1:3 | 3.0 | 25.00% |
| 1:4 | 4.0 | 20.00% |
| 1:5 | 5.0 | 16.67% |
*Before brokerage, statutory charges, slippage, taxes and imperfect exits.
Worked Risk-Reward Ratio Examples
Worked examples make the relationship between entry, stop, target, quantity and costs easier to understand.
Example 1: A 1:2 Long Trade
Assume:
- entry price: ₹250;
- stop-loss price: ₹240;
- target price: ₹270;
- quantity: 200 shares.
Risk per share:
₹250 − ₹240 = ₹10
Reward per share:
₹270 − ₹250 = ₹20
Reward-to-risk ratio:
₹20 ÷ ₹10 = 2
Risk-reward ratio: 1:2
Total planned risk:
₹10 × 200 = ₹2,000
Total potential reward:
₹20 × 200 = ₹4,000
The ratio looks acceptable in arithmetic terms, but the trader must still ask whether ₹240 is a logical invalidation level and whether ₹270 is a realistic target. Use the Risk-Reward Calculator to test the figures, then use the Brokerage Calculator to estimate how charges reduce the gross ₹4,000 potential gain.
Example 2: A 1:3 Trade With Position Sizing
Assume strategy capital is ₹4,00,000 and the trader chooses an illustrative maximum planned loss of ₹2,000.
The analysed setup is:
- entry: ₹400;
- stop-loss: ₹390;
- target: ₹430.
Risk per share:
₹400 − ₹390 = ₹10
Reward per share:
₹430 − ₹400 = ₹30
Risk-reward ratio:
₹10 : ₹30 = 1:3
Position quantity:
₹2,000 ÷ ₹10 = 200 shares
Position value:
₹400 × 200 = ₹80,000
Total potential reward:
₹30 × 200 = ₹6,000
This example connects the two previous lessons:
- The risk-reward ratio compares the possible gain with the possible loss.
- Position sizing converts the maximum acceptable rupee loss into a quantity.
The Risk-Reward Calculator confirms the ₹2,000 versus ₹6,000 plan, while the position sizing article explains why quantity must be calculated after the stop distance.
Example 3: Attractive Ratio, Unrealistic Target
Assume:
- entry: ₹1,000;
- stop-loss: ₹980;
- target: ₹1,200.
The calculated ratio is:
- risk per share: ₹20;
- reward per share: ₹200;
- ratio: 1:10.
A 1:10 ratio appears excellent. But suppose the chart shows major resistance at ₹1,035 and the stock has rarely moved 20% within the planned holding period. The ₹1,200 target may be wishful thinking rather than a realistic exit level.
This is one of the most important risk-reward lessons:
A ratio can be improved on paper simply by moving the target farther away. That does not improve the probability of reaching it.
Use Support and Resistance in the Stock Market to identify logical price zones rather than choosing a target only to manufacture a high ratio.
Example 4: A Poor Ratio That Needs a High Win Rate
Assume:
- entry: ₹600;
- stop-loss: ₹570;
- target: ₹615.
Risk per share:
₹600 − ₹570 = ₹30
Reward per share:
₹615 − ₹600 = ₹15
Risk-reward ratio: 1:0.5
The theoretical break-even win rate is 66.67% before costs.
Suppose the trader takes ten similar trades:
- seven wins of ₹15 per share = ₹105;
- three losses of ₹30 per share = ₹90;
- gross result = ₹15 per share before charges.
Even with a 70% win rate, the gross edge is small. Brokerage, statutory charges and slippage could absorb a meaningful portion of it. Testing this type of setup through the Brokerage Calculator is essential because a high win rate can hide a weak payoff structure.
Example 5: A Short Position
Assume:
- short entry: ₹750;
- stop-loss: ₹780;
- target: ₹660;
- quantity: 100 shares.
Risk per share:
₹780 − ₹750 = ₹30
Reward per share:
₹750 − ₹660 = ₹90
Risk-reward ratio: 1:3
Total planned risk:
₹30 × 100 = ₹3,000
Total potential reward:
₹90 × 100 = ₹9,000
The Risk-Reward Calculator can handle this because it uses the absolute distance between the three prices. However, short selling introduces additional operational and market risks, and availability and settlement rules depend on the product and segment. This example is arithmetic education, not a recommendation.
Example 6: Charges Change the Effective Ratio
Assume:
- gross planned loss: ₹2,000;
- gross potential profit: ₹4,000;
- gross ratio: 1:2.
Now assume estimated round-trip charges are ₹300.
If the target is reached:
Net potential profit = ₹4,000 − ₹300 = ₹3,700
If the stop is reached:
Approximate net loss = ₹2,000 + ₹300 = ₹2,300
Effective net reward-to-risk multiple:
₹3,700 ÷ ₹2,300 = 1.61
The effective ratio is approximately 1:1.61, not 1:2.
The exact charge structure depends on delivery or intraday treatment, brokerage plan, turnover and current statutory rates. Enter the trade into the RegalTicker Brokerage Calculator, then compare the estimated net result with the gross ratio shown by the Risk-Reward Calculator.
Example 7: Partial Profit Booking
Assume a trader buys 200 shares with:
- entry: ₹500;
- stop-loss: ₹480;
- first target: ₹530 for 100 shares;
- second target: ₹560 for 100 shares.
Risk per share is ₹20.
First 100 shares:
Reward = ₹30 × 100 = ₹3,000
Second 100 shares:
Reward = ₹60 × 100 = ₹6,000
Total potential reward = ₹9,000
Total planned risk = ₹20 × 200 = ₹4,000
Blended reward-to-risk multiple:
₹9,000 ÷ ₹4,000 = 2.25
Blended ratio: 1:2.25
This is more informative than calling the entire setup 1:3 based only on the farther target. The actual plan includes two exits, so the weighted reward should reflect both.
Example 8: Averaging Changes the Entry and Ratio
Assume an investor-trader buys:
- 100 shares at ₹300;
- another 100 shares at ₹280.
The weighted average entry becomes ₹290 before charges. Use the Stock Average Calculator to confirm the revised average.
If the stop remains ₹270 and the target remains ₹330:
- revised risk per share = ₹290 − ₹270 = ₹20;
- revised reward per share = ₹330 − ₹290 = ₹40;
- revised ratio = 1:2.
However, total quantity has doubled, so total planned risk becomes:
₹20 × 200 = ₹4,000
Averaging can improve the average entry but increase total rupee exposure. Recalculate both the ratio and the position size instead of looking only at the lower average price.
Risk-Reward Ratio, Probability and Expectancy
A ratio alone is incomplete because it says nothing about how often the target is likely to be reached before the stop.
A strategy can have:
- a high win rate with small average gains and larger losses;
- a low win rate with large average gains and smaller losses;
- an attractive planned ratio but poor execution;
- a modest planned ratio but strong consistency.
The goal is not to maximise the displayed ratio. The goal is to develop a repeatable process in which average gains, average losses, win rate and costs produce a positive expected outcome.
Trading Expectancy Formula
A simplified expectancy formula is:
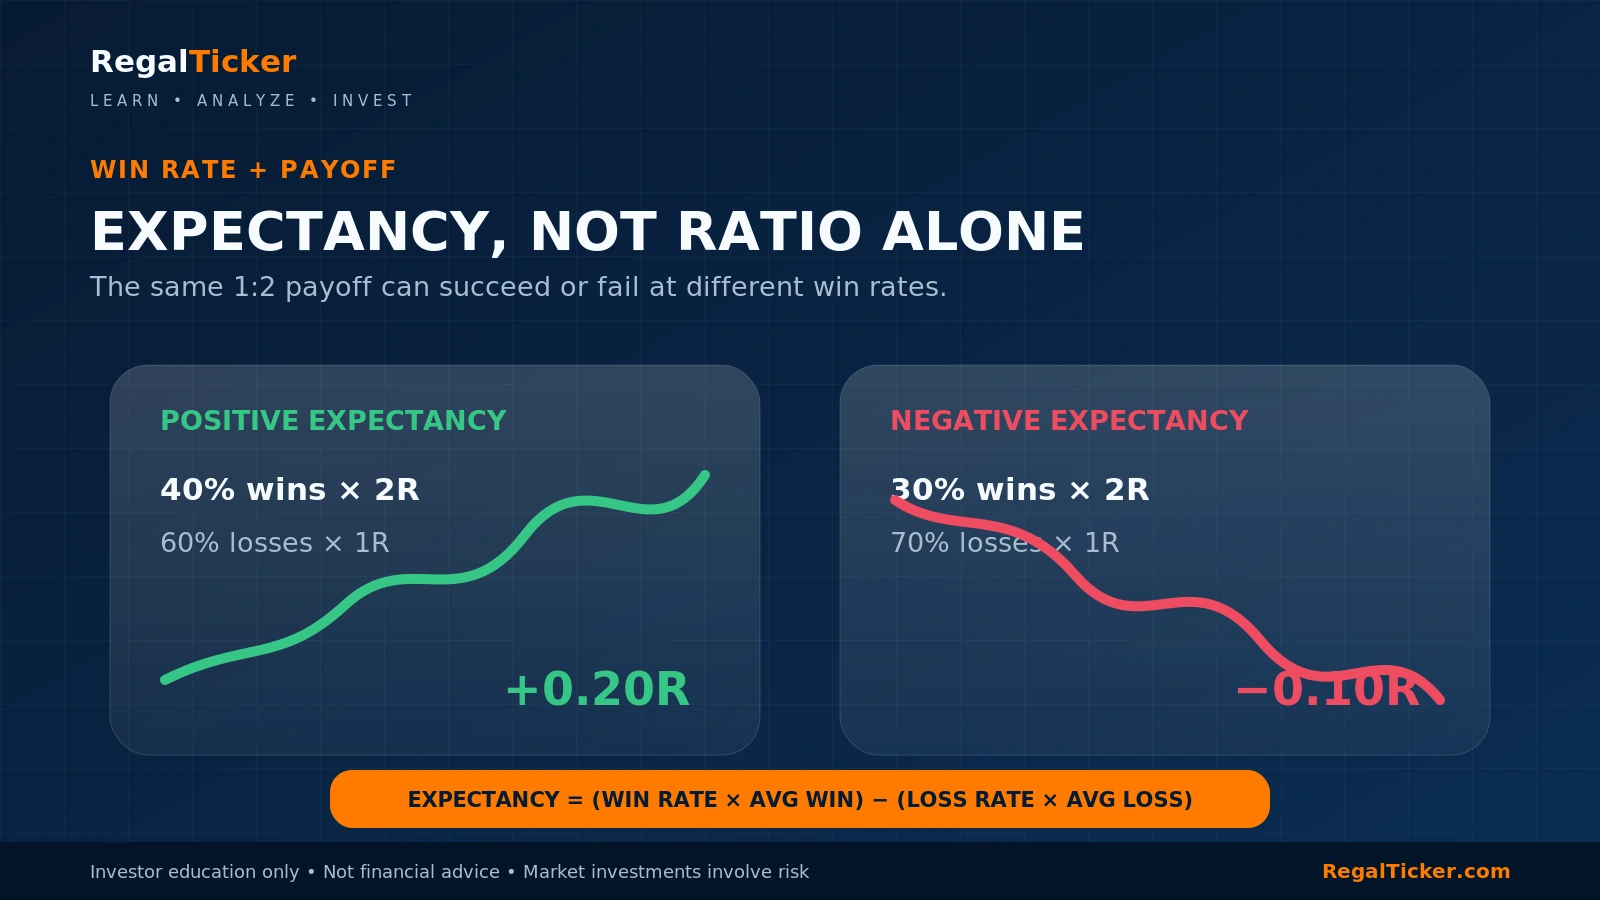
Expectancy = (Win rate × Average win) − (Loss rate × Average loss)
Results can be expressed in rupees or in “R,” where 1R is the amount risked on one trade.
Suppose:
- win rate: 40%;
- average win: 2R;
- loss rate: 60%;
- average loss: 1R.
Expectancy:
(0.40 × 2R) − (0.60 × 1R)
= 0.80R − 0.60R
= +0.20R per trade before costs
Over a large sample, the strategy has positive mathematical expectancy under those assumptions.
Now suppose the same strategy has a 30% win rate:
(0.30 × 2R) − (0.70 × 1R)
= 0.60R − 0.70R
= −0.10R per trade before costs
The 1:2 ratio did not change, but the expectancy became negative because the win rate fell below the break-even level.
Why a Higher Ratio Is Not Automatically Better
A 1:5 plan may be less attractive than a 1:2 plan when:
- the farther target is rarely reached;
- the trade often moves in favour and then reverses;
- the market’s normal range is too small;
- the holding period is insufficient;
- major resistance lies before the target;
- the stop is artificially tight;
- early exits reduce the realised average win;
- the entry occurs after the main move.
A large displayed ratio can be a sign of discipline, but it can also be a sign of unrealistic assumptions.
Planned Ratio vs Realised Ratio
The planned ratio is calculated before entry.
The realised R-multiple is calculated after exit:
Realised R = Actual profit or loss ÷ Initial planned risk
Examples:
- full stop-loss = approximately −1R;
- half of planned loss = −0.5R;
- gain equal to the initial risk = +1R;
- gain three times the initial risk = +3R.
Track both numbers. A strategy may repeatedly plan 1:3 trades but realise average winners of only 1.2R because profits are booked early. In that case, the realised data—not the optimistic target—should guide future expectations.
Use the Stock Return Calculator after an exit to measure the actual profit, total return and annualised return where relevant. For a trade journal, also record the realised R-multiple and actual charges.
Costs Raise the Required Win Rate
The theoretical break-even formula assumes no friction. In reality, costs make the required win rate higher.
Costs may include:
- brokerage;
- securities transaction tax;
- exchange transaction charges;
- SEBI turnover fees;
- GST on applicable service components;
- stamp duty;
- DP charges for eligible delivery sales;
- bid-ask spread;
- slippage;
- capital gains tax.
The Brokerage Calculator estimates the main entered Indian equity transaction charges and break-even selling price. Taxes can also affect the final outcome, so verify the current rules and your personal treatment through official sources or a qualified professional.
Risk-reward decisions should first be based on market structure, but a setup with a very small gross edge may become unattractive after realistic friction.
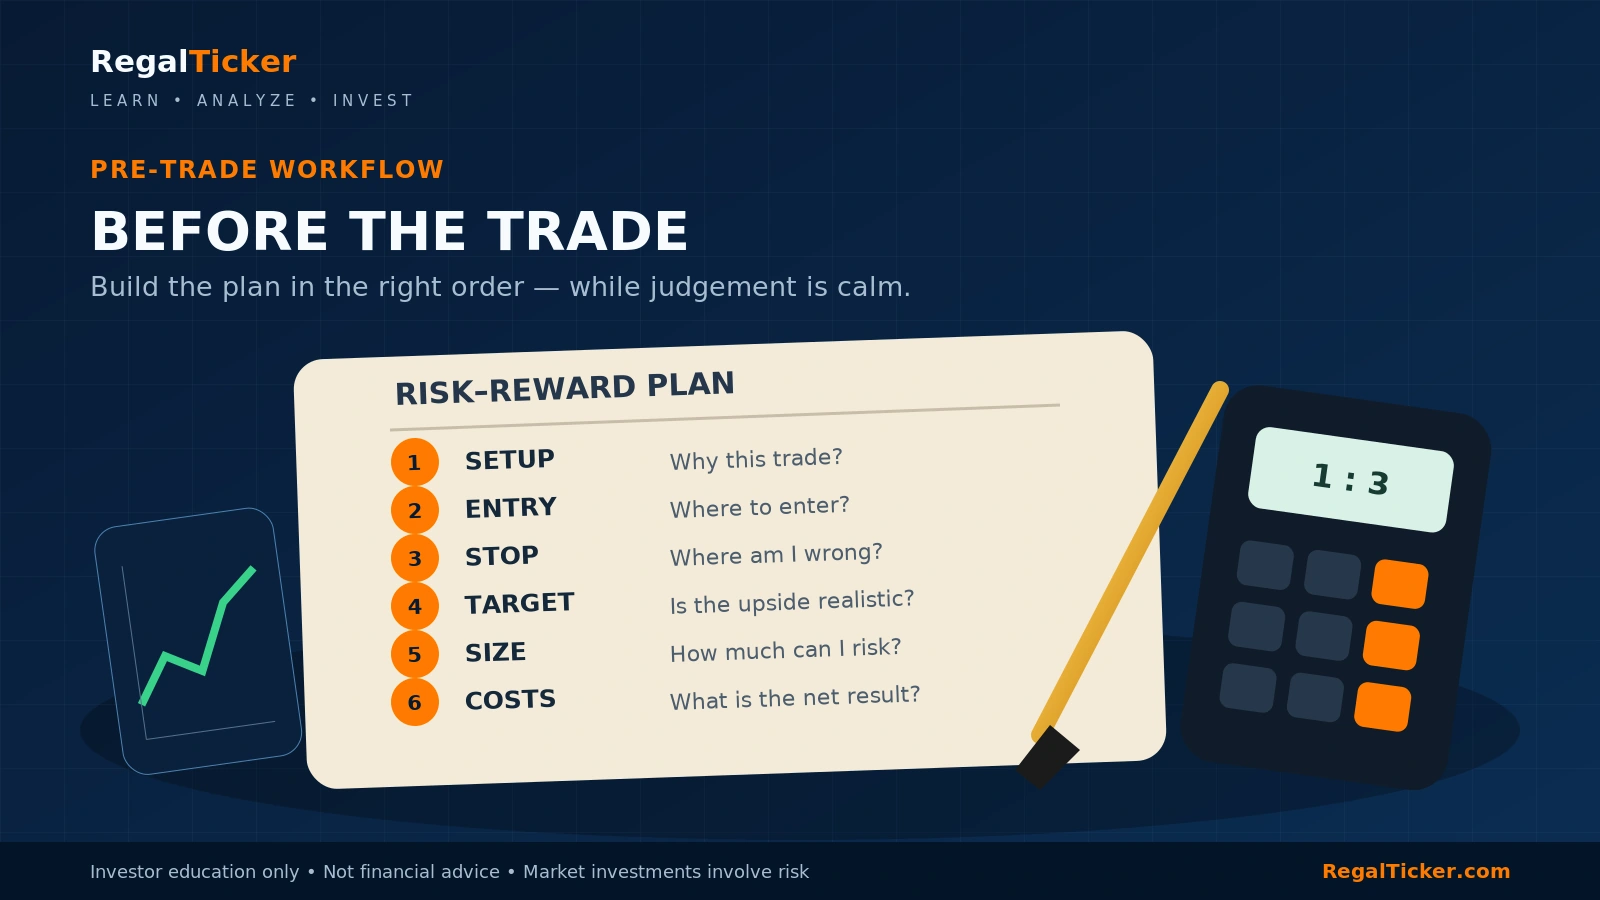
How to Build a Complete Risk-Reward Trade Plan
A disciplined risk-reward calculation follows analysis. It should not be the first step.
Step 1: Define the Setup or Thesis
Write why the position is being considered.
For a technical setup, this may include:
- trend direction;
- support or resistance;
- breakout or retest;
- candlestick confirmation;
- volume behaviour;
- market context.
For a longer-term investment, it may include:
- business quality;
- earnings expectations;
- valuation;
- balance-sheet strength;
- management execution;
- identifiable downside scenarios.
The plan must be understandable in one or two sentences. A vague reason produces a vague invalidation point.
Step 2: Choose a Logical Entry
The entry should come from the setup—not from fear of missing out.
Waiting for a better entry can improve the ratio because it reduces the distance to the invalidation level and preserves more space to the target. Chasing price can do the opposite.
Compare two possible entries using the Risk-Reward Calculator:
- original planned entry;
- later chased entry.
Keep the same logical stop and target. The comparison will show how quickly the ratio deteriorates when price is chased.
Step 3: Define Invalidation
The stop-loss or invalidation point should answer:
At what price or evidence is the original idea no longer valid?
A stop placed only to create a preferred ratio is backwards.
For example, if market structure requires a stop ₹20 below entry, moving it to ₹5 below entry may improve the displayed ratio but expose the trade to ordinary price movement. The correct response may be a smaller quantity—not an illogical stop.
Step 4: Set a Realistic Target
A target may be based on:
- previous resistance or support;
- range projection;
- trend structure;
- measured move;
- valuation scenario;
- expected holding-period return;
- a staged exit plan.
The target should be plausible within the selected timeframe. It does not need to be guaranteed, but it should be supported by evidence.
Step 5: Calculate the Ratio
Enter the three prices into the RegalTicker Risk-Reward Calculator.
Review:
- risk per share;
- reward per share;
- reward-to-risk multiple;
- risk as a percentage of entry;
- total risk at the proposed quantity;
- total potential reward.
Do not accept or reject a position from the ratio alone. Use it as one decision filter.
Step 6: Calculate Position Size
Once the risk per share is known, calculate quantity from the maximum acceptable rupee loss.
Quantity = Maximum planned rupee loss ÷ Risk per share
The complete explanation is available in Position Sizing in Stock Market.
This order matters:
- setup;
- entry;
- invalidation;
- target;
- ratio;
- quantity.
Quantity should not dictate an artificial stop.
Step 7: Estimate Costs and Slippage
Enter the proposed buy price, sell price, quantity and brokerage assumptions in the Brokerage Calculator.
For a stop scenario, test the planned exit price and a worse slippage price.
For a target scenario, test the target price.
This produces a more realistic net range rather than relying only on gross price differences.
Step 8: Check Portfolio Risk
A good individual ratio does not make a group of correlated positions safe.
Before entry, check:
- total open planned risk;
- exposure to the same sector;
- exposure to the same market factor;
- concentration in one company;
- cash remaining;
- leverage;
- event risk;
- liquidity.
The Risk Management hub connects position-level arithmetic with portfolio-level protection.
Step 9: Record the Plan
A simple trade-plan record can include:
| Field | Planned value |
|---|---|
| Setup | Why the opportunity exists |
| Entry | Proposed execution area |
| Invalidation | Where the thesis becomes wrong |
| Target | Realistic exit objective |
| Quantity | Size based on risk budget |
| Planned risk | Rupees and percentage of strategy capital |
| Planned reward | Rupees |
| Risk-reward ratio | Example: 1:2.4 |
| Estimated charges | From brokerage calculation |
| Event risk | Results, news, corporate action or macro event |
| Review rule | Conditions for holding, reducing or exiting |
Use RegalTicker Calculators as One Workflow
RegalTicker’s calculators are most useful when they are used in sequence instead of as isolated tools.
1. Risk-Reward Calculator: Test the Plan
Use the Risk-Reward Calculator before entry to compare:
- entry;
- stop-loss;
- target;
- quantity;
- total potential risk;
- total potential reward.
Test more than one realistic scenario. For example:
- planned entry;
- improved entry after a pullback;
- chased entry;
- conservative target;
- extended target.
This makes the effect of each assumption visible.
2. Position Sizing Guide: Control the Quantity
After the stop distance is known, use the position sizing formula to ensure that the total planned loss remains within the selected capital limit.
A strong ratio cannot compensate for an oversized position.
3. Brokerage Calculator: Convert Gross to Net
Use the Brokerage Calculator to estimate:
- brokerage;
- STT;
- exchange charges;
- SEBI fees;
- GST;
- stamp duty;
- DP charge where applicable;
- break-even sell price;
- net result after entered charges.
This is especially important for small targets, frequent trading and large turnover.
4. Stock Average Calculator: Recalculate Staged Entries
When a position is built in several tranches, use the Stock Average Calculator to calculate the weighted average entry.
Then return to the Risk-Reward Calculator with:
- revised average entry;
- unchanged or revised invalidation;
- revised target;
- total quantity.
Do not assume that a lower average price automatically reduces total risk. Quantity may have increased substantially.
5. Stock Return Calculator: Measure the Actual Outcome
After the position is closed, use the Stock Return Calculator to calculate profit or loss and total return. For long holdings, it can also include dividends and calculate an annualised return.
Compare the actual result with:
- planned risk;
- planned reward;
- realised R-multiple;
- estimated costs;
- actual costs;
- holding period.
6. Complete Investor Tools Hub
The RegalTicker Investor Tools Hub brings together stock, portfolio, cost, tax, mutual-fund and corporate-action calculators.
For risk-reward planning, the most relevant sequence is:
Risk-Reward Calculator → Position Size → Brokerage Calculator → Stock Return Calculator
The tools support transparent arithmetic. They do not select a security, set a stop, predict a target or recommend a trade.
Risk-Reward Ratio for Traders and Investors
The ratio is easiest to calculate when a trader has a defined price entry, stop and target. Long-term investors may need a broader approach.
Short-Term Trading
A short-term trader can usually define:
- exact entry;
- technical invalidation;
- target zone;
- quantity;
- expected holding period.
The main risks are execution, slippage, gaps, changing volatility and unrealistic targets.
Swing Trading
A swing trader may use daily or weekly structure. Targets can be based on resistance, prior highs, measured moves or trend continuation.
Because positions may be held overnight, gap risk matters. The actual loss can exceed the stop-based calculation.
Long-Term Investing
A long-term investor may not use a narrow stop-loss. The invalidation may be fundamental:
- earnings deterioration;
- rising debt;
- governance concern;
- loss of competitive advantage;
- valuation becoming unsupported;
- thesis not developing within the expected period.
Instead of a single price target, the investor may use scenario analysis:
| Scenario | Estimated outcome | Probability assumption |
|---|---|---|
| Bear case | −30% | 25% |
| Base case | +20% | 50% |
| Bull case | +55% | 25% |
These are not precise forecasts. They help the investor compare downside, upside and uncertainty.
For long-term holdings, portfolio allocation, diversification and permanent capital loss may matter more than a tight trade-style ratio. SEBI advises investors to consider goals, time horizon, risk appetite, liquidity, diversification and asset allocation before investing.
Options and Leveraged Products
Options and derivatives can have nonlinear payoffs, margin requirements, time decay and potentially large losses. A simple entry-stop-target ratio may not capture their complete risk.
Beginners should not transfer a cash-equity ratio mechanically to leveraged products. Product-specific payoff, liquidity, expiry, volatility and margin risk need separate analysis.
Common Risk-Reward Ratio Mistakes
Mistake 1: Choosing the Target to Force a 1:3 Ratio
The target should come from analysis. Moving it farther away only improves the spreadsheet.
Mistake 2: Placing the Stop Too Close
A tight stop reduces calculated risk per share and improves the ratio, but ordinary volatility may trigger it repeatedly.
Mistake 3: Ignoring Probability
A 1:5 ratio is not useful when the target is reached only rarely and the actual average winner is much smaller.
Mistake 4: Ignoring Position Size
A trade can have a good ratio and still risk too much money.
Mistake 5: Ignoring Charges
A 1:1.2 gross setup may become unattractive after costs. Check it using the Brokerage Calculator.
Mistake 6: Treating the Stop as a Guarantee
Price can gap beyond a stop. Liquidity and execution matter.
Mistake 7: Chasing the Entry
When entry rises but stop and target stay unchanged, risk increases and reward decreases.
Mistake 8: Changing the Target After Entry Because of Greed
A pre-planned target can be reviewed when new evidence appears, but emotional expansion of the target can turn an available gain into a loss.
Mistake 9: Moving the Stop Farther Away to Avoid a Loss
This increases planned risk after the position has already been opened and invalidates the original calculation.
Mistake 10: Booking Every Winner Too Early
Repeated early exits can make realised average reward much smaller than the planned reward.
Mistake 11: Comparing Ratios Across Unrelated Strategies
A 1:1 intraday strategy with a high verified win rate cannot be judged by the same standard as a low-frequency breakout strategy targeting 1:4.
Mistake 12: Using One Winning Trade as Proof
A profitable outcome does not prove the plan had positive expectancy. Review a meaningful sample of consistent trades.
Mistake 13: Forgetting Correlation
Several positions with 1% planned risk each can behave like one large position when they depend on the same sector or market direction.
Mistake 14: Averaging Without Recalculating
A new purchase changes average entry, quantity, total risk and portfolio weight. Recalculate with the Stock Average Calculator and Risk-Reward Calculator.
Mistake 15: Confusing a Calculator With Advice
A calculator shows the result of entered assumptions. It cannot decide whether the assumptions are sensible.
Risk-Reward Checklist Before Entry
Use this checklist before relying on the displayed ratio:
- Is the setup or thesis written clearly?
- Is the entry based on analysis rather than urgency?
- Is the invalidation point logical?
- Does the stop allow for normal volatility?
- Is the target supported by market structure or a reasoned scenario?
- Is the target realistic within the holding period?
- Has the ratio been checked with the Risk-Reward Calculator?
- Has quantity been calculated from the maximum acceptable loss?
- Are brokerage, statutory charges and slippage considered?
- Has the net result been estimated with the Brokerage Calculator?
- Could an overnight gap create a larger loss?
- Is the security sufficiently liquid for the quantity?
- Are several open positions correlated?
- Is a company result, policy event or corporate action approaching?
- Is the plan documented before entry?
- Are partial exits included in the weighted reward calculation?
- Will the realised R-multiple be recorded after exit?
- Is the decision still acceptable if the trade loses?
- Is the money required for an essential near-term goal?
- Is the calculation being treated as education rather than certainty?
Frequently Asked Questions
What is the risk-reward ratio in stock market trading?
It compares the potential loss from entry to the stop-loss with the potential gain from entry to the target. A 1:3 ratio means risking one unit to pursue three units.
What is the risk-reward ratio formula?
For a long trade:
Risk per share = Entry − Stop-loss
Reward per share = Target − Entry
Reward-to-risk ratio = Reward per share ÷ Risk per share
Use the Risk-Reward Calculator to calculate the result directly.
Is a 1:2 risk-reward ratio good?
A 1:2 ratio means the planned reward is twice the planned risk. It may be useful when the target and stop are realistic and the strategy’s actual win rate, costs and execution support positive expectancy. No ratio is automatically good.
Is a 1:3 ratio better than 1:2?
Not necessarily. A 1:3 target may be less likely to be reached. The better plan is the one supported by realistic market structure, strategy data and disciplined execution.
What win rate is needed for a 1:2 ratio?
The theoretical break-even win rate is 33.33% before costs, assuming every win earns 2R and every loss loses 1R.
What win rate is needed for a 1:3 ratio?
The theoretical break-even win rate is 25% before costs, assuming full target and stop outcomes.
Can a strategy be profitable with a win rate below 50%?
Yes. A strategy can be profitable when average winners are sufficiently larger than average losses. Costs and execution must also be considered.
Does a stop-loss guarantee the calculated risk?
No. Gaps, slippage, low liquidity, circuit limits and execution problems can create a larger loss.
Should charges be included in risk-reward calculations?
Yes. The simple price ratio is a useful first step, but transaction costs reduce potential gains and increase the effective loss. Use the Brokerage Calculator for an estimate.
How does position size affect the ratio?
Quantity does not change the per-share ratio, but it changes the total money at risk and potential reward. Use the position sizing guide to control total exposure.
Can investors use risk-reward ratios?
Yes, but long-term investors may use broader downside and upside scenarios rather than a tight stop and target. Portfolio allocation, diversification and fundamental invalidation can be more important.
How should partial profit booking be calculated?
Multiply each target’s reward per share by the quantity planned for that target, add the results, and divide the combined potential reward by total planned risk.
What happens when I average down?
The weighted average entry and quantity change. Recalculate the average using the Stock Average Calculator, then recalculate risk, reward and total exposure.
Where can I calculate risk-reward ratio online?
Use the free RegalTicker Risk-Reward Calculator. It accepts entry, stop-loss, target and quantity and shows the ratio, total risk and total potential reward.
Which calculator should I use after closing the position?
Use the Stock Return Calculator to measure profit or loss and return. Compare the result with the initial risk plan and realised R-multiple.
Final Takeaway
The risk-reward ratio in stock market trading is a planning tool—not a prediction tool.
It helps answer:
- What is the planned loss if the idea fails?
- What is the possible gain if the target is reached?
- Is the possible upside large enough to justify the downside?
- What win rate would the payoff structure theoretically require?
- How much should be bought without exceeding the risk budget?
Use the ratio in the correct sequence:
- analyse the setup;
- choose a logical entry;
- define invalidation;
- set a realistic target;
- calculate risk and reward;
- size the position;
- estimate charges and slippage;
- review portfolio exposure;
- record the plan;
- compare planned and realised outcomes.
The RegalTicker Risk-Reward Calculator makes the arithmetic transparent, the Brokerage Calculator helps convert gross figures into estimated net outcomes, and the complete Investor Tools Hub supports the wider planning workflow.
A high displayed ratio is not enough. The stop must be logical, the target must be realistic, the quantity must be controlled and the strategy must demonstrate acceptable results over a meaningful sample.
Continue Learning on RegalTicker
- Risk Management in Stock Market: A Beginner’s Guide
- Position Sizing in Stock Market: Formula, Methods and Examples
- Support and Resistance in the Stock Market
- Market Order, Limit Order, Stop-Loss and Stop-Limit Order
- Risk Management Learning Hub
- All RegalTicker Investor Tools
This completes the first three Risk & Psychology articles in the current learning-hub rotation. The next roadmap step should move to the next learning hub before returning for the deeper Risk & Psychology lessons.
Official References
- SEBI Investor — Key Risks in Investing
- SEBI Investor — Factors to Consider Before Investing
- SEBI Investor — How to Manage Investment Risks
- NSE India — Trading System and Stop-Loss Order Conditions
- SEBI Investor — Investor Education Reading Material
Educational disclaimer: This article is for investor education and general information only. It is not financial advice, personalised investment advice, a research recommendation, a solicitation, or a guarantee of returns. Market prices, liquidity, costs, taxes and regulations can change. Stop-loss orders may execute at prices different from their triggers, and actual losses can exceed planned amounts. Verify current information through official sources, conduct independent research and consult an appropriately qualified professional where necessary.