
⚡ Quick answer
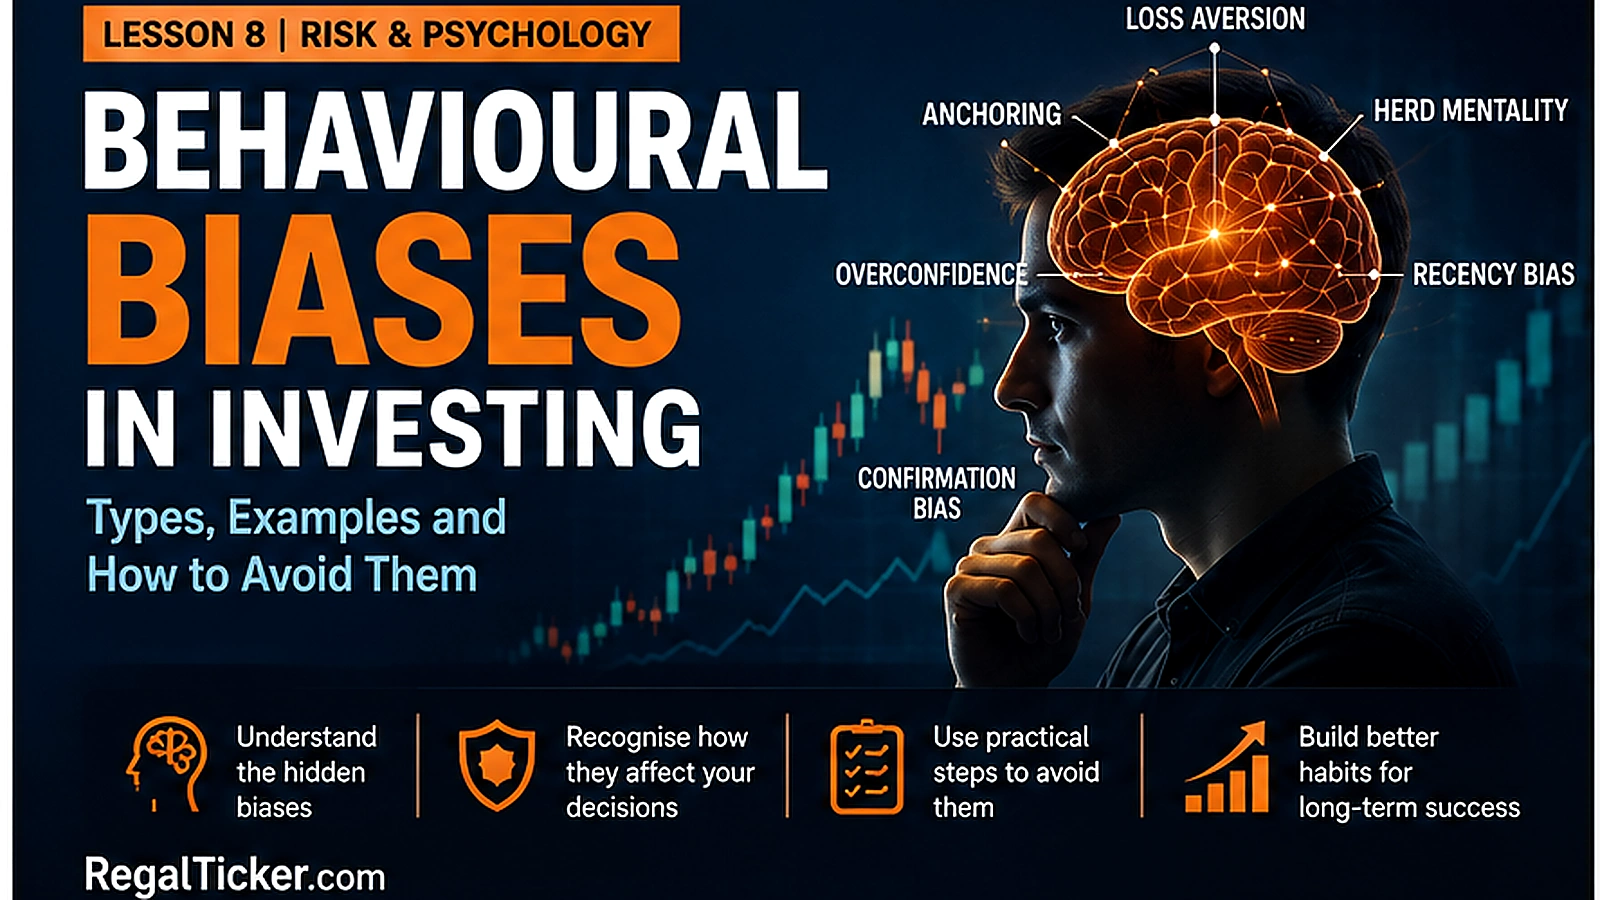
Behavioural biases in investing are predictable mental shortcuts and emotional tendencies that influence how investors interpret information, evaluate risk and make decisions. Common examples include loss aversion, anchoring, confirmation bias, recency bias, herd behaviour and overconfidence. A bias does not automatically make every decision wrong, but it can cause investors to ignore evidence, chase recent performance, hold deteriorating investments, trade too frequently or take risks that do not match their goals.
Investor note
Key Takeaways
A behavioural bias is usually invisible to the person experiencing it. Good intentions and market knowledge do not remove bias. Loss aversion can encourage investors to hold losers and sell winners too quickly. Anchoring can make the purchase price feel more important than current evidence. Confirmation bias filters research so that supportive information receives more attention. Recency bias exaggerates the importance of the latest market movement. Herd behaviour replaces independent analysis with social agreement. Overconfidence often increases after a strong market or winning streak. Action bias can create unnecessary trading costs and tax consequences. Written rules, external comparisons and calculators make decisions easier to audit. The objective is not perfect rationality; it is fewer costly, repeated mistakes.
Behavioural finance begins with an uncomfortable idea:
An investor can be intelligent, informed and sincere while still making a predictably distorted decision.
The mind uses shortcuts because markets present too much information, uncertainty and emotional pressure to analyse perfectly. These shortcuts can be useful in daily life. In investing, however, they can create repeated errors.
Examples include:
treating the purchase price as the stock’s true value; following a popular idea because social agreement feels safer; expecting the recent trend to continue indefinitely; refusing to sell because the loss would become official; increasing exposure after several successful decisions; repeatedly checking the portfolio and trading to reduce anxiety; remembering winning decisions more clearly than losing ones; searching for evidence that supports an existing belief.
This lesson follows Trading Psychology: Fear, Greed and Discipline and the earlier Risk & Psychology lessons on risk management, position sizing, risk-reward ratio, stop-loss orders, diversification and asset allocation and portfolio drawdown.
The previous lesson explained emotional pressure during a trade. This lesson examines the deeper patterns that distort research, portfolio construction and long-term investment decisions.
SEBI encourages investors to conduct independent research, understand risk, invest according to objectives and risk appetite, review portfolios periodically and avoid decisions based on hot tips or rumours.
Those practices are also practical defences against behavioural bias.
What Are Behavioural Biases in Investing?
A behavioural bias is a systematic tendency to judge information or make decisions in a way that departs from a fully evidence-based process.
The word systematic matters.
A random mistake may happen once. A behavioural bias tends to repeat in similar situations.
Cognitive Biases vs Emotional Biases
Cognitive biases mainly affect how information is processed.
Examples include:
- anchoring;
- confirmation bias;
- recency bias;
- availability bias;
- framing;
- hindsight bias.
Emotional biases mainly affect how feelings influence action.
Examples include:
- loss aversion;
- regret aversion;
- status quo bias;
- endowment effect;
- fear of missing out.
The categories overlap. An investor can experience several biases during one decision.
Bias Is Not the Same as Ignorance
A knowledgeable investor may understand valuation, accounting and portfolio theory but still:
- anchor to an earlier forecast;
- defend a familiar company;
- overweight recent performance;
- avoid admitting an error;
- trade too much after a winning period.
Education helps, but a process is also required.
A Bias Can Produce a Profitable Result
A biased decision does not always lose money.
An investor may chase a popular stock and profit because the rally continues.
The profit can strengthen the belief that chasing is a sound strategy.
This is why decision quality and financial outcome must be reviewed separately.
The Cost Can Be Direct or Hidden
Bias can create direct costs:
- realised losses;
- brokerage;
- statutory charges;
- taxes;
- poor entry prices.
It can also create hidden costs:
- missed diversification;
- delayed goal achievement;
- excess concentration;
- opportunity cost;
- unnecessary stress;
- abandoning a suitable long-term plan.
Why Biases Become Stronger in Markets
Markets create an ideal environment for biased decisions.
Uncertainty
No investor knows the future with certainty. When evidence is incomplete, the mind often relies on familiar shortcuts.
Immediate Feedback
Prices change continuously. Every change can feel like feedback on the investor’s intelligence, even when it is ordinary noise.
Social Comparison
Investors can see other people’s claimed profits, screenshots and opinions immediately.
The comparison is rarely complete because losses, leverage and unsuccessful trades may be hidden.
Personal Money
A market opinion becomes emotionally stronger when savings, goals and identity are attached to it.
Selective Memory
A profitable investment is easy to remember. The missed opportunities and abandoned ideas that did not work may receive less attention.
No Clear Counterfactual
After a decision, the investor cannot observe every alternative future.
Selling may look wrong because the price later rose. Holding may look wrong because the price later fell. Hindsight makes the result appear more predictable than it was.
Loss Aversion and the Disposition Effect
Loss aversion is the tendency to experience a loss more strongly than an equivalent gain.
In investing, it often combines with the disposition effect:
- winners are sold early;
- losers are held too long.
Why Investors Hold Losing Positions
Common thoughts include:
- “It is not a real loss until I sell.”
- “The price only needs to return to my purchase price.”
- “I have already waited this long.”
- “Selling now would prove that I was wrong.”
- “The stock must eventually recover.”
None of these statements evaluates the current investment thesis.
Why Investors Sell Winners Early
A gain creates the fear that the profit may disappear.
Selling creates certainty and emotional relief.
This can produce a portfolio containing:
- weak positions that remain;
- strong positions that were removed;
- many small gains;
- occasional large losses.
Worked Example
An investor holds two shares:
| Holding | Purchase value | Current value | Current result |
|---|---|---|---|
| Company A | ₹1,00,000 | ₹1,18,000 | +18% |
| Company B | ₹1,00,000 | ₹78,000 | −22% |
The investor sells Company A because the gain feels satisfying and retains Company B only because selling would realise the loss.
A better question is:
Which company would I buy today if I held neither?
Use the Stock Return Calculator to calculate each holding’s actual result, including dividends where relevant. The calculator does not determine which company is better, but it replaces vague memory with clear numbers.
Sunk Cost and Endowment Effect
The sunk-cost fallacy treats money, time or research already spent as a reason to continue.
The endowment effect can make an owned investment feel more valuable simply because it is already in the portfolio.
Past effort cannot improve the future prospects of an investment.
Controls for Loss Aversion
- Define thesis-failure conditions before investing.
- Review holdings as though they were new opportunities.
- Compare the holding with realistic alternatives.
- Use position limits so one decision does not become emotionally overwhelming.
- Record why a loser is being retained.
- Separate tax planning from denial.
- Review the complete portfolio, not only the purchase price.

Anchoring and Confirmation Bias
Anchoring occurs when an investor gives excessive importance to an initial number or belief.
Common anchors include:
- purchase price;
- 52-week high;
- analyst target;
- IPO price;
- old valuation multiple;
- previous portfolio peak;
- a friend’s prediction.
Purchase-Price Anchoring
Suppose a stock was purchased at ₹800 and now trades at ₹560.
The investor says:
“I will sell when it returns to ₹800.”
The number ₹800 may have no relationship with the company’s current earnings, debt, governance or competitive position.
If several purchases were made, use the Stock Average Calculator to calculate the weighted average accurately. Then ask a separate question:
Does the current investment still deserve capital?
52-Week High Anchoring
A stock at ₹600 may look cheap because it once traded at ₹1,000.
That comparison is incomplete.
The business, industry or valuation may have changed.
A lower price does not automatically create value.
Confirmation Bias
Confirmation bias encourages investors to:
- search for supportive opinions;
- dismiss negative evidence;
- follow commentators who agree;
- reinterpret bad news as temporary;
- treat rising price as proof;
- avoid reading opposing research.
The problem is not confidence. It is an evidence filter.
Confirmation-Bias Test
Before adding or holding an investment, write:
- The strongest evidence supporting the thesis
- The strongest evidence against it
- The fact that would change the decision
- The source of each claim
- The date the thesis should be reviewed
Worked Example: Averaging Down
An investor buys:
- 100 shares at ₹500;
- 100 shares at ₹400;
- 200 shares at ₹300.
Weighted average:
(₹50,000 + ₹40,000 + ₹60,000) ÷ 400 = ₹375
The Stock Average Calculator confirms the average price.
However, the calculation does not show whether the investor added because:
- valuation improved;
- the thesis remained intact;
- position size was planned;
or because:
- the lower price supported the original belief;
- admitting an error felt painful;
- the purchase price anchor became stronger.
Controls for Anchoring and Confirmation Bias
- Use current evidence rather than the original entry.
- Write a “sell or reduce” thesis before buying.
- Seek disconfirming information deliberately.
- Use base rates and comparable businesses.
- Set review dates.
- Require new evidence before adding.
- Ask another person to challenge the thesis.
- Record facts separately from interpretations.

Social, Recent and Confidence Biases
Recency Bias and Availability Bias
Recency bias gives excessive weight to the latest events.
Availability bias gives excessive weight to information that is vivid, memorable or easy to recall.
Recent Returns Feel Permanent
After a strong rally, investors may assume:
- high returns are normal;
- volatility has disappeared;
- the best-performing asset will continue leading;
- a conservative allocation is unnecessary.
After a sharp decline, they may assume:
- markets are permanently unsafe;
- recovery is unlikely;
- cash is the only sensible choice.
Both decisions may be driven by the latest experience rather than the complete evidence.
Use Longer Measurement Periods
The CAGR Calculator converts a beginning and ending value into a smoothed annual growth rate.
It can help correct exaggerated impressions created by one exceptional year.
However, CAGR also hides the path. Review it together with drawdown, volatility and the holding period.
Cash Flows Distort Memory
An investor may believe that a SIP performed poorly because the current gain appears small.
Later instalments had less time to grow.
Use the XIRR Calculator when investments, dividends or withdrawals occurred on different dates.
Headlines and Availability
A dramatic fraud, crash or multibagger story may dominate attention because it is memorable.
A vivid story is not necessarily a common outcome.
Ask:
- How frequently does this happen?
- Is the source representative?
- What information is missing?
- Am I confusing a memorable example with a probable result?
Herd Behaviour and Social Proof
Herd behaviour occurs when investors follow a group because social agreement feels like evidence.
Why the Crowd Feels Safe
The investor may think:
- many people cannot all be wrong;
- popular investors must know more;
- missing the trend is more dangerous than joining;
- social approval reduces responsibility.
The crowd can be right about direction but still create a poor entry price.
The FOMO Link
SEBI’s warning material on “stock market guru” scams describes how communities, selective success stories and fear of missing out can pressure people into impulsive decisions.
The risk becomes greater when the investor does not independently verify:
- registration;
- assumptions;
- risk;
- fees;
- past losses;
- conflicts of interest.
Worked Example: Chasing a Popular Stock
Original plan:
- entry: ₹250;
- stop: ₹230;
- target: ₹310.
Risk per share = ₹20 Reward per share = ₹60 Risk-reward ratio = 1:3
After social excitement, the investor enters at ₹295.
New risk = ₹65 Remaining reward = ₹15 Reward-to-risk multiple = 0.23
Use the Risk-Reward Calculator to compare the planned and chased entries.
Popularity did not preserve the original trade.
Controls for Herd Behaviour
- Require an independent written reason.
- Verify sources and registration.
- Recalculate risk using the current price.
- Wait through an emotional cooling period.
- Limit exposure to unfamiliar ideas.
- Avoid decisions based only on screenshots or testimonials.
- Treat urgency as a warning sign.
Overconfidence and Self-Attribution Bias
Overconfidence is excessive belief in one’s knowledge, forecasting skill or ability to control outcomes.
Self-attribution bias credits successes to skill and blames failures on external events.
Signs of Overconfidence
- frequent trading;
- increasing position size rapidly;
- ignoring diversification;
- refusing to compare with a benchmark;
- using leverage after a winning period;
- reducing research;
- believing a stop is unnecessary;
- expecting past success to continue.
Bull Markets Can Hide Weak Decisions
A broad rally can make many strategies look effective.
The investor may confuse:
- market exposure with stock-selection skill;
- leverage with insight;
- luck with repeatable edge;
- recent return with long-term competence.
Compare with a Benchmark and Risk
Use the Stock Return Calculator to measure the actual holding return.
Use the CAGR Calculator for a multi-year lump-sum comparison.
Then compare:
- return against a relevant benchmark;
- risk taken;
- concentration;
- drawdown;
- taxes and costs.
A higher return achieved with much higher risk is not automatically superior.
Trading Frequency and Costs
Overconfidence often increases action.
Use the Brokerage Calculator to estimate the cost of repeated delivery or intraday transactions.
A strategy can look profitable before costs and weak after them.
Controls for Overconfidence
- Use fixed position-size rules.
- Compare results with a suitable benchmark.
- Separate market return from active decisions.
- Review losing and winning decisions equally.
- Limit strategy changes after short winning periods.
- Record prediction confidence before the outcome.
- Use a minimum sample size before increasing risk.

Portfolio and Decision-Making Biases
Familiarity Bias, Home Bias and Concentration
Familiarity bias makes known companies, industries or products feel safer than unfamiliar ones.
Home bias favours investments from the investor’s own country or region.
Familiar Does Not Mean Low Risk
An investor may concentrate in:
- employer shares;
- local companies;
- one industry understood through work;
- popular domestic brands;
- companies used personally.
Knowledge can be useful, but concentration creates dependence on the same economic outcome.
Employer-Share Risk
An employee may receive income and hold a large investment in the same company.
If the business experiences difficulty:
- employment income may weaken;
- the share price may fall;
- future bonuses may decline.
Several financial risks become correlated.
Control through Allocation
Review Diversification and Asset Allocation Explained and set explicit limits for:
- one company;
- one sector;
- employer shares;
- one theme;
- illiquid holdings.
Bias control is easier when limits are written before enthusiasm grows.
Mental Accounting and Framing
Mental accounting treats money differently depending on its label or source.
Examples include:
- taking greater risk with a bonus;
- treating dividends as “free money”;
- keeping a losing investment separate from the rest of the portfolio;
- refusing to sell because the tax account looks different;
- judging each holding independently instead of reviewing portfolio risk.
Money Is Fungible, Goals Are Not
A rupee has the same financial value regardless of whether it came from:
- salary;
- dividend;
- bonus;
- tax refund;
- profit.
However, goals may require separate buckets because time horizon and liquidity needs differ.
The important distinction is between purposeful allocation and emotional labelling.
Framing Changes the Decision
A statement can be framed as:
- “The investment retained 80% of its value.”
- “The investment lost 20%.”
Both describe the same outcome.
Review decisions in both gain and loss terms.
Tax Framing
Taxes matter, but they should not become a reason to keep an unsuitable investment indefinitely.
Use the Capital Gains Tax Calculator to estimate the tax effect of a realised listed-equity gain under the entered assumptions.
Then compare the tax with:
- investment risk;
- opportunity cost;
- portfolio concentration;
- goal alignment.
Action Bias, Status Quo Bias and Inertia
Action bias creates the feeling that doing something is safer than waiting.
Status quo bias favours keeping the current position because change requires a decision.
They can produce opposite but equally costly behaviours.
Action Bias
Examples:
- trading after every headline;
- rebalancing too frequently;
- changing funds repeatedly;
- adding indicators;
- checking price constantly;
- exiting because uncertainty feels uncomfortable.
Status Quo Bias
Examples:
- keeping a poor holding because it is already owned;
- retaining an unsuitable allocation;
- failing to consolidate forgotten investments;
- avoiding a necessary review;
- continuing an old strategy after goals changed.
The Cost of Unnecessary Activity
Suppose an investor performs 80 extra trades during a year.
Even when brokerage is low, total costs may include:
- STT;
- exchange transaction charges;
- GST;
- stamp duty;
- DP charges;
- bid-ask spread;
- slippage;
- taxes.
Use the Brokerage Calculator to convert “small” activity costs into an annual number.
The Cost of Doing Nothing
Inertia can preserve:
- excessive concentration;
- unsuitable risk;
- old nominee details;
- unused accounts;
- high-cost products;
- failed investment theses.
A scheduled review prevents both overreaction and neglect.
Outcome Bias and Hindsight Bias
Outcome bias judges a decision only by the result.
Hindsight bias makes the result appear obvious after it occurs.
Good Decision, Bad Outcome
An investor:
- performs due diligence;
- uses a sensible allocation;
- limits position size;
- buys at a reasonable valuation.
An unexpected event causes a loss.
The outcome is poor, but the decision may have been reasonable with the available information.
Bad Decision, Good Outcome
Another investor:
- follows a rumour;
- uses excessive concentration;
- performs no research;
- earns a profit.
The outcome is good, but the process remains dangerous.
Prediction Journal
Before a decision, record:
- expected outcome;
- confidence level;
- key assumptions;
- alternative scenario;
- conditions that would prove the thesis wrong.
After the result, compare with the original note.
This reduces the tendency to rewrite the past.
A Behavioural-Bias Control Framework
Bias cannot be removed completely. It can be made visible and less expensive.
Use five steps.
Step 1: Pause
Create a delay before major actions.
The delay may be:
- ten minutes for a planned trade;
- one trading session for an unplanned purchase;
- several days for a major portfolio change.
Step 2: Measure
Replace impressions with numbers.
Depending on the decision, use:
- Stock Return Calculator;
- CAGR Calculator;
- XIRR Calculator;
- Stock Average Calculator;
- Risk-Reward Calculator;
- Brokerage Calculator;
- Capital Gains Tax Calculator.
Step 3: Compare
Compare with:
- the original thesis;
- a suitable benchmark;
- an alternative investment;
- target allocation;
- historical ranges;
- current valuation;
- written risk limits.
Step 4: Decide
Choose among:
- buy;
- hold;
- reduce;
- sell;
- wait;
- seek qualified advice.
“No action” should be an explicit decision, not avoidance.
Step 5: Review
Record:
- the decision;
- evidence;
- expected outcome;
- actual outcome;
- bias observed;
- process improvement.

Worked Bias Examples
Example 1: Loss Aversion
An investor holds a company down 35%.
The thesis has weakened, but the investor refuses to sell until the purchase price is recovered.
Control:
- ignore the entry price temporarily;
- compare with alternatives;
- document the current thesis;
- calculate the tax and transaction effect;
- decide from current evidence.
Example 2: Recency Bias
A sector fund rises 45% in one year.
The investor assumes the return will repeat and moves a large part of the portfolio into it.
Control:
- review a longer period;
- compare CAGR;
- examine drawdowns;
- apply a sector-allocation limit;
- avoid extrapolating one year.
Example 3: Confirmation Bias
An investor reads only positive commentary about a company.
Control:
- find the strongest opposing argument;
- read exchange filings;
- identify the thesis-failure condition;
- set a review date.
Example 4: Herd Behaviour
A popular stock rises rapidly after social-media attention.
Control:
- ignore the crowd size;
- recalculate risk-reward at the current price;
- verify the business and source;
- wait through a cooling period.
Example 5: Overconfidence
After eight profitable trades, a trader triples normal quantity.
Control:
- use fixed risk percentages;
- review the sample size;
- compare with the market trend;
- require stable execution before increasing size.
Example 6: Action Bias
An investor changes the portfolio after every news headline.
Control:
- review on a schedule;
- define tolerance bands;
- estimate brokerage and tax;
- require a material thesis change.
Example 7: Mental Accounting
An investor treats dividends as free money and takes unnecessary risk with them.
Control:
- include dividends in total return;
- allocate all cash according to the portfolio plan.
Example 8: Outcome Bias
A rumour-based investment earns a profit.
Control:
- score the process separately;
- do not repeat a weak process because it worked once.
Use RegalTicker Calculators to Challenge Bias
Calculators are useful because bias often survives through vague language.
Stock Return Calculator: Replace Selective Memory
Use the Stock Return Calculator to include:
- purchase price;
- selling or current price;
- quantity;
- dividends;
- holding period.
The result can challenge selective memory about how well a holding performed.
CAGR Calculator: Challenge Recency Bias
Use the CAGR Calculator to compare investments held for different periods.
Do not confuse CAGR with a smooth journey. Review drawdown and risk separately.
XIRR Calculator: Correct Cash-Flow Confusion
Use the XIRR Calculator for SIPs, staggered purchases, dividends and withdrawals.
This prevents simple averages from misrepresenting money-weighted performance.
Stock Average Calculator: Clarify the Anchor
Use the Stock Average Calculator to calculate the true weighted average.
Then avoid treating the average as a target that the market must revisit.
Risk-Reward Calculator: Test FOMO
Use the Risk-Reward Calculator to compare:
- original entry;
- current entry;
- logical stop;
- realistic target;
- quantity.
A popular idea may become unattractive after price changes.
Brokerage Calculator: Expose Action Bias
Use the Brokerage Calculator to calculate the effect of frequent transactions.
A small cost repeated many times can become material.
Capital Gains Tax Calculator: Separate Tax from Denial
Use the Capital Gains Tax Calculator to estimate tax on an entered listed-equity gain.
Tax is one input, not the complete investment thesis.
Investor Tools Hub
The RegalTicker Investor Tools Hub contains the complete calculator collection.
A useful sequence is:
Pause → Measure → Compare → Decide → Review
Common Mistakes and Behavioural-Bias Checklist
Common Mistakes When Managing Bias
Mistake 1: Believing Awareness Removes Bias
Knowing the bias name does not guarantee better behaviour.
Mistake 2: Using More Information as the Only Solution
More data can strengthen confirmation bias when sources are selected emotionally.
Mistake 3: Treating Every Feeling as Wrong
Fear can reveal excessive position size. Excitement can reveal unrealistic expectations.
Mistake 4: Using a Checklist Mechanically
A checklist is useful only when the answers can change the decision.
Mistake 5: Reviewing Only Losing Decisions
Winning decisions can contain dangerous process errors.
Mistake 6: Comparing with the Wrong Benchmark
A small-cap holding and a broad-market index may have different risk characteristics.
Mistake 7: Using Tax as the Only Reason to Hold
Tax efficiency cannot repair a broken thesis.
Mistake 8: Confusing Familiarity with Safety
A known company can still be highly risky or overpriced.
Mistake 9: Letting Social Approval Replace Research
Popularity is not evidence of suitability.
Mistake 10: Changing the Process after One Outcome
One success or failure is not a reliable sample.
Behavioural Bias Checklist
Before buying:
- What evidence supports the idea?
- What evidence contradicts it?
- Am I influenced by recent price movement?
- Is the idea popular because of a story or because of fundamentals?
- Is the entry still attractive now?
- What is the maximum acceptable position size?
- What would invalidate the thesis?
- Am I anchoring to a previous price?
- Have I estimated charges?
- Would I buy it without social approval?
While holding:
- Has the business changed?
- Am I keeping it only to avoid a realised loss?
- Is the position larger than intended?
- Am I reading opposing evidence?
- Has the allocation drifted?
- Am I adding because of evidence or discomfort?
- Does the investment still fit the goal?
- Are taxes influencing the decision disproportionately?
- What would I do if I held cash instead?
- Is a review scheduled?
Before selling:
- Is the thesis broken?
- Is the sale based on evidence or fear?
- Am I selling only because the position is profitable?
- What is the opportunity cost of holding?
- What are the charges and tax?
- Does the decision improve portfolio risk?
- Am I reacting to a recent headline?
- Would I make the same decision after a cooling period?
- Is partial reduction appropriate?
- Is the reason documented?
Frequently Asked Questions
What are behavioural biases in investing?
They are predictable mental shortcuts and emotional tendencies that influence investment decisions.
What is the most common investment bias?
There is no universal answer. Loss aversion, anchoring, herd behaviour, recency bias and overconfidence are all common.
What is loss aversion?
Loss aversion is the tendency to experience losses more strongly than equivalent gains, which can influence holding and selling behaviour.
What is anchoring bias?
Anchoring bias is excessive reliance on an initial reference point such as the purchase price or a previous high.
What is confirmation bias?
Confirmation bias is the tendency to seek and accept information that supports an existing belief while discounting conflicting evidence.
What is recency bias?
Recency bias gives excessive importance to the latest events or returns.
What is herd behaviour?
Herd behaviour means following the group instead of making an independent assessment.
What is overconfidence bias?
Overconfidence is excessive belief in one’s knowledge, forecasting ability or control over outcomes.
Can behavioural biases be eliminated?
Not completely. They can be reduced through written rules, measurement, external review and decision delays.
How do calculators reduce bias?
Calculators replace impressions with transparent arithmetic. They do not decide whether the assumptions or investment are appropriate.
Why do investors hold losing stocks?
Loss aversion, anchoring, hope, sunk cost and regret avoidance can all contribute.
Why do investors chase recent winners?
Recency bias, herd behaviour and fear of missing out can make recent performance appear permanent.
Is frequent portfolio review good?
Periodic review is useful. Continuous monitoring can increase action bias and emotional decisions.
How can I test confirmation bias?
Write the strongest opposing case and the evidence that would change your decision.
Does a profitable decision prove that the process was good?
No. A poor process can produce a favourable result by chance.
Final Takeaway
Behavioural biases do not disappear when an investor becomes experienced.
Experience can improve judgement, but it can also create stronger confidence in familiar beliefs.
The practical objective is not to become perfectly rational.
It is to build a decision process that makes bias:
- easier to detect;
- harder to act upon immediately;
- less expensive when it occurs;
- visible during review.
Use five actions:
- pause before material decisions;
- measure the actual numbers;
- compare with evidence and alternatives;
- decide according to written rules;
- review both process and outcome.
Use the Stock Return Calculator, CAGR Calculator, XIRR Calculator, Stock Average Calculator, Risk-Reward Calculator, Brokerage Calculator, Capital Gains Tax Calculator and complete Investor Tools Hub to make assumptions visible.
Continue Learning on RegalTicker
- Trading Psychology: Fear, Greed and Discipline
- Risk Management in Stock Market
- Position Sizing in Stock Market
- Risk-Reward Ratio in Stock Market
- Diversification and Asset Allocation Explained
- Portfolio Drawdown and Capital Protection
- Risk Management Learning Hub
- All Investor Tools
Official References
- SEBI Investor — SMART Investor
- SEBI Investor — Securities Market Investment Do’s and Don’ts
- SEBI Investor — How to Manage Investment Risks
- SEBI Investor — Investor Education Reading Material
- SEBI Investor — Stock Market Guru Scam Warning
Educational disclaimer: This article is for general investor education only. It is not personalised financial advice, investment advice, tax advice, a research recommendation, a solicitation or a guarantee of returns. Investment values can rise or fall, rules and taxes can change, and past performance does not guarantee future results. Verify current information through official sources and seek advice from appropriately qualified professionals where necessary.