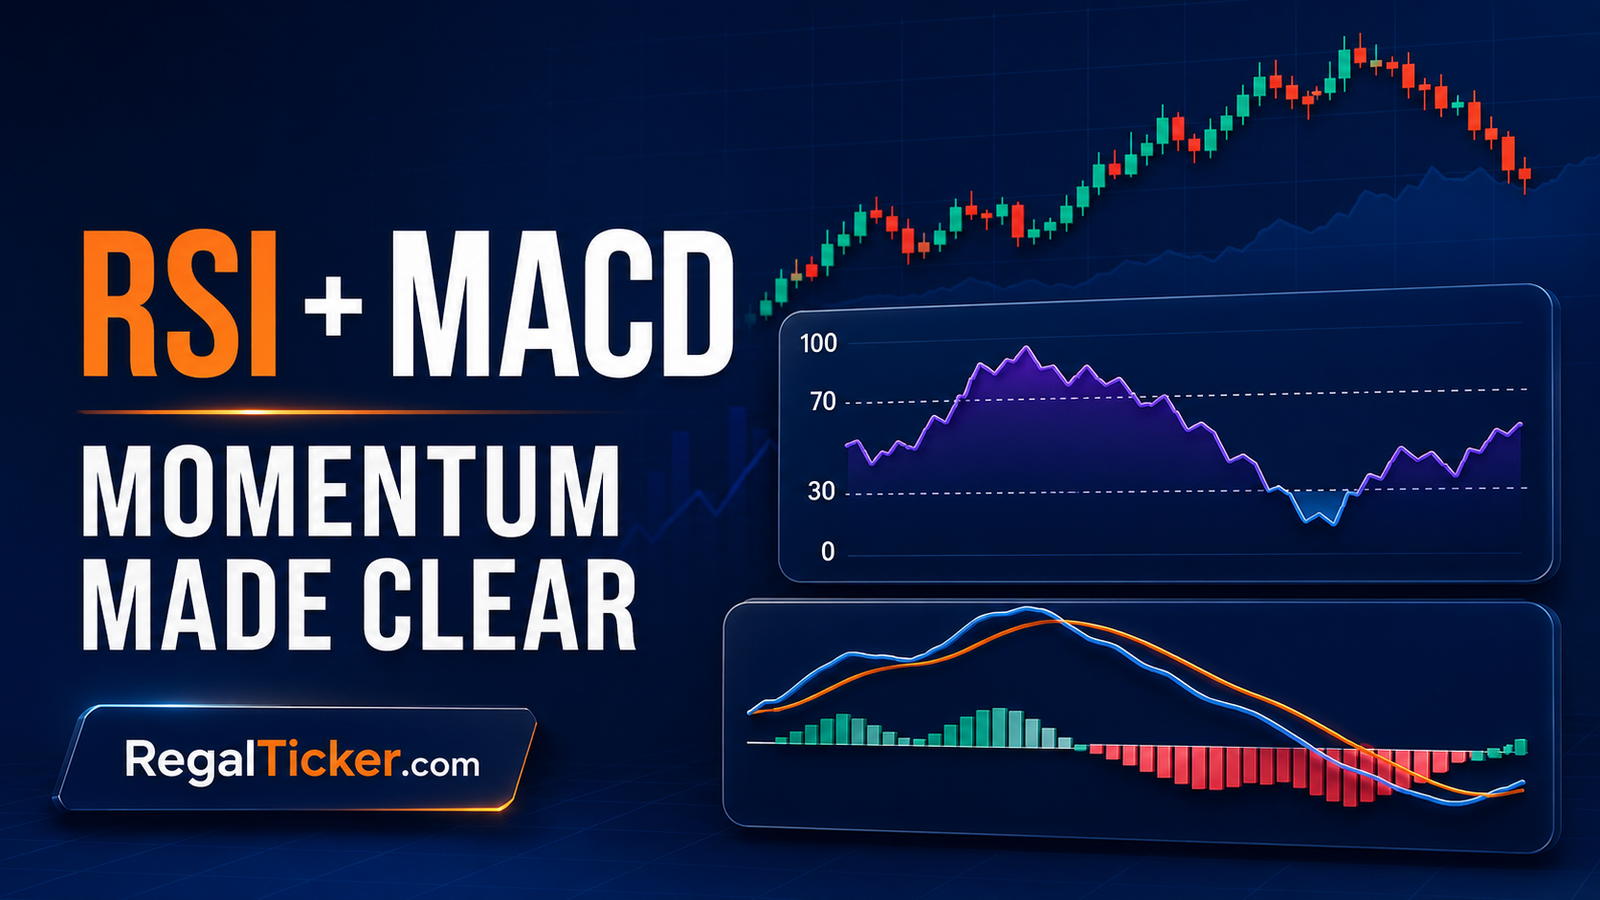
RSI and MACD in stock market analysis are momentum indicators that organise past price information in two different ways. RSI shows the strength of recent gains relative to recent losses on a scale from 0 to 100. MACD compares two exponential moving averages and then tracks whether the gap between them is widening or narrowing.
Both can help you study whether momentum supports a trend, weakens during a pullback or disagrees with price. Neither can predict the next candle. An RSI reading below 30 is not automatically a reason to buy, an RSI above 70 is not automatically a reason to sell, and a MACD crossover does not guarantee that a new trend has begun.
The safest learning order is price first, indicator second. Before this lesson, understand What Is Technical Analysis? Meaning, Tools and Examples, How to Read Candlestick Charts: A Beginner’s Guide and Trend Analysis: Uptrend, Downtrend and Sideways Market. RSI and MACD should confirm an observable price idea—not manufacture one.
What Are RSI and MACD in Stock Market Analysis?
Momentum describes the speed and persistence of price movement. A share may continue rising while its upward momentum accelerates, remains stable or slows. That distinction is important because price direction and momentum direction are related but not identical.
SEBI lists the Relative Strength Index among popular technical indicators and describes readings above 70 and below 30 as overbought and oversold reference conditions: SEBI Investor — Technical vs Fundamental Analysis. NSE educational material identifies RSI and Moving Average Convergence Divergence as common momentum indicators: NSE — Technical Analysis and Chart Patterns for Capital Markets.
These official learning references describe the indicators; they do not turn a reading into a guaranteed trade.
RSI and MACD Answer Different Questions
RSI asks:
- How large have recent gains been compared with recent losses?
- Is momentum positioned near the upper, middle or lower part of its recent range?
- Is price making a new extreme while momentum fails to confirm it?
MACD asks:
- Is a faster EMA above or below a slower EMA?
- Is the distance between those averages expanding or contracting?
- Is the MACD line above or below its signal line and zero line?
Because the calculations differ, the indicators can disagree. That disagreement is information—not an error that must be forced into a bullish or bearish conclusion.
RSI vs MACD at a Glance
| Feature | RSI | MACD |
|---|---|---|
| Full name | Relative Strength Index | Moving Average Convergence Divergence |
| Indicator type | Bounded momentum oscillator | Trend-following momentum oscillator |
| Standard display | One line between 0 and 100 | MACD line, signal line and histogram |
| Common default | 14 periods | 12, 26 and 9 periods |
| Main reference levels | 70, 50 and 30 | Signal line and zero line |
| Common use | Momentum condition, range shifts and divergence | Trend-momentum direction, crossovers and expansion/contraction |
| Main weakness | Can remain overbought or oversold during a strong trend | Can lag and repeatedly cross in a sideways market |
| Standalone buy/sell instruction? | No | No |
RSI does not compare your stock with another stock, despite the words “relative strength” in its name. It compares the magnitude of that security’s own recent gains and losses. MACD does not measure business value. Both are derived from price.
Why Price Must Remain Primary
An indicator compresses information. Compression makes a chart easier to scan, but it also removes detail.
Price tells you:
- where buyers and sellers actually transacted;
- whether swing highs and lows are rising or falling;
- whether support or resistance has held or failed;
- whether a candle closed beyond a level;
- where a technical idea becomes invalid.
RSI and MACD translate some of that history into calculated lines. If price breaks important support while an indicator still looks constructive, the price event deserves priority. Read Support and Resistance in the Stock Market: Beginner’s Guide before treating any oscillator level as a replacement for a chart level.
How the RSI Indicator Works
RSI is a bounded oscillator developed to compare average gains with average losses over a selected lookback. The common default is 14 periods, but “period” inherits the chart interval. On a daily chart, 14 periods means 14 daily bars; on a one-hour chart, it means 14 one-hour bars.
RSI Formula
The core calculation is:
Relative Strength (RS) = Average Gain ÷ Average Loss
RSI = 100 − [100 ÷ (1 + RS)]
The first average gain and average loss can be calculated from the selected lookback. Subsequent values commonly use Wilder-style smoothing, so the newest change enters gradually rather than replacing the whole history at once.
A simplified five-period illustration makes the logic clear. Assume five price changes:
| Period | Price change | Gain used | Loss used |
|---|---|---|---|
| 1 | +₹2 | ₹2 | ₹0 |
| 2 | −₹1 | ₹0 | ₹1 |
| 3 | +₹3 | ₹3 | ₹0 |
| 4 | −₹2 | ₹0 | ₹2 |
| 5 | +₹4 | ₹4 | ₹0 |
Average gain:
(₹2 + ₹0 + ₹3 + ₹0 + ₹4) ÷ 5 = ₹1.80
Average loss:
(₹0 + ₹1 + ₹0 + ₹2 + ₹0) ÷ 5 = ₹0.60
Relative Strength:
₹1.80 ÷ ₹0.60 = 3
RSI:
100 − [100 ÷ (1 + 3)] = 75
This result says recent gains were much larger than recent losses in the sample. It does not say the share is fundamentally expensive, nor does it prove that price must reverse.
If the average loss is zero, RSI approaches 100. If the average gain is zero, RSI approaches 0. Your platform performs the rolling calculation automatically, but understanding the formula prevents you from treating the line as magic.
How to Read 70, 50 and 30
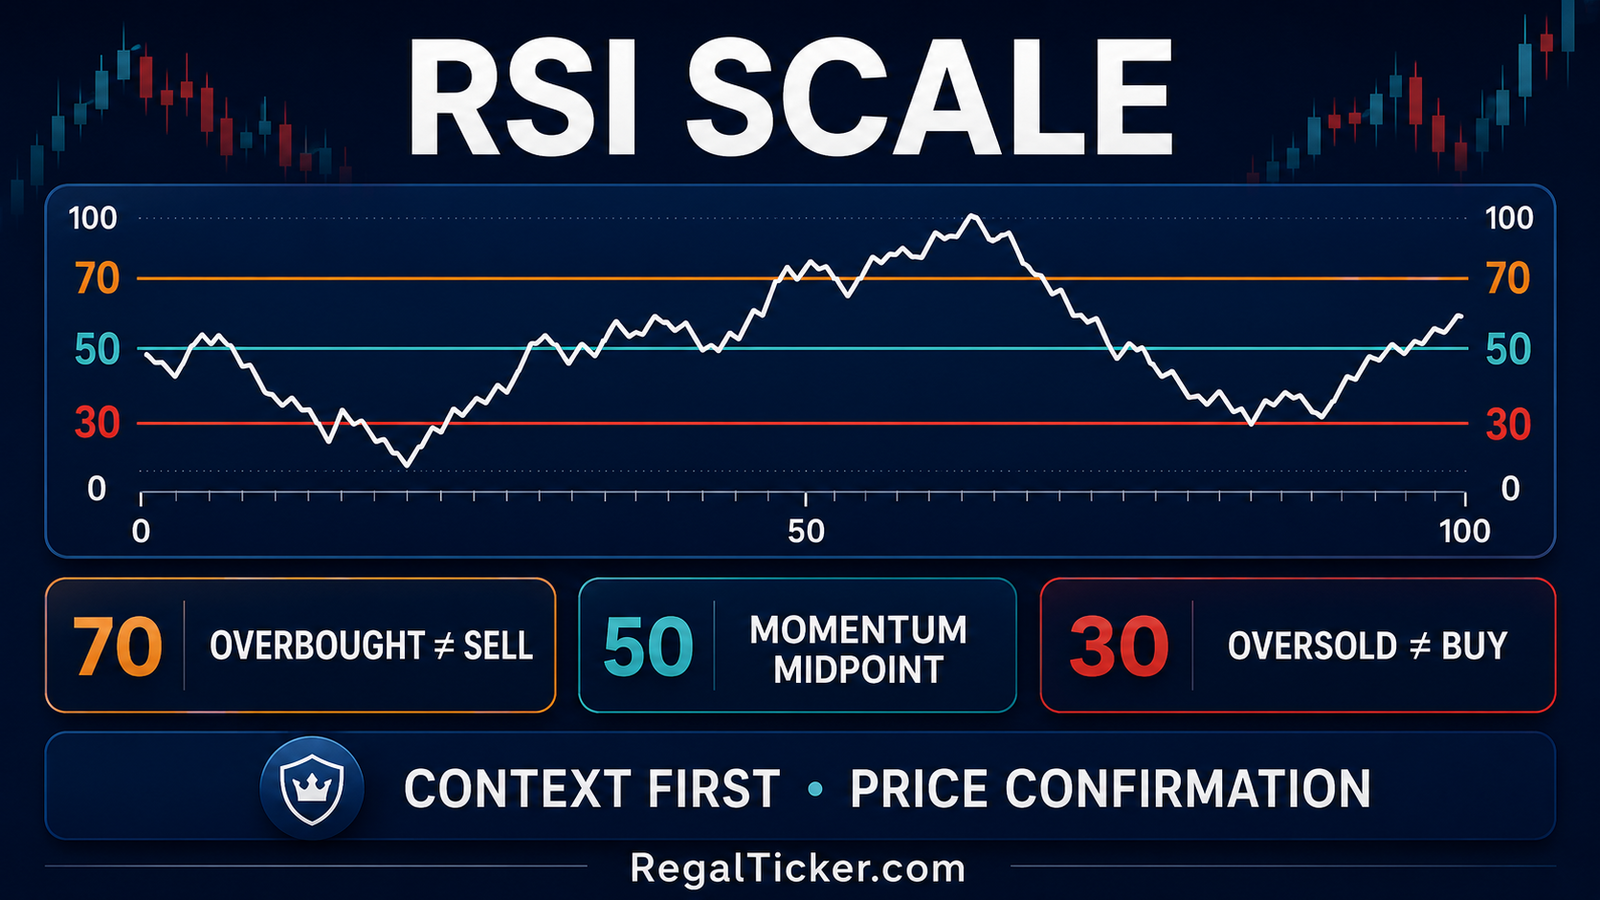
The familiar RSI reference levels are:
- Above 70: commonly labelled overbought.
- Around 50: gains and losses have greater balance; often used as a momentum midpoint.
- Below 30: commonly labelled oversold.
“Overbought” means buying momentum has been strong relative to the lookback. It does not mean the company’s shares are overvalued. Valuation requires earnings, cash flow, assets, debt and price comparisons—the work covered in What Is Fundamental Analysis?.
Similarly, “oversold” does not mean a stock is cheap or safe. A company facing a serious adverse event can remain below 30 while price continues falling.
RSI Range Behaviour Matters
RSI can behave differently across market conditions:
- In a strong uptrend, it may repeatedly reach 70 and spend more time above 50.
- In a strong downtrend, it may struggle near the middle and repeatedly approach 30.
- In a range, movements between lower and upper zones may align more closely with support and resistance.
Therefore, an RSI reading of 72 during a healthy breakout is different from 72 after an exhausted rally directly into major resistance. The number is the same; the context is not.
RSI Momentum Signals Worth Studying
Beginners can study four categories without turning them into automatic trades:
- Level: Is RSI above 70, near 50 or below 30?
- Direction: Is RSI rising, falling or flat?
- Range shift: Does RSI repeatedly hold above or below the middle area?
- Divergence: Does momentum fail to confirm a new price high or low?
The direction of RSI often matters more than a single static number. For example, RSI recovering from 35 to 48 while price holds support may show improving momentum. It still needs price confirmation.
How the MACD Indicator Works
MACD uses exponential moving averages, so Lesson 7’s guide to Moving Averages in Stock Market: SMA, EMA and Crossovers is the necessary foundation.
The conventional MACD settings are 12, 26 and 9:
- 12-period EMA: faster average.
- 26-period EMA: slower average.
- 9-period EMA: signal line calculated from the MACD line.
These are conventions, not laws.
MACD Line, Signal Line and Histogram
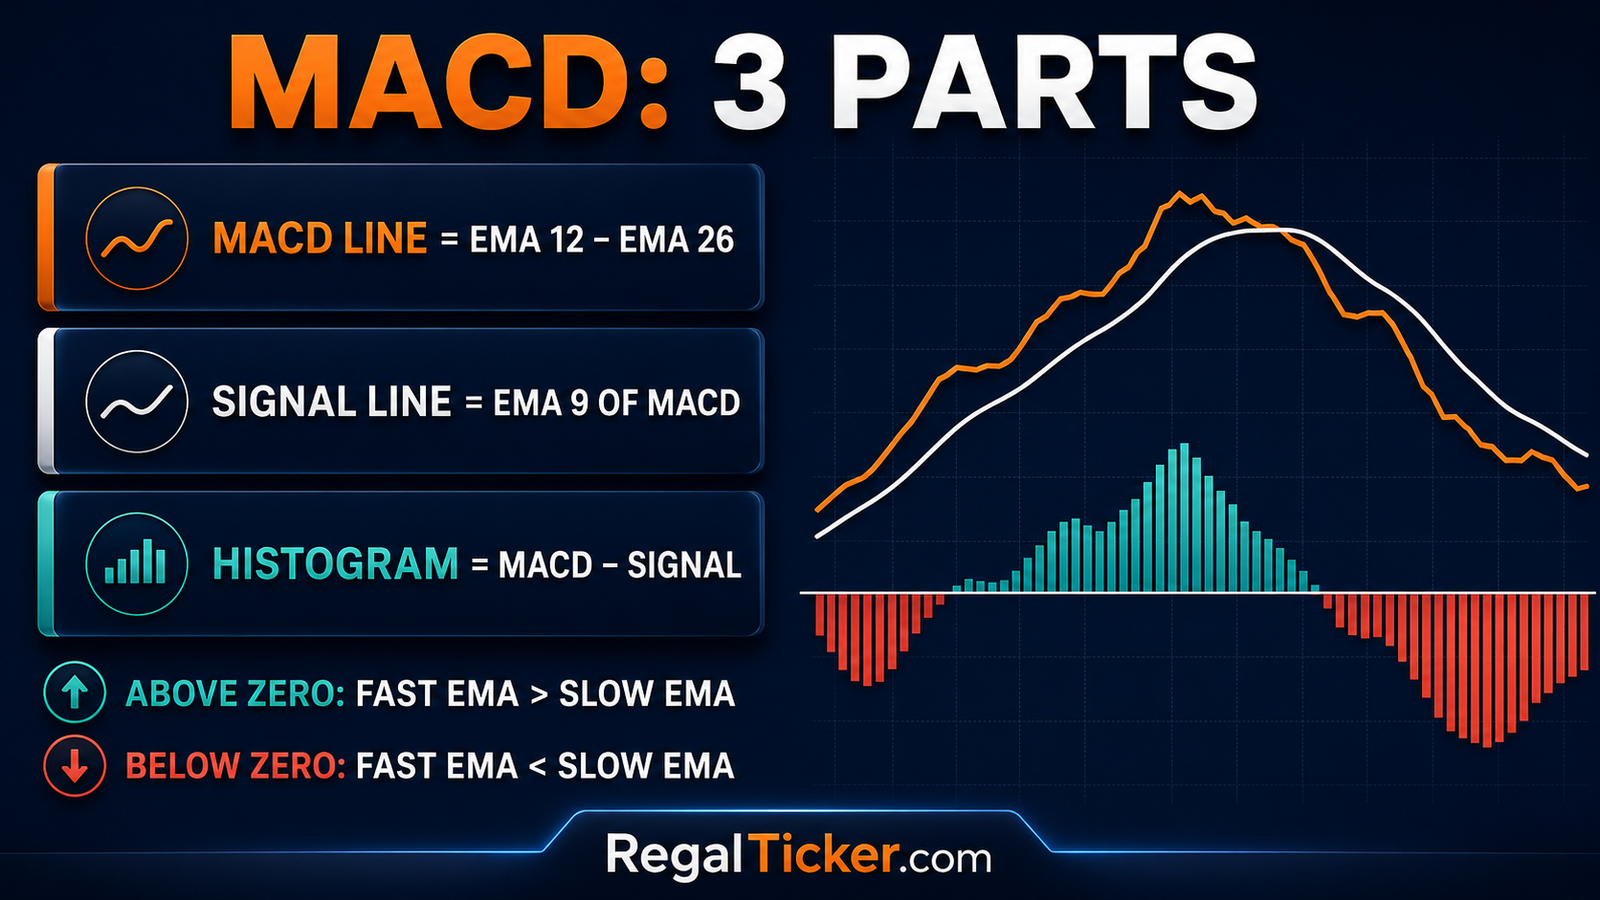
The three visible components are calculated as:
MACD Line = 12-period EMA − 26-period EMA
Signal Line = 9-period EMA of the MACD Line
Histogram = MACD Line − Signal Line
Suppose:
- 12-period EMA = ₹510
- 26-period EMA = ₹502
- MACD line = ₹8
- signal line = ₹6
The histogram equals:
₹8 − ₹6 = ₹2
The positive MACD line means the faster EMA is above the slower EMA. The positive histogram means the MACD line is above its signal line. It does not by itself tell you whether the price is near resistance, whether volume supports the move or whether the potential reward justifies the risk.
What the Zero Line Means
The MACD line crosses zero when the fast and slow EMAs become equal:
- MACD above zero: fast EMA is above slow EMA.
- MACD below zero: fast EMA is below slow EMA.
- MACD near zero: the two averages are close.
A bullish signal-line crossover below zero may indicate early improvement while the broader EMA relationship is still negative. The same crossover above zero occurs within an already positive relationship. The crossover direction may match, but the trend context differs.
What the Signal-Line Crossover Means
When the MACD line crosses above the signal line, recent MACD values are improving relative to their own smoothed average. When it crosses below, they are weakening.
Crossovers can be useful alerts, but they inherit two sources of lag:
- The MACD line is built from EMAs of past prices.
- The signal line is another EMA of the MACD line.
In a sideways market, small price changes can cause repeated crossovers with little follow-through. This is why a crossover near an important price level, supported by candle close and volume, is more meaningful than a crossover floating in the middle of a noisy range.
How to Read the Histogram
The histogram shows the distance between the MACD and signal lines:
- Bars above zero: MACD line is above the signal line.
- Bars below zero: MACD line is below the signal line.
- Bars growing away from zero: the distance is expanding.
- Bars shrinking toward zero: the distance is contracting.
A shrinking positive histogram does not automatically mean price is falling. It means positive MACD momentum is decelerating relative to the signal line. Price can still rise more slowly. The exact same distinction applies to a shrinking negative histogram.
MACD is not bounded. A value of +10 is not universally stronger than +2 because the scale depends on the security’s price and volatility. Compare MACD behaviour within the same instrument and timeframe rather than ranking unrelated shares by raw MACD value.
How to Read RSI and MACD Signals
RSI and MACD signals fall into three broad groups: momentum level, crossover and divergence. Each is a clue. None should be isolated from price structure.
Momentum Confirmation
Momentum confirms price when both move in a compatible direction. Examples include:
- price forms higher highs and RSI also makes higher highs;
- price remains above support while RSI holds above its midpoint;
- price advances as MACD stays above its signal line and histogram expands;
- price breaks resistance while RSI strengthens and MACD improves.
Confirmation does not eliminate risk. It simply means the calculation is not contradicting the observed price move at that moment.
Use Trading Volume in Stock Market: Meaning, Signals and Examples to add participation context. Price, momentum and volume measure different things; using all three is more informative than stacking several versions of the same calculation.
Bullish and Bearish Divergence
Regular divergence occurs when price makes a new extreme but an indicator does not confirm it.
Bullish divergence:
- price forms a lower low;
- RSI or MACD forms a higher low;
- downside momentum has weakened relative to the earlier low.
Bearish divergence:
- price forms a higher high;
- RSI or MACD forms a lower high;
- upside momentum has weakened relative to the earlier high.
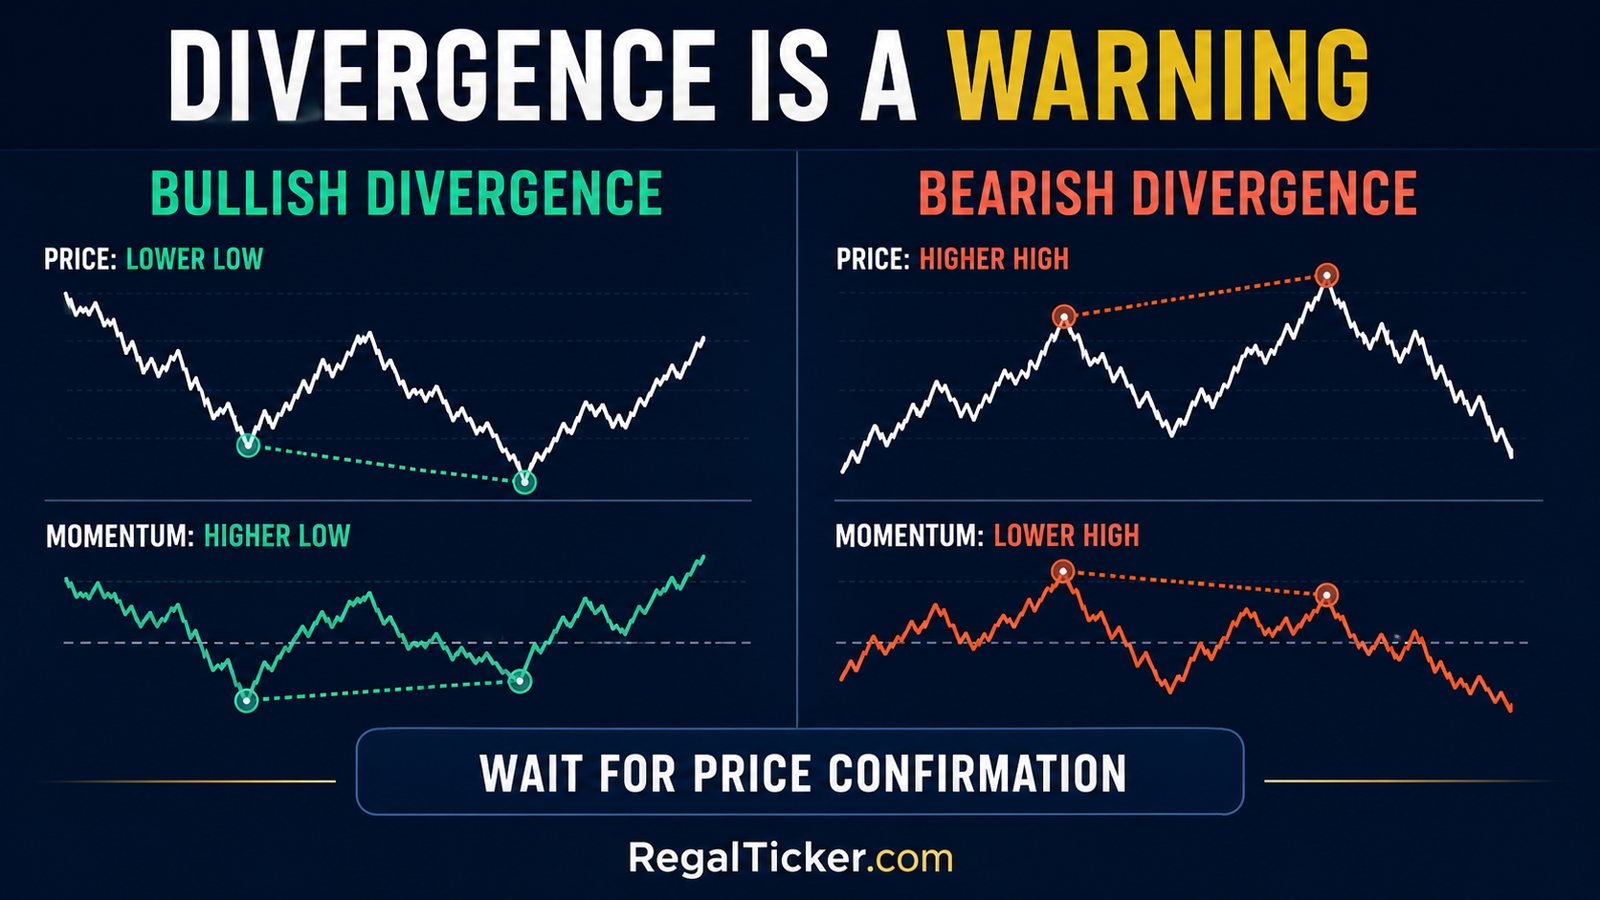
Divergence is frequently misunderstood. Weaker momentum does not guarantee immediate reversal. Price can continue in the original direction, create more than one divergence and stop you out before eventually turning.
A divergence becomes more useful when:
- it forms at a clearly defined support or resistance area;
- price confirms with a failed breakdown, failed breakout or swing-structure change;
- the comparison uses matching, significant swing points;
- the signal appears on a timeframe relevant to the decision;
- volume and candle behaviour add independent evidence.
Avoid drawing indicator lines between minor points merely to create the divergence you want to see.
RSI and MACD Can Disagree
Suppose RSI is above 70 while MACD remains above its signal and zero lines. RSI reports strong recent gains relative to losses; MACD reports a positive fast-versus-slow EMA relationship. There is no mathematical contradiction.
The correct conclusion is not “one indicator is wrong.” Instead ask:
- Is price trending or ranging?
- Is the share at resistance or in open price territory?
- Is volume expanding or fading?
- Is the latest candle closed?
- Where does the price structure invalidate the idea?
| RSI condition | MACD condition | Possible interpretation | Responsible response |
|---|---|---|---|
| Rising above 50 | Above signal and zero | Momentum supports an existing uptrend | Check price structure, level, volume and risk |
| Above 70 | Still strengthening | Strong momentum may persist | Do not sell only because RSI is overbought |
| Falling below 50 | Below signal and zero | Momentum supports an existing downtrend | Avoid assuming the move is already exhausted |
| Below 30 | Still weakening | Selling momentum may remain strong | Do not buy only because RSI is oversold |
| Improving | MACD still below signal | Early recovery without full confirmation | Wait for price evidence or accept that signals disagree |
| Weakening | MACD still above signal | Uptrend may be losing speed | Treat as an alert, not an automatic reversal |
Wait for the Candle to Close
Indicator values change while the current bar is forming. An intraday RSI may move above and back below 50 before the bar closes; MACD lines can appear to cross and then separate.
If your rule is based on closing values, evaluate it after the candle closes. Otherwise, you are testing one rule historically and executing another in real time.
How to Use RSI and MACD Together Responsibly
Combining indicators should produce a clearer decision process, not a decorative dashboard. RSI and MACD both use price, so agreement between them is not the same as confirmation from an independent data source.
A Price-First Six-Step Framework
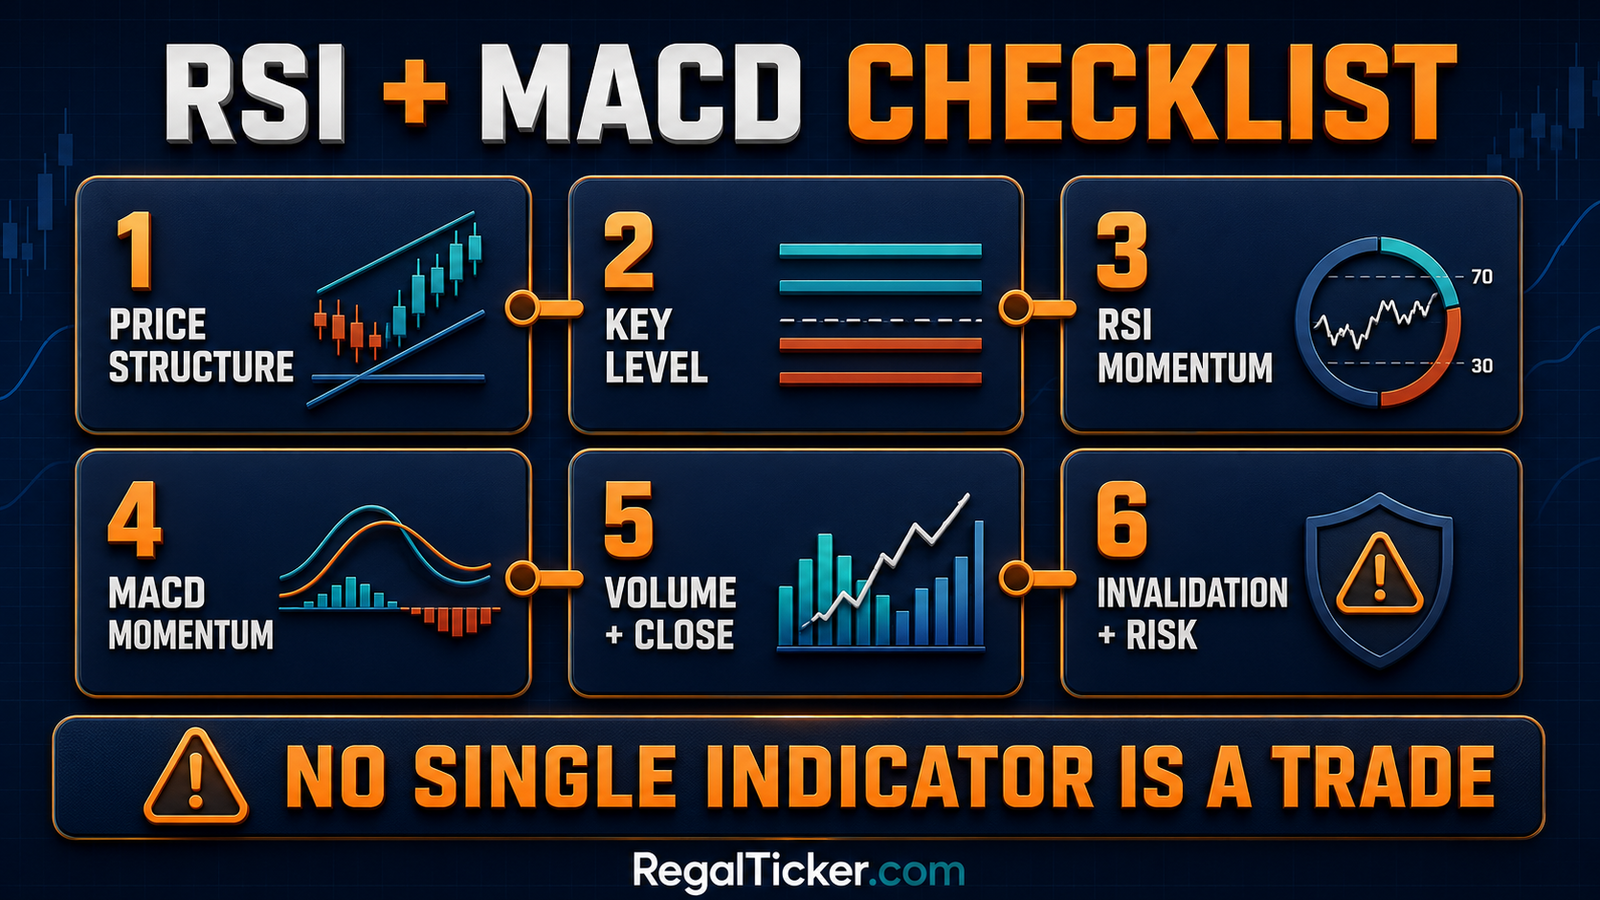
Use this order:
- Define the timeframe. Decide whether you are studying a weekly, daily, hourly or other chart.
- Identify price structure. Mark the trend, meaningful swing points, support and resistance.
- Read RSI. Note its level, direction, range behaviour and any genuine divergence.
- Read MACD. Check the signal line, zero line and histogram behaviour.
- Seek independent confirmation. Review volume, candle close, liquidity and the broader market.
- Define risk. Record invalidation, position size and maximum acceptable loss before entry.
This framework prevents the common mistake of noticing a crossover first and searching the chart afterward for a story that supports it.
Example: Pullback Within an Uptrend
Imagine a daily chart with:
- a clear sequence of higher highs and higher lows;
- price pulling back toward established support;
- RSI falling from 68 to 44, then turning upward;
- MACD histogram becoming less negative;
- MACD line crossing above the signal line;
- volume contracting during the pullback and improving on recovery.
This is a coherent study: price structure remains positive, RSI shows momentum recovering after cooling, MACD shows improving fast-versus-slow momentum, and volume adds participation context.
It is still not certainty. A close below the swing low or support could invalidate the setup. A gap caused by news could bypass a planned exit. The purpose of confirmation is to organise probability and risk—not to promise an outcome.
Example: RSI Oversold During a Breakdown
Now imagine:
- price closes below major support;
- RSI reads 27;
- MACD remains below its signal and zero lines;
- selling volume expands;
- no bullish reversal candle or reclaimed level appears.
Buying only because RSI is below 30 would mean acting against the price break, MACD direction and volume evidence. The oversold reading describes intense recent selling; it does not prove that selling has ended.
When Both Indicators Add Little
RSI and MACD may add little value when:
- the security is illiquid and prices jump between sparse trades;
- the chart is extremely choppy;
- a corporate announcement creates a sudden gap;
- the selected lookback has too little data;
- the trader keeps changing settings after every loss;
- both indicators merely repeat an already obvious price move.
Sometimes the best conclusion is “no clear setup.” Technical analysis does not require a position.
Settings, Timeframes and Testing
Default settings are a starting point for learning. They are not proof of the best settings for every stock, timeframe or market condition.
Common Default Settings
| Indicator | Common default | What it controls | Faster alternative trade-off |
|---|---|---|---|
| RSI | 14 periods, 70/30 levels | Lookback for average gains and losses | Responds sooner but becomes noisier |
| MACD fast EMA | 12 periods | Faster price average | More sensitive to recent changes |
| MACD slow EMA | 26 periods | Slower comparison average | Reducing it narrows the comparison |
| MACD signal | 9 periods | Smoothing of the MACD line | Faster crossovers and more whipsaw |
Do not call these “14 days” or “12-26-9 days” unless you are using a daily chart. On a weekly chart they are weeks; on a 15-minute chart they are 15-minute bars.
NSE’s Technical Analysis Module outline explicitly includes RSI applications, overbought/oversold conditions, divergence, real-life problems in using RSI, MACD calculation and multiple-indicator signals: NSE Technical Analysis Module. The inclusion of “real-life problems” is a useful reminder that knowing a formula is not the same as validating a method.
Align the Timeframe With the Decision
A signal is meaningful only in relation to its chart:
- Weekly RSI describes weekly momentum.
- Daily MACD describes daily EMA relationships.
- Fifteen-minute indicators describe intraday bars.
You can use a higher timeframe for context and a lower timeframe for execution, but write the hierarchy in advance. If the weekly trend is up and the daily chart pulls back, a trader may study daily momentum recovery. Switching randomly between timeframes until one gives the desired signal is cherry-picking.
Use Consistent, Adjusted Data
Corporate actions and poor data can distort indicators. A stock split or bonus issue may create an artificial historical price gap when the series is not adjusted. That false gap can alter RSI gains/losses and MACD EMAs.
Check:
- the exact security and exchange;
- adjusted versus unadjusted price history;
- the selected interval;
- sufficient warm-up data for EMA calculations;
- whether the latest candle is complete;
- liquidity and missing sessions.
NSE provides security-wise historical price and volume information through its Equity Security-wise Archives. Use one consistent data source when testing.
Backtest a Rule, Not a Picture
A valid test needs precise rules. “RSI looked strong and MACD looked good” cannot be reproduced.
Define:
- RSI condition: for example, close-of-bar cross above 50;
- MACD condition: line above signal, above zero, or histogram expansion;
- price condition: trend structure, breakout or support hold;
- entry timing: same close, next open or another rule;
- invalidation and exit;
- brokerage, taxes, slippage and gaps;
- position-sizing method;
- sample period and instruments.
Separate the data used to design the rule from data used to evaluate it. A setting chosen because it perfectly fits one historical chart may fail outside that sample. Avoid look-ahead bias, survivorship bias and changing definitions after seeing results.
Common Mistakes and Risk Controls
Most damage comes not from the formula but from the way a trader interprets and sizes a signal.
Mistake 1: Treating Overbought as “Must Fall”
RSI can remain above 70 during a strong uptrend. Selling or shorting solely because of that number ignores trend persistence. Look for price failure, resistance reaction, divergence or structure change.
Mistake 2: Treating Oversold as “Must Rise”
A falling stock can remain below 30. Oversold describes momentum relative to the lookback; it does not create a floor. Wait for price to stop making lower lows or reclaim a meaningful level if your method requires confirmation.
Mistake 3: Taking Every MACD Crossover
Sideways prices pull the fast and slow EMAs back and forth. MACD may cross its signal line repeatedly. Filter crossovers through trend, price level, candle close and volume.
Mistake 4: Counting RSI and MACD as Independent Proof
Both indicators are calculated from price. Combining them may improve organisation, but it does not produce two independent datasets. Volume, business information and market context answer different questions.
Mistake 5: Ignoring the Difference Between Momentum and Valuation
An overbought company can still be fundamentally undervalued, and an oversold company can still be financially weak. Technical momentum and fundamental value are separate dimensions.
Mistake 6: Letting Indicators Set the Entire Risk Plan
An indicator can support an entry, but price should define where the technical idea fails. A stop placed only because RSI moved below 50 may have no relationship to swing structure or volatility.
Before taking risk:
- identify the invalidation price;
- calculate the loss per share;
- size the position from a pre-defined risk limit;
- consider gaps and slippage;
- avoid using money required for near-term needs;
- record the plan before the trade.
The Bid Price, Ask Price, Spread and Order Book lesson explains why the displayed chart price may not equal your actual execution price. A technically attractive setup can still be poor when liquidity is weak and the spread is wide.
Complete RSI and MACD Checklist
Use the checklist to slow down the decision. “Yes” does not mean buy, and “No” does not mean sell. The purpose is to reveal missing evidence.
| Category | Question to record |
|---|---|
| Security | Is this the correct, sufficiently liquid security? |
| Timeframe | Does the chart interval match the intended holding period? |
| Price structure | Is price trending, ranging or transitioning? |
| Location | Is price at support, resistance, a breakout level or nowhere meaningful? |
| RSI | What are its level, direction, midpoint behaviour and divergence status? |
| MACD | Where are the MACD line, signal line, zero line and histogram? |
| Confirmation | Does the candle close and volume support the price idea? |
| Conflict | Do RSI and MACD disagree, and can the disagreement be explained? |
| Invalidation | Which price event proves the setup wrong? |
| Risk | Are position size, maximum loss, gaps, spread and costs acceptable? |
| Data | Are prices adjusted, sufficient and from a consistent source? |
| Record | Can another person reproduce the rule from the written plan? |
Key Takeaways
- RSI compares recent average gains with recent average losses and is bounded from 0 to 100.
- MACD compares a fast EMA with a slow EMA, then uses a signal line and histogram.
- RSI 70 and 30 are context-dependent reference levels—not mandatory reversal points.
- MACD crossovers can lag and whipsaw in sideways markets.
- Divergence is a warning that momentum is not confirming price; it is not a reversal guarantee.
- RSI and MACD may disagree because they measure momentum differently.
- Price structure, level, candle close, volume, liquidity and risk should remain primary.
- Default settings are starting points. Any rule must be tested with realistic costs and unseen data.
Technical indicators are decision aids, not decision makers. Use them to ask better questions and define repeatable observations. Do not use them to remove uncertainty that cannot be removed.
Frequently Asked Questions
Which Is Better: RSI or MACD?
Neither is universally better. RSI is bounded and is useful for studying the balance of recent gains and losses, momentum ranges and divergence. MACD is useful for studying the relationship between faster and slower EMAs, signal-line crossovers and momentum expansion or contraction. The better indicator is the one that answers a clearly defined question and has been tested in the relevant market condition.
Can RSI and MACD Give a Buy Signal?
They can produce conditions that traders label bullish, such as RSI recovering above a reference level and MACD crossing above its signal line. Those conditions are not instructions or guarantees. Confirm the price structure, level, volume, liquidity, invalidation and risk before making any decision.
Is RSI Above 70 Always a Sell Signal?
No. RSI can remain above 70 during a persistent uptrend. Above 70 means recent gains have been strong relative to recent losses. A reversal requires price evidence; the RSI number alone does not create it.
Is RSI Below 30 Always a Buying Opportunity?
No. A stock can remain oversold while price continues falling, particularly after a breakdown or adverse event. Oversold is a momentum condition, not a valuation conclusion.
What Does MACD Above Zero Mean?
It means the fast EMA used in the calculation is above the slow EMA. With conventional settings, the 12-period EMA is above the 26-period EMA. It does not prove that price will continue rising.
What Are the Best RSI and MACD Settings?
There is no universal best setting. The common defaults are RSI 14 and MACD 12-26-9. Settings must match the chart timeframe, instrument and rule. Faster settings respond sooner but usually increase noise; slower settings smooth more but respond later.
Is RSI or MACD Divergence Reliable?
Divergence can alert you that momentum is failing to confirm a new price extreme. It can also appear early, repeat or fail. Use significant matching swing points and wait for price confirmation if your method requires it.
Can Beginners Use RSI and MACD for Intraday Trading?
Beginners can study them on any timeframe, but shorter charts contain more noise and create more signals. Intraday execution also magnifies the importance of spread, slippage, brokerage, taxes and discipline. Practise with historical charts and written rules before risking money.
Should Long-Term Investors Use RSI and MACD?
They may use weekly or daily indicators for price context, but long-term investment decisions should not ignore revenue, profit, cash flow, debt, competitive position, management quality and valuation. Technical analysis can complement research; it cannot replace company analysis.
Educational note: This article is for investor education. It is not investment advice, a trading recommendation or a promise of returns. Securities-market investments and trading involve risk, including possible loss of capital.