How to analyse a stock technically is not a question of finding the perfect indicator. It is a process of turning price, volume and market behaviour into a structured decision. A good process begins with context, maps the trend and important levels, waits for evidence, defines where the idea would be wrong and measures the risk before any action is considered.
Beginners often reverse that order. They open a chart, add several indicators and look for a green signal. If the chart does not support the desired conclusion, they change the timeframe, indicator settings or trendline until it does. That is not disciplined analysis; it is confirmation bias expressed through a chart.
A repeatable workflow asks the same questions in the same sequence:
- What is the intended holding period?
- What are the market and sector doing?
- Is the stock trending, ranging or changing structure?
- Where are the important support and resistance zones?
- What setup is actually present?
- Does volume support the price move?
- Do selected indicators add independent evidence?
- What event would confirm the setup?
- What price behaviour would invalidate it?
- Is the planned risk acceptable relative to the opportunity?
This lesson brings together the first nine Technical Analysis lessons into one practical framework. It is designed for education, chart review and process building—not as a recommendation to buy, sell or trade any security.
What a Complete Technical Analysis Process Can and Cannot Do
Technical analysis studies observable market behaviour. Price records where transactions occurred. Volume records how much activity accompanied those transactions. Candlesticks compress the open, high, low and close into a readable form. Trends, levels, patterns and indicators help organise that information.
SEBI’s explanation of technical and fundamental analysis distinguishes price movements, trends and trading volumes from the financial health, business model and economic factors studied in fundamental analysis. That distinction matters. A chart can help assess timing, structure and market behaviour; it cannot tell you whether a company’s governance is sound, accounts are reliable or long-term valuation is reasonable.
Technical Analysis Is a Probability Framework
No chart pattern, indicator crossover or breakout can guarantee the next price move. A setup may have several confirming factors and still fail because:
- new information enters the market;
- the broader index reverses;
- an earnings or regulatory event creates a gap;
- liquidity disappears;
- the apparent pattern was ordinary noise;
- the chosen timeframe did not match the intended trade;
- the invalidation point was poorly defined;
- transaction costs changed the practical result.
The goal is not certainty. The goal is a consistent way to distinguish a clearly defined idea from an impulsive opinion.
Analysis and Execution Are Different Decisions
A chart can look constructive while the available execution is unattractive. Price may gap far beyond the setup, the spread may be wide, or the invalidation distance may require more risk than the plan allows. In that situation, “good analysis” can correctly lead to no action.
Conversely, an order should never create the analysis after the fact. If the reason, timeframe, trigger and invalidation are written only after entering, the process cannot be evaluated honestly.
Technical and Fundamental Views Can Coexist
Technical analysis and fundamental analysis answer different questions:
| Question | Technical lens | Fundamental lens |
|---|---|---|
| What is the market doing now? | Trend, structure, volume and momentum | Usually not the primary purpose |
| Where is price reacting? | Support, resistance, gaps and pattern boundaries | Valuation ranges may provide context |
| Is participation expanding? | Volume and liquidity | Ownership and business developments may explain why |
| Is the company financially strong? | Cannot determine reliably | Statements, cash flow, debt, returns and management |
| When is a chart idea invalidated? | Price structure and predefined conditions | Change in thesis, results or valuation assumptions |
| Does either method guarantee returns? | No | No |
An investor can use fundamental analysis to decide what deserves deeper attention and technical analysis to study price behaviour. A short-term trader may rely more heavily on charts but still needs to know when corporate events can disrupt them.
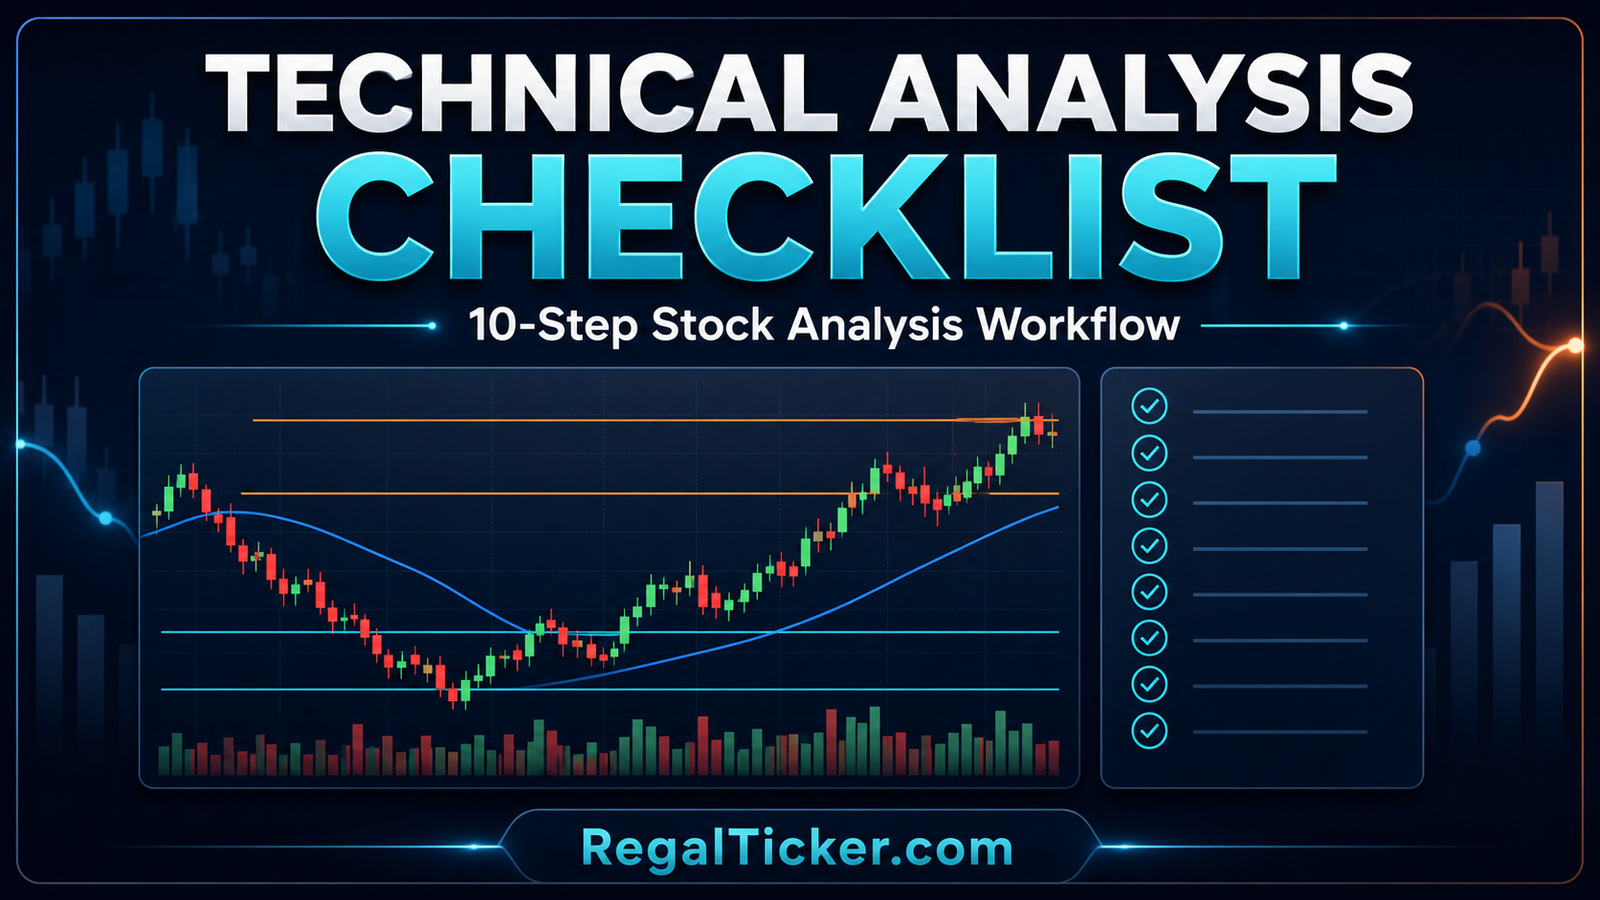
How to Analyse a Stock Technically: The 10-Step Workflow
The workflow below moves from broad context to specific risk. Skipping directly to an indicator or candle pattern removes the foundation that gives the signal meaning.
| Step | Core question | Output |
|---|---|---|
| 1. Define the horizon | How long is the idea intended to last? | Primary and supporting timeframes |
| 2. Check context | What are the index, sector and event conditions? | Supportive, neutral or conflicting backdrop |
| 3. Read the trend | Is structure rising, falling, ranging or transitioning? | Trend classification |
| 4. Mark key levels | Where have buyers and sellers repeatedly reacted? | Support, resistance and next obstacle zones |
| 5. Name the setup | What specific pattern or price behaviour is present? | One testable setup |
| 6. Evaluate participation | Does volume and liquidity support the move? | Participation assessment |
| 7. Use selective indicators | Do chosen tools confirm or contradict price? | Supporting evidence, not a verdict |
| 8. Define confirmation | What must happen before the setup is actionable? | Objective trigger |
| 9. Define invalidation | What price behaviour proves the idea wrong? | Exit or no-entry condition |
| 10. Measure risk | Is the loss acceptable and the opportunity realistic? | Position-risk decision |
This sequence is intentionally price-first. Moving averages, RSI and MACD are calculated from price. Adding all of them before reading price can create an illusion of independent confirmation even though they are different transformations of the same underlying data.
Build One Written Chart Thesis
Before studying the ten steps in detail, use one sentence to describe the current hypothesis:
> “The stock is in a daily uptrend, consolidating below a well-tested resistance zone; I will treat it only as a continuation setup if price closes above the zone with supportive participation and remains above the predefined invalidation area.”
This sentence contains context, structure, setup, trigger and invalidation. It is more useful than “RSI looks bullish.”
The thesis must remain falsifiable. If every possible price movement can be explained as bullish after it happens, the thesis was never testable.
Prepare the Chart and Its Market Context
The first two steps decide what chart should be analysed and how much weight its signals deserve.
Step 1: Define the Holding Period and Primary Timeframe
A timeframe has meaning only in relation to a decision horizon. A weekly chart can show a strong uptrend while a 15-minute chart shows a pullback. Both can be correct.
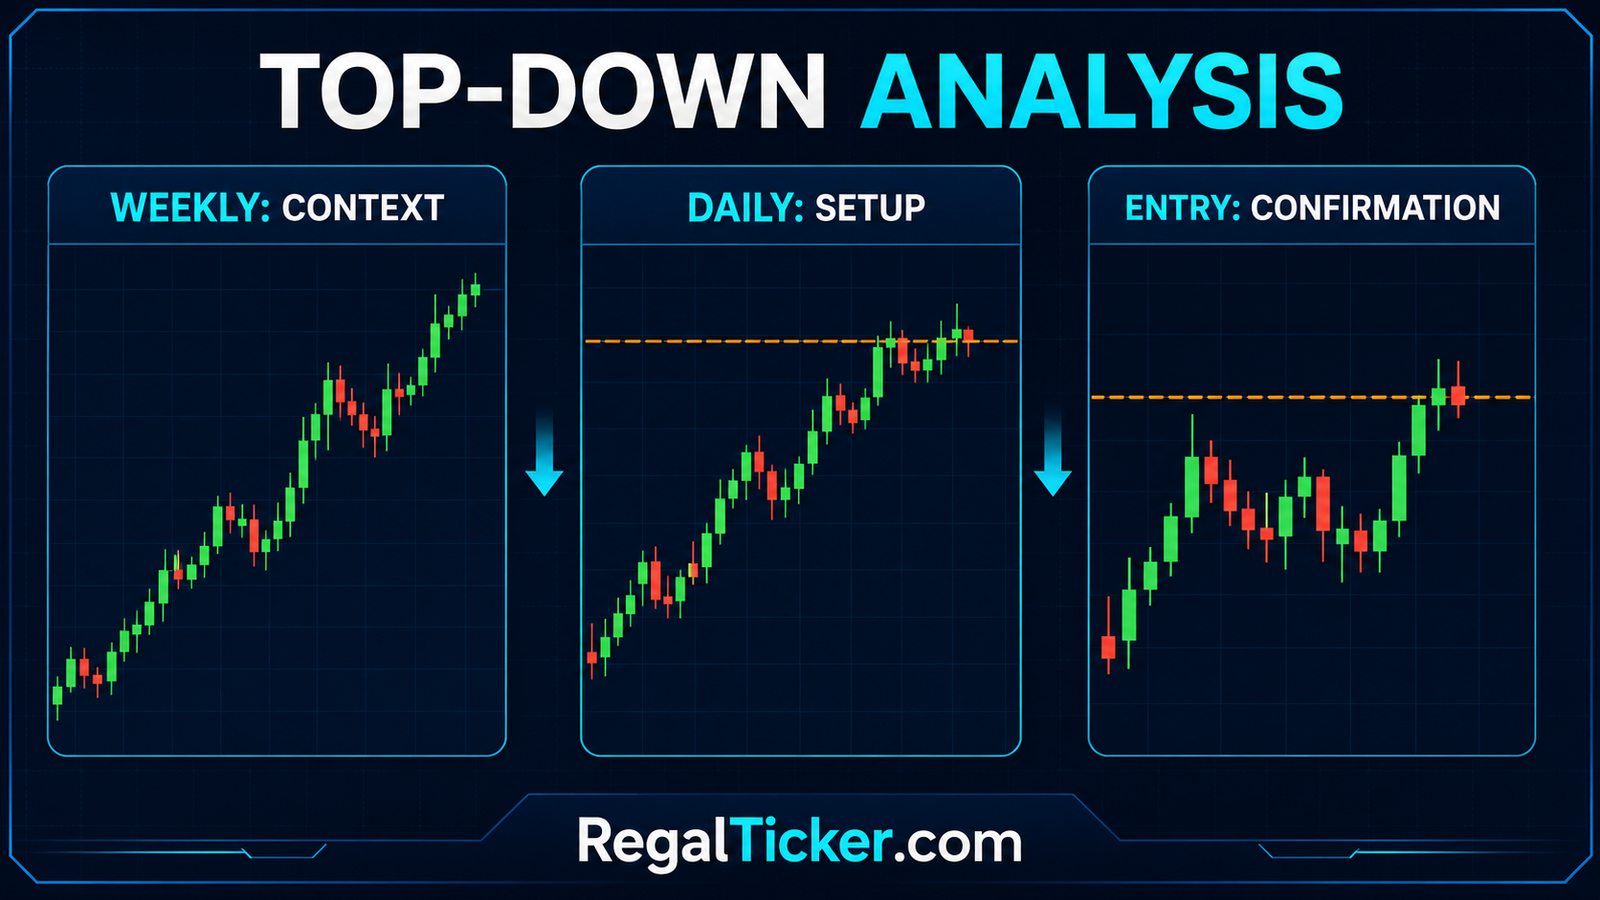
A practical three-layer structure is:
- Context timeframe: one level above the intended horizon; used to see the dominant structure.
- Working timeframe: the chart on which the setup and main levels are defined.
- Entry or monitoring timeframe: one level below; used only when more precise confirmation is necessary.
Examples:
| Intended approach | Context chart | Working chart | Entry/monitoring chart |
|---|---|---|---|
| Multi-week position | Weekly | Daily | 4-hour or daily close |
| Swing lasting several days | Daily | 4-hour or daily | 1-hour or 4-hour |
| Intraday idea | Daily or 1-hour | 15-minute | 5-minute |
These are examples, not fixed rules. The important principle is consistency. If the setup is defined on the daily chart, a single five-minute red candle should not automatically invalidate it. The invalidation should come from the timeframe that created the idea.
Frequent timeframe switching is a common source of bias. A user may begin with a daily setup, move to a five-minute chart to justify an early entry, then switch to weekly after the trade moves against them. Define the chart hierarchy before interpreting the signal.
Step 2: Check the Index, Sector, Liquidity and Event Context
A stock does not trade in isolation. Compare it with:
- a broad market benchmark such as the Nifty 50;
- its relevant sector or industry index;
- closely related peers when appropriate;
- its own recent volume and trading activity;
- upcoming results, corporate actions or known regulatory events.
The market context can be:
- supportive: stock, sector and broader market structures generally align;
- mixed: the stock setup is clear but the sector or index is neutral;
- conflicting: the stock signal opposes a strong sector or market move.
Conflict does not make the stock setup impossible. It tells you that the burden of confirmation may be higher.
Liquidity must also be checked before trusting a clean-looking chart. A thinly traded share can print sudden gaps, wide spreads and isolated candles that resemble textbook patterns but are difficult to execute. SEBI’s overview of securities-market risks identifies liquidity and volatility among the risks investors should understand.
For event risk, ask:
- Are financial results due during the expected holding period?
- Is a dividend, split, bonus, rights issue or other corporate action near?
- Has the exchange issued a surveillance, suspension or other notice?
- Could a known event cause a gap through the planned invalidation?
A chart setup does not cancel event risk.
Keep the Chart Clean
Begin with price and volume. Add only the indicators required by the defined method. A useful starter layout might contain:
- candlesticks;
- volume;
- one or two moving averages;
- RSI or MACD, not both automatically;
- pre-marked support and resistance zones.
Every tool should answer a named question. If an indicator has no defined job, remove it.
Map Trend, Levels and the Actual Setup
Steps 3–5 build the price map. This is the core of the analysis.
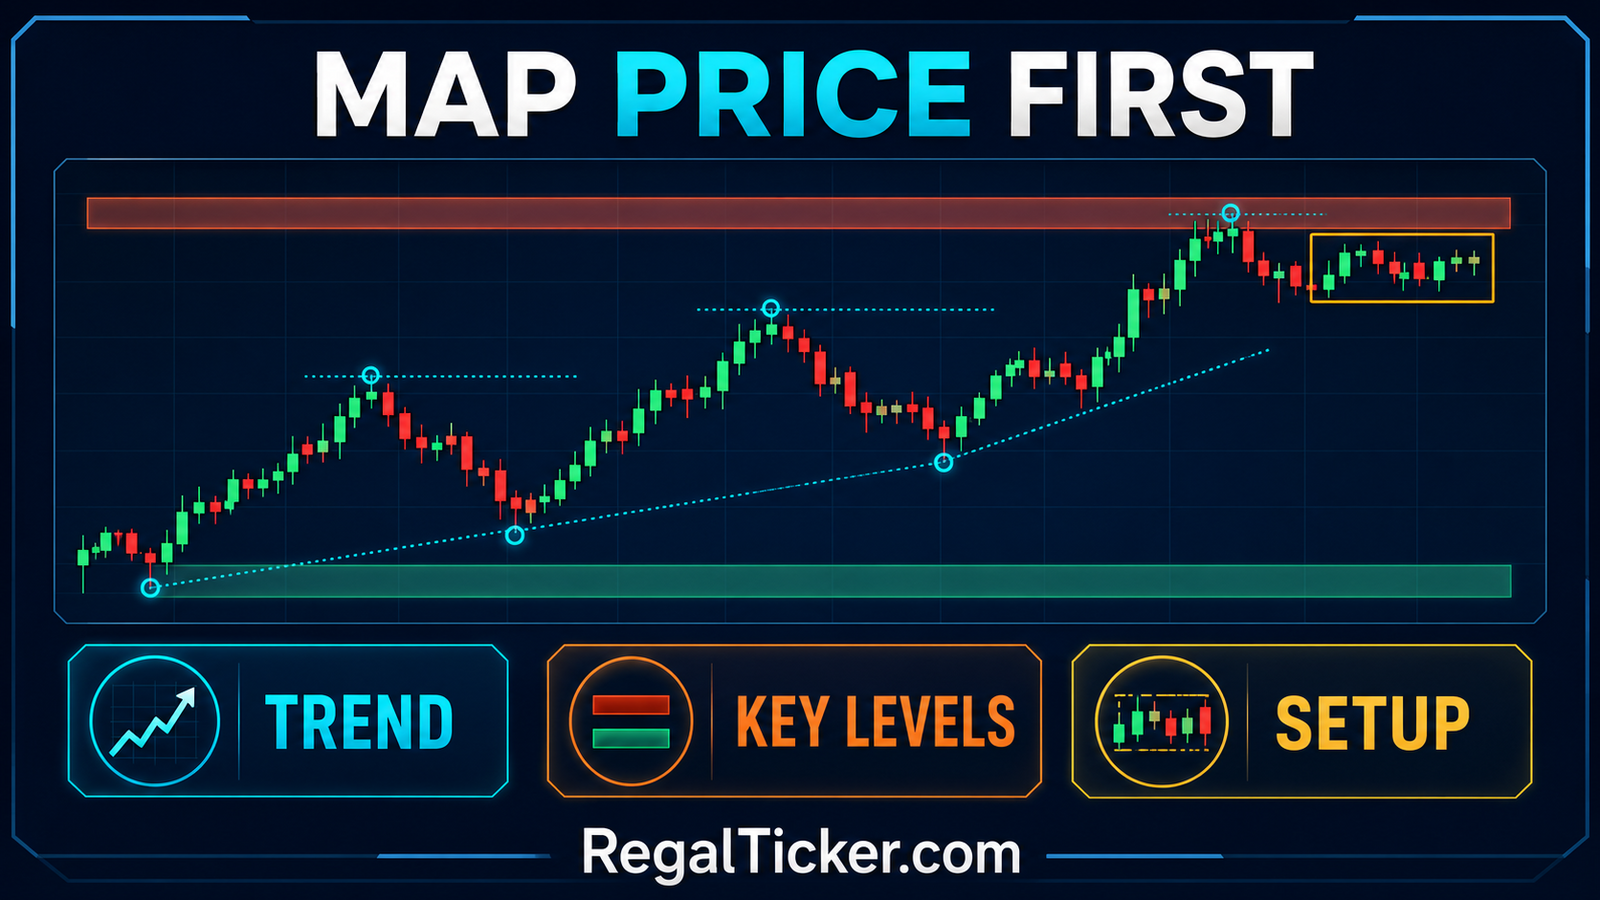
Step 3: Classify the Trend From Market Structure
Use swings before moving averages:
- Uptrend: a sequence of higher highs and higher lows.
- Downtrend: a sequence of lower highs and lower lows.
- Sideways market: repeated movement between support and resistance without sustained directional progress.
- Transition: the prior sequence is weakening or breaking, but a new trend is not yet established.
Read Trend Analysis: Uptrend, Downtrend and Sideways Market for the full framework.
Avoid forcing a label on unclear structure. “Sideways” is a valid conclusion. It may mean a range strategy is appropriate for an experienced trader, or it may mean there is no suitable setup under a trend-following plan.
Record both the primary structure and the latest swing:
> “Daily structure is an uptrend; price is currently pulling back toward prior resistance that may act as support.”
This is more precise than simply writing “bullish.”
Step 4: Mark Support, Resistance and the Next Obstacle
Support and resistance are usually zones, not exact single-price lines. Mark areas supported by visible evidence:
- repeated swing highs or lows;
- prior breakout or breakdown boundaries;
- gap areas;
- range edges;
- high-volume rejection zones;
- important higher-timeframe turning points.
The complete method is explained in Support and Resistance in the Stock Market: Beginner’s Guide.
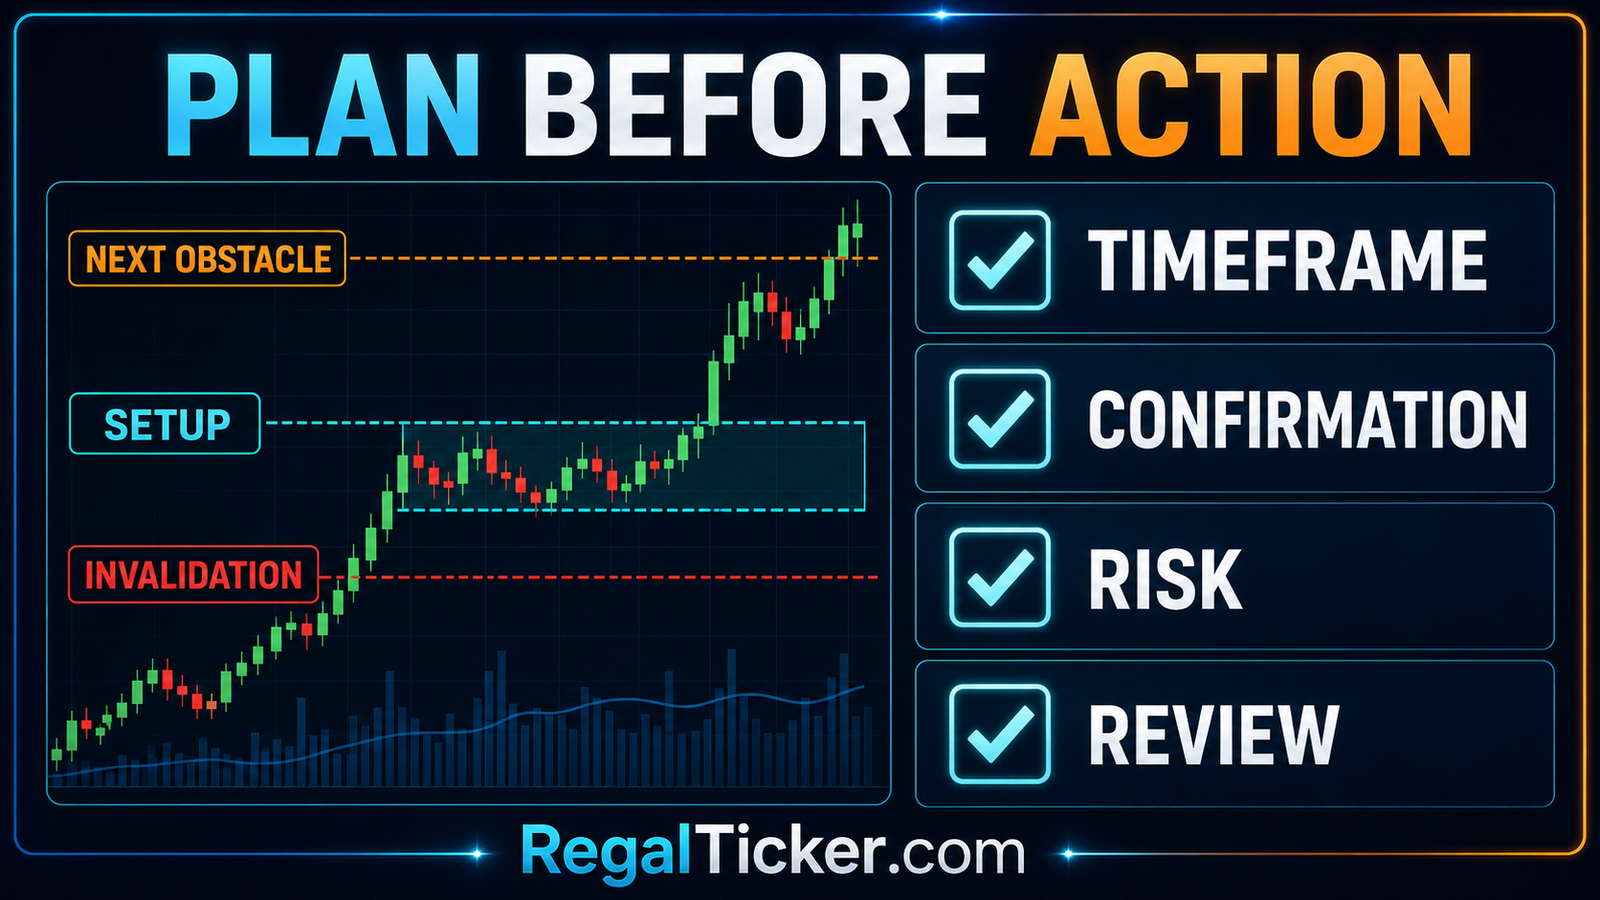
Prioritise the levels that affect the current decision. A chart with twenty lines creates noise. For most setups, identify:
- the nearest meaningful support;
- the nearest meaningful resistance;
- the setup boundary;
- the invalidation area;
- the next obstacle after confirmation.
The next obstacle is essential. A breakout may be technically valid but offer little room before a weekly resistance zone. If the potential reward is compressed while invalidation is far away, the setup may not justify the risk.
Step 5: Name One Setup Clearly
A setup is the price condition being evaluated—not the eventual entry.
Common examples include:
- pullback within an established trend;
- range breakout or breakdown;
- continuation pattern such as a flag or triangle;
- reversal structure such as a double bottom or head and shoulders;
- moving-average trend resumption;
- support rejection;
- resistance rejection;
- failed breakout or failed breakdown.
Chart Patterns Explained: Reversal and Continuation Patterns shows why a pattern is a developing hypothesis until its boundary is confirmed.
Write the setup in observable language:
> “Price has formed a six-week rectangle between ₹720 support and ₹760 resistance. The daily trend before the range was upward. The current question is whether a close above the resistance zone can hold.”
Avoid emotional or predictive language:
- “This share wants to fly.”
- “Operators are accumulating.”
- “The breakout cannot fail.”
- “It must reach the target.”
If accumulation, distribution or manipulation is claimed, the evidence must be stronger than a chart impression. Price and volume can show behaviour; they do not reveal every participant’s identity or intention.
Separate Observation From Interpretation
Use two columns in a chart note:
| Observation | Interpretation |
|---|---|
| Price made a higher high and higher low on the daily chart | Uptrend remains intact |
| Volume contracted during the pullback | Selling participation may be weaker |
| Price is 2% below a prior resistance zone | Setup has not confirmed |
| RSI moved from 74 to 58 while price consolidated | Momentum cooled without reaching an oversold level |
Observations are measurable. Interpretations are hypotheses. Keeping them separate makes later review more honest.
Confirm Participation and Momentum
Steps 6–7 ask whether the setup is supported by activity and momentum. Confirmation should add information, not decorate the chart.
Step 6: Evaluate Volume and Tradability
Volume should be compared with a relevant baseline on the same timeframe:
- recent 10–20 bars;
- earlier attempts at the same level;
- volume during advances versus pullbacks;
- volume on the confirmation candle;
- typical liquidity and spread.
Trading Volume in Stock Market: How to Confirm Price Movements explains how price-volume combinations can differ.
Examples:
- Rising price with expanding volume can show stronger participation.
- A breakout on weak volume may need more follow-through.
- A pullback on contracting volume can suggest reduced selling pressure.
- High volume with a long rejection wick may show absorption rather than clean confirmation.
- Heavy volume during a breakdown can support the move but cannot guarantee continuation.
NSE’s educational material includes price action and volume among technical-analysis topics and describes price and volume as building blocks of market transactions: NSE — Technical Analysis and Chart Patterns for Capital Markets. For actual exchange data, verify activity through official market reports rather than screenshots: NSE — Daily Market Reports and Historical Price-Volume Data.
Volume is not an automatic bullish or bearish signal. It tells you participation increased; the candle, location and follow-through help interpret what that participation achieved.
Step 7: Use Moving Averages, RSI and MACD Selectively
Indicators should answer specific questions:
| Tool | Useful question | Common misuse |
|---|---|---|
| Moving average | Is price generally above or below a smoothed trend reference? | Treating every crossover as an entry |
| RSI | Is recent momentum strong, weak or diverging from price? | Selling only because RSI is above 70 |
| MACD | Is momentum accelerating, slowing or crossing its signal reference? | Ignoring that MACD lags price |
| Volume average | Is current participation unusual relative to recent bars? | Assuming high volume guarantees continuation |
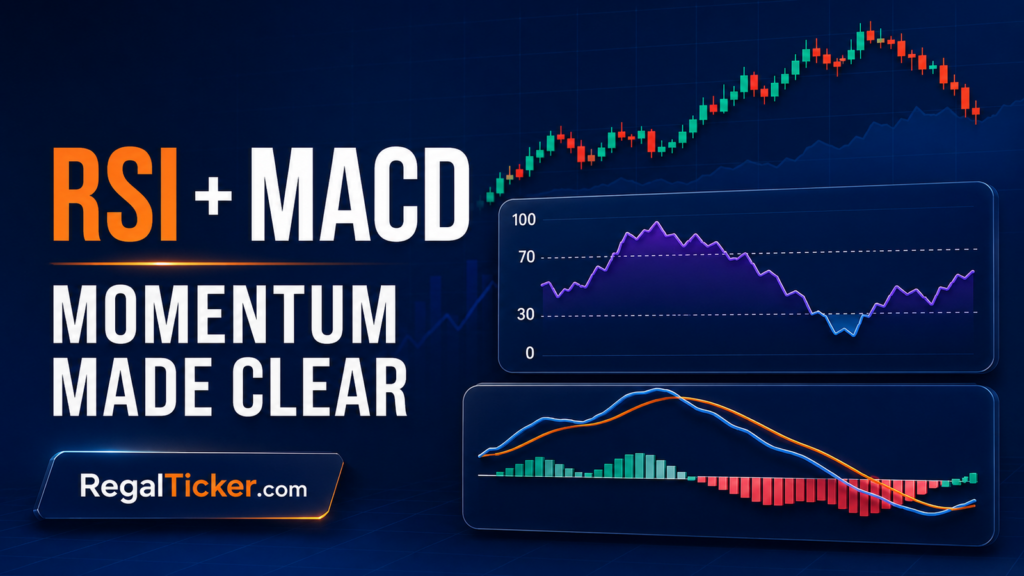
Use Moving Averages in Stock Market: SMA, EMA, Golden Cross and Death Cross and RSI and MACD in Stock Market: Momentum Indicators for Beginners for calculations, interpretations and limitations.
Indicators derived from the same price series are correlated. A rising price can cause:
- price to move above an average;
- a fast average to cross above a slow average;
- MACD to turn positive;
- RSI to rise.
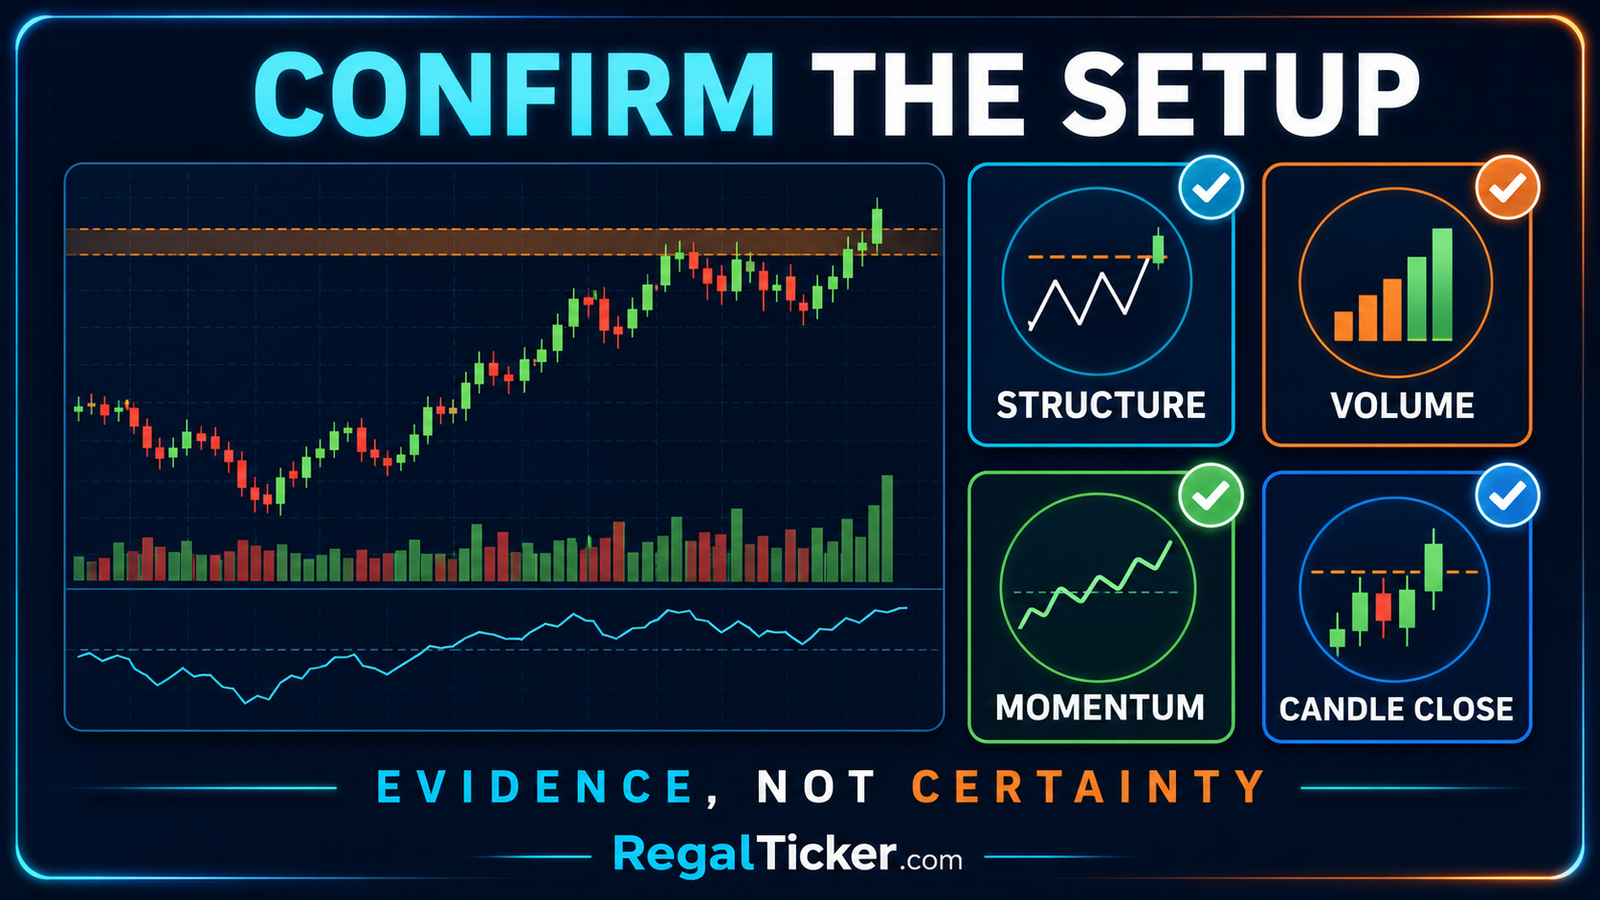
That may look like four independent votes, but all four began with the same price movement. Stronger confluence often combines different categories:
- price structure;
- meaningful level;
- volume participation;
- candle close or retest;
- one momentum tool;
- broader market alignment.
Do Not Let Indicators Overrule Price
Suppose price closes below a well-defined support zone on strong volume, while RSI reads 28. Calling the stock “safe to buy because it is oversold” ignores the breakdown.
RSI can remain below 30 during a strong decline. MACD can stay negative. Price can continue below a moving average. An extreme indicator reading describes current conditions; it does not promise immediate reversal.
Price is the primary evidence. Indicators provide context.
Define Confirmation, Trigger and Invalidation
Steps 8–9 convert the chart hypothesis into objective conditions.
Step 8: Define What Confirms the Setup
A confirmation rule must be observable before the event. Examples include:
- daily close above the complete resistance zone;
- breakdown close below support;
- bullish rejection from a higher-timeframe support zone;
- held retest of former resistance as support;
- break of a pattern boundary with increased volume;
- new higher high after a higher low;
- moving-average recovery combined with a structure break.
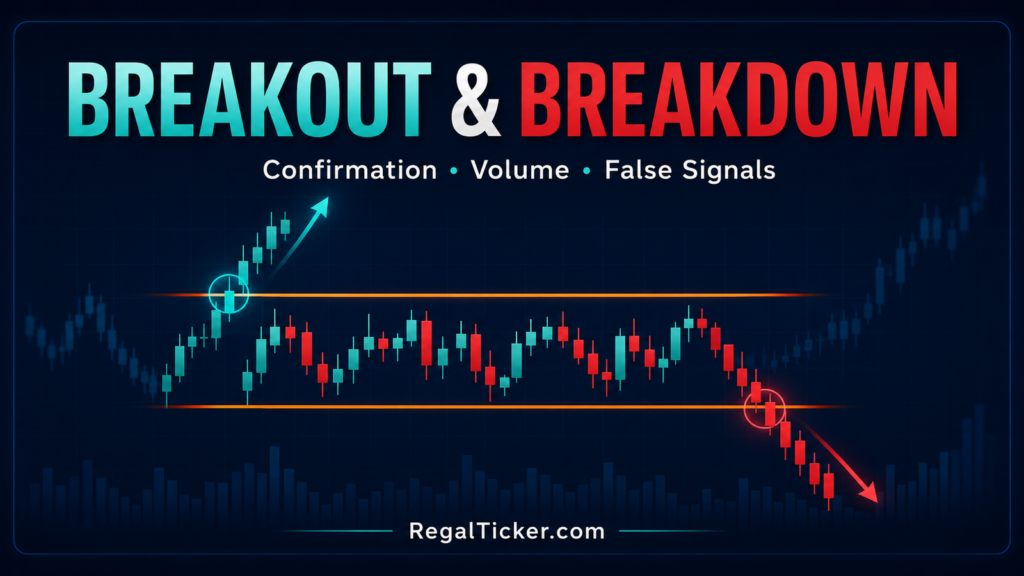
The full breakout framework is covered in Breakout and Breakdown in Stock Market: Confirmation, Retests and False Signals.
Confirmation can be conservative or aggressive:
| Approach | Rule | Benefit | Limitation |
|---|---|---|---|
| Intrabar | Act when price moves beyond the level | Earliest possible response | High exposure to wicks and false moves |
| Close-based | Wait for the working candle to close beyond the zone | Stronger acceptance evidence | Later entry |
| Follow-through | Wait for the next bar to remain outside or extend | Additional evidence | More distance from invalidation |
| Retest-based | Wait for the old boundary to hold after being revisited | Clearer structural test | Retest may not occur |
None is universally best. The method, timeframe, spread and volatility determine which rule is realistic.
Candlesticks matter because the close can differ materially from the intraday high or low. Review How to Read Candlestick Charts: A Beginner’s Guide if the distinction between a wick beyond a level and a close beyond it is unclear.
Step 9: Define Invalidation Before Entry
Invalidation is the price behaviour that proves the setup no longer matches its original logic.
For an upside breakout, invalidation might be:
- a close back inside the prior range;
- a failed retest followed by a lower low;
- loss of the setup’s final higher low;
- a break below the consolidation structure.
For a support-rejection setup, invalidation might be a decisive close below the support zone rather than an arbitrary percentage below entry.
The invalidation should be:
- connected to structure;
- defined on the correct timeframe;
- far enough from ordinary noise;
- close enough that risk remains acceptable;
- unchanged merely because accepting a loss feels uncomfortable.
An arbitrary tight stop may be triggered by normal volatility. An excessively wide stop may convert a short-term idea into an unplanned long-term holding. Structure and risk must be considered together.
Separate Setup Failure From Trade Management
A setup can remain valid while a particular entry was poor. For example, an upside breakout may hold, but chasing a candle far above the level creates an unattractive risk distance.
Similarly, a setup can fail even if price later recovers. The process should be judged using the information and rules available at the decision time—not the best outcome visible afterward.
Measure Risk Before Considering Execution
Step 10 is the gatekeeper. A high-quality chart with unacceptable risk is not an acceptable plan.
Step 10: Calculate Risk per Share
For a long setup:
Risk per share = Planned entry price − Invalidation price
For a short setup, where the instrument and trader are permitted to take such exposure:
Risk per share = Invalidation price − Planned entry price
Hypothetical example:
| Input | Amount |
|---|---|
| Reference entry | ₹512 |
| Structural invalidation | ₹500 |
| Risk per share | ₹12 |
| Maximum planned position loss | ₹1,200 |
| Theoretical shares before costs | 100 |
The theoretical quantity is:
Position size = Maximum planned loss ÷ Risk per share
This is only a mathematical illustration. Brokerage, taxes, slippage, gaps, liquidity and order execution can make actual losses different. A stop order reduces risk only when it can execute; it cannot guarantee the exact stop price during a gap or illiquid move.
Use the calculators in the RegalTicker Investor Tools hub to support arithmetic, but never let a calculator choose the risk tolerance or validate a weak setup.
Compare Risk With the Next Realistic Obstacle
Do not create a target solely to produce a favourable ratio. Use actual chart structure:
- prior swing high or low;
- next weekly support or resistance;
- measured pattern objective used cautiously;
- range boundary;
- trailing structure in an established trend.
If the next major obstacle is ₹524 in the example above:
- potential movement to obstacle = ₹524 − ₹512 = ₹12;
- risk per share = ₹12;
- gross reward-to-risk before costs = 1:1.
If the method requires more room than 1:1 to absorb normal failure rates and expenses, the setup may be rejected even if every indicator agrees.
Account for Costs, Spread, Slippage and Gaps
The chart normally shows traded prices, not the complete transaction result. Include:
- brokerage;
- securities transaction tax and other charges;
- bid–ask spread;
- slippage;
- gap risk;
- partial fills;
- liquidity at the desired quantity.
A narrow expected move can disappear after costs. This is especially important in frequent short-term trading.
SEBI reported that seven out of ten individual intraday traders in the equity cash segment made losses during FY2022–23: SEBI — Analysis of Intraday Trading by Individuals. The lesson is not that technical analysis is useless; it is that real trading outcomes involve discipline, costs, execution and risk—not chart recognition alone.
Know When “No Trade” Is the Best Output
Reject the setup when:
- the timeframe is unclear;
- the level was drawn after the move;
- liquidity is poor;
- confirmation is absent;
- invalidation cannot be placed logically;
- the next obstacle is too close;
- the required loss exceeds the plan;
- a major event creates unquantifiable gap risk;
- the price has moved too far from the setup;
- the analysis depends on changing rules.
“No trade” is a complete analytical conclusion.
Worked Example: From Blank Chart to Written Plan
Consider a hypothetical liquid stock called Meridian Components. The numbers are illustrative and are not based on a live recommendation.
Step 1: Horizon
The analyst intends to evaluate a swing lasting several days to a few weeks.
- Weekly chart: context.
- Daily chart: setup and confirmation.
- Four-hour chart: optional monitoring, not a reason to override the daily structure.
Step 2: Context
The broad index is above a rising medium-term moving average. The relevant sector index is also trending upward but is approaching prior resistance. Meridian Components trades with regular daily volume and a relatively narrow spread.
No financial results are scheduled during the next week, but the analyst records the next result date rather than assuming no event risk exists.
Step 3: Trend
The weekly chart shows higher highs and higher lows. The daily chart also trends upward but has moved sideways for fifteen sessions.
Conclusion: primary trend is up; current daily condition is consolidation, not a new confirmed advance.
Step 4: Levels
The daily range is:
- support zone: ₹486–₹490;
- resistance zone: ₹510–₹512;
- next weekly obstacle: ₹536–₹540;
- last meaningful higher low: ₹482.
The analyst marks zones before the breakout.
Step 5: Setup
The setup is a potential continuation breakout from a rectangular consolidation. The prior trend was upward, but the pattern remains incomplete until price closes beyond resistance.
Step 6: Volume
Volume contracted during most of the range. The latest attempt at resistance occurred on volume 1.6 times the recent 20-day average.
That is supportive evidence, not proof.
Step 7: Indicators
Price remains above a rising 50-day moving average. RSI is 61, showing positive momentum without an extreme reading. MACD has turned upward near the zero line.
The indicators align with the price structure, but the analyst does not count them as three independent reasons.
Step 8: Confirmation
The predefined trigger is a daily close above ₹512, preferably with volume above the recent average. An intraday wick to ₹514 followed by a close at ₹509 would not qualify.
Step 9: Invalidation
If a breakout occurs near ₹514, the structural invalidation is below ₹500, where price would have returned materially inside the range. A close below ₹486 would invalidate the wider consolidation thesis even more clearly, but that distance may be too large for the intended risk.
The analyst uses the nearer rule only if it is structurally defensible. The rule is not moved after entry.
Step 10: Risk
Hypothetical plan:
| Item | Value |
|---|---|
| Reference entry after confirmation | ₹514 |
| Invalidation | ₹500 |
| Risk per share | ₹14 |
| First major obstacle | ₹538 |
| Gross potential movement | ₹24 |
| Gross reward-to-risk before costs | About 1.71:1 |
The analyst then applies the maximum loss allowed by the personal plan, checks quantity against liquidity and includes costs. If price opens at ₹525 after a gap, the original ₹514 plan is not copied blindly. The risk and reward must be recalculated.
Write the Final Thesis
The completed note might read:
> “Meridian Components is in a weekly and daily uptrend and has formed a fifteen-session range below ₹510–₹512 resistance. I will recognise confirmation only after a daily close above the zone, with participation compared against the 20-day volume baseline. A return below ₹500 invalidates the immediate breakout plan. The next weekly obstacle is ₹536–₹540. If the price gaps materially beyond the reference entry or the required risk exceeds my limit, I will not act.”
This note is specific, measurable and reviewable.
Final Technical Analysis Checklist, Mistakes and FAQs
Use the following checklist before finalising any chart analysis.
Complete Pre-Analysis Checklist
| Category | Check |
|---|---|
| Objective | Have I defined whether this is education, screening, investment timing or a trade setup? |
| Timeframe | Are context, working and entry timeframes fixed? |
| Context | Have I checked the broad index, sector, liquidity and event calendar? |
| Trend | Can I identify higher highs/lows, lower highs/lows or a range? |
| Levels | Are support, resistance, invalidation and next obstacle marked as zones? |
| Setup | Can I name one observable pattern or behaviour? |
| Volume | Is participation compared with a relevant baseline? |
| Indicators | Does each selected indicator answer a defined question? |
| Confirmation | Is the trigger objective and written before price moves? |
| Invalidation | Is the failure point structural and on the correct timeframe? |
| Risk | Are risk per share, quantity, costs and gap risk considered? |
| Review | Will I save the chart and evaluate rule-following afterward? |
Common Mistakes to Avoid
| Mistake | Why it weakens the process | Better practice |
|---|---|---|
| Starting with an indicator signal | Removes price and level context | Map trend and structure first |
| Changing timeframe to protect an opinion | Creates inconsistent invalidation | Fix chart hierarchy in advance |
| Drawing too many levels | Makes every price a signal | Keep only decision-relevant zones |
| Predicting a pattern before confirmation | Confuses possibility with evidence | Define the boundary and wait |
| Treating high volume as always bullish | Volume can accompany rejection or selling | Read volume with candle and location |
| Counting correlated indicators as independent votes | Creates false confidence | Combine different evidence categories |
| Entering before defining invalidation | Makes loss control emotional | Write failure conditions first |
| Chasing a large confirmation candle | Expands risk and reduces room to obstacle | Recalculate or wait for another setup |
| Ignoring spread and costs | Overstates the practical opportunity | Estimate the full transaction impact |
| Moving the stop farther after entry | Converts a planned risk into hope | Keep rules or exit according to plan |
| Judging only by profit or loss | A lucky result can hide a bad process | Review whether the rules were followed |
| Following social-media tips | Outsources responsibility to unverified claims | Use evidence and regulated sources |
SEBI’s do’s and don’ts for securities-market investors specifically warns against relying on hot tips and encourages decisions aligned with objectives and risk appetite. A checklist is valuable because it slows the transition from an attractive chart to an impulsive order.
Keep a Chart Journal
Save the chart at four moments:
- before confirmation;
- at the decision point;
- after invalidation or exit;
- during later review.
Record:
- date and timeframe;
- market and sector context;
- setup name;
- supporting and conflicting evidence;
- trigger;
- invalidation;
- intended risk;
- actual execution;
- costs and slippage;
- whether rules were followed;
- one improvement for the next analysis.
Do not judge the process from a single outcome. A rule-following loss can be better evidence of discipline than a rule-breaking profit.
Frequently asked questions
What is the first step in technical analysis of a stock?
Define the intended holding period and choose the primary timeframe. Without a clear decision horizon, a weekly uptrend and an intraday downtrend can create unnecessary confusion.
How many timeframes should I use?
Three are usually enough: a higher timeframe for context, a working timeframe for the setup and an optional lower timeframe for confirmation. Using too many timeframes can add noise without improving the decision.
Which indicator is best for technical analysis?
No single indicator is best in every market condition. Price structure and important levels should come first. Moving averages can support trend analysis, while RSI or MACD can add momentum context. Each tool should have a defined purpose and known limitation.
Should I use RSI and MACD together?
You can, but both are derived from price and may provide correlated information. Using both is not automatically stronger than combining price structure, volume, one momentum tool and an objective confirmation rule.
How do I know whether a breakout is real?
You cannot know with certainty. Check whether the level was clearly defined, the candle closed beyond the zone, participation expanded, price held outside the range and any retest was accepted. Define the false-breakout invalidation before taking action.
Can technical analysis identify multibagger stocks?
Technical analysis can show trend, momentum and market behaviour, but it cannot establish durable business quality, governance or intrinsic value. Long-term company assessment requires fundamental research in addition to price analysis.
Can I trade only from chart patterns?
Chart patterns can organise price behaviour, but they should be read together with trend, support and resistance, volume, liquidity, confirmation and risk. A pattern name by itself is not a complete trading plan.
Where should a stop-loss be placed?
The invalidation level should be placed where the original setup logic is no longer valid, using the correct timeframe and allowing for ordinary volatility. Position size should then be calculated from that risk distance. A stop order cannot guarantee the exact execution price during gaps or illiquid conditions.
Is technical analysis useful for long-term investors?
Yes, it can help long-term investors understand trend, volatility and timing, but it should not replace analysis of the company, industry, financial statements, valuation and business quality.
Final Takeaway
Learning how to analyse a stock technically means learning a sequence, not collecting indicators. Define the horizon, check market context, map trend and levels, name one setup, evaluate volume, use indicators selectively, wait for confirmation, set invalidation and measure risk.
The chart should produce a written, falsifiable plan. If the setup lacks clarity, the invalidation is illogical or the risk is unacceptable, the correct conclusion is to wait.
Technical Analysis Lessons 1–9 provide the detailed building blocks:
- What Is Technical Analysis? Meaning, Tools and Examples
- How to Read Candlestick Charts: A Beginner’s Guide
- Support and Resistance in the Stock Market: Beginner’s Guide
- Trend Analysis: Uptrend, Downtrend and Sideways Market
- Chart Patterns Explained: Reversal and Continuation Patterns
- Trading Volume in Stock Market: How to Confirm Price Movements
- Moving Averages in Stock Market: SMA, EMA, Golden Cross and Death Cross
- RSI and MACD in Stock Market: Momentum Indicators for Beginners
- Breakout and Breakdown in Stock Market: Confirmation, Retests and False Signals
Use them with this checklist until the process becomes consistent, simple and reviewable.