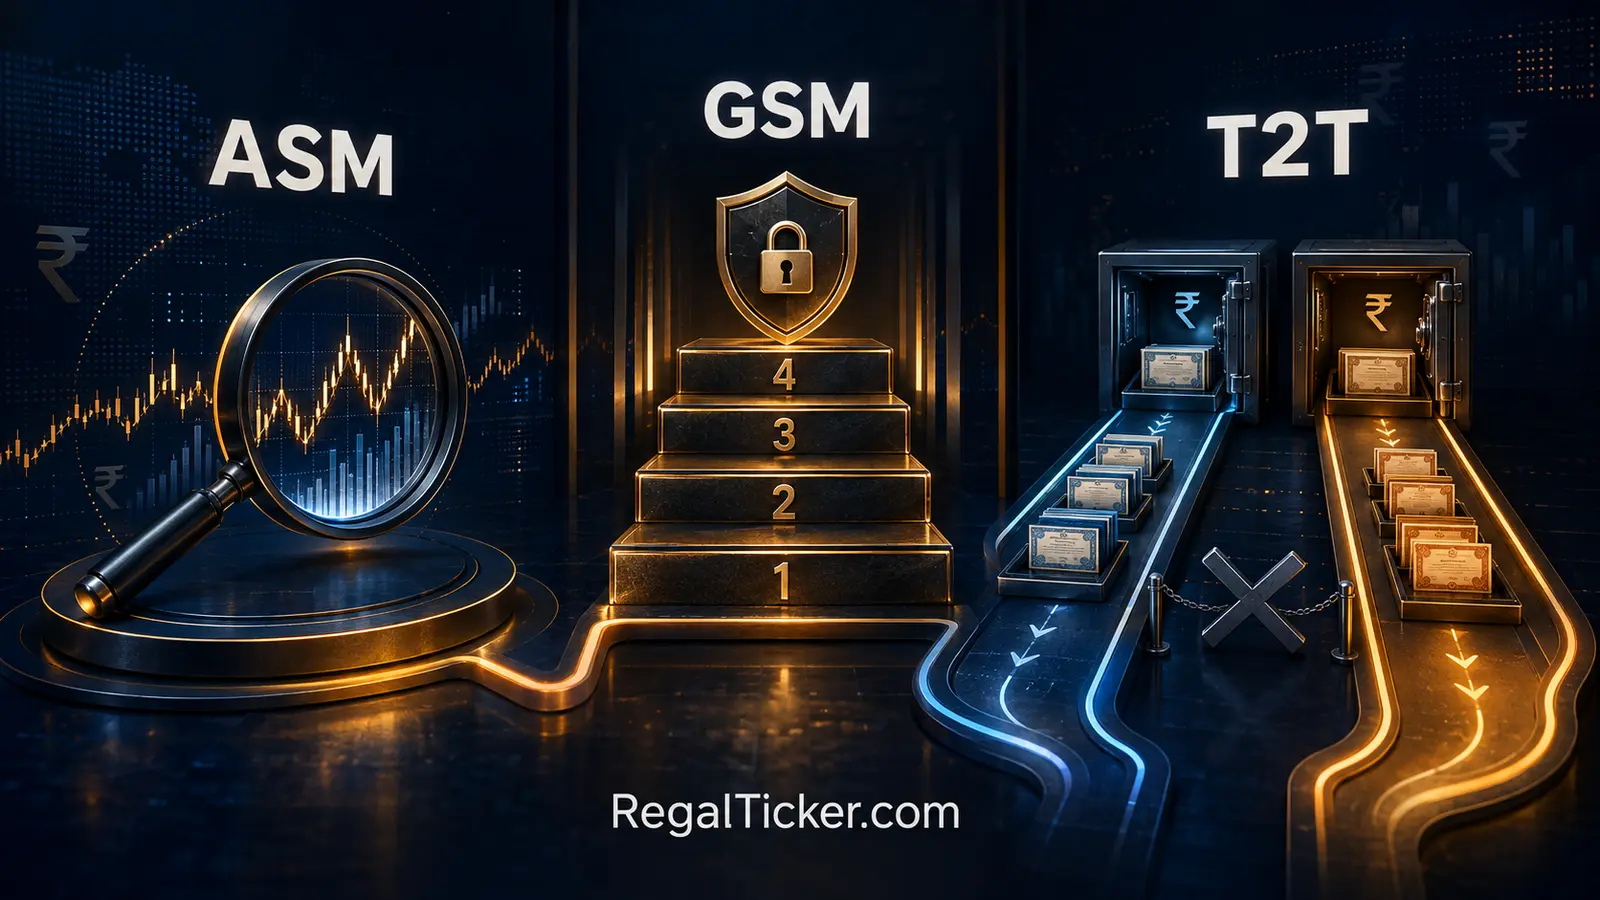
ASM GSM and T2T stocks are terms used around market surveillance, trading restrictions and settlement in India, but the three labels do not mean the same thing. ASM stands for Additional Surveillance Measure. GSM stands for Graded Surveillance Measure. T2T means Trade-to-Trade settlement. A security can enter one framework because its market data meets specified surveillance criteria, while another can be shifted to trade-to-trade settlement under a separate review process.
The labels are designed to alert market participants, strengthen risk controls and protect market integrity. They are not research ratings. Inclusion does not automatically prove fraud, manipulation or a weak business. Removal does not certify that the company is financially sound. An investor must separate the exchange’s market-surveillance action from the company’s financial position and from the investor’s own decision.
This lesson explains the current framework in practical language: what ASM means, how long-term and short-term ASM differ, how the current four GSM stages work, what no netting means in T2T, how to read exchange and broker warnings, and what to check before placing an order. Because surveillance lists and circulars can change, the official exchange source and effective date always take priority over an old screenshot or article.
This ninth lesson in the Market Terminology learning hub follows Stock Market Terminology: 50 Essential Terms, Face Value, Book Value and Market Value, Absolute Return vs CAGR vs XIRR, 52 Week High and Low, Upper Circuit and Lower Circuit, Bulk Deal vs Block Deal, FII vs DII and Promoter Holding and Pledged Shares. It owns the narrower terminology intent around ASM, GSM, T2T, BE series, surveillance stages and settlement restrictions.
ASM GSM and T2T Stocks: Quick Difference
The fastest way to avoid confusion is to ask what each label controls.
| Term | Full form | Main purpose | What the investor may notice | What it does not prove |
|---|---|---|---|---|
| ASM | Additional Surveillance Measure | Apply enhanced pre-emptive surveillance when objective market parameters trigger concern | Higher margin, narrower price band, gross settlement or other stage-specific controls | That the company committed fraud |
| GSM | Graded Surveillance Measure | Apply progressively stronger restrictions to identified securities | 100% margin, T2T, ASD, weekly trading or no upward movement depending on stage | That every GSM stock has the same risk or stage |
| T2T | Trade-to-Trade settlement | Settle each trade separately on delivery basis without netting | BE series on NSE, no intraday netting, separate delivery obligations | That the stock is automatically under GSM |
| Price band | Permitted daily trading range | Restrict how far a security can move during the session | Orders may queue at upper or lower band | That an order at the band will execute |
| Market-wide circuit breaker | Index-level market halt | Pause the broader market after specified index moves | Coordinated market halt | The same thing as a stock-level surveillance label |
ASM Is a Framework, Not a Permanent Tag
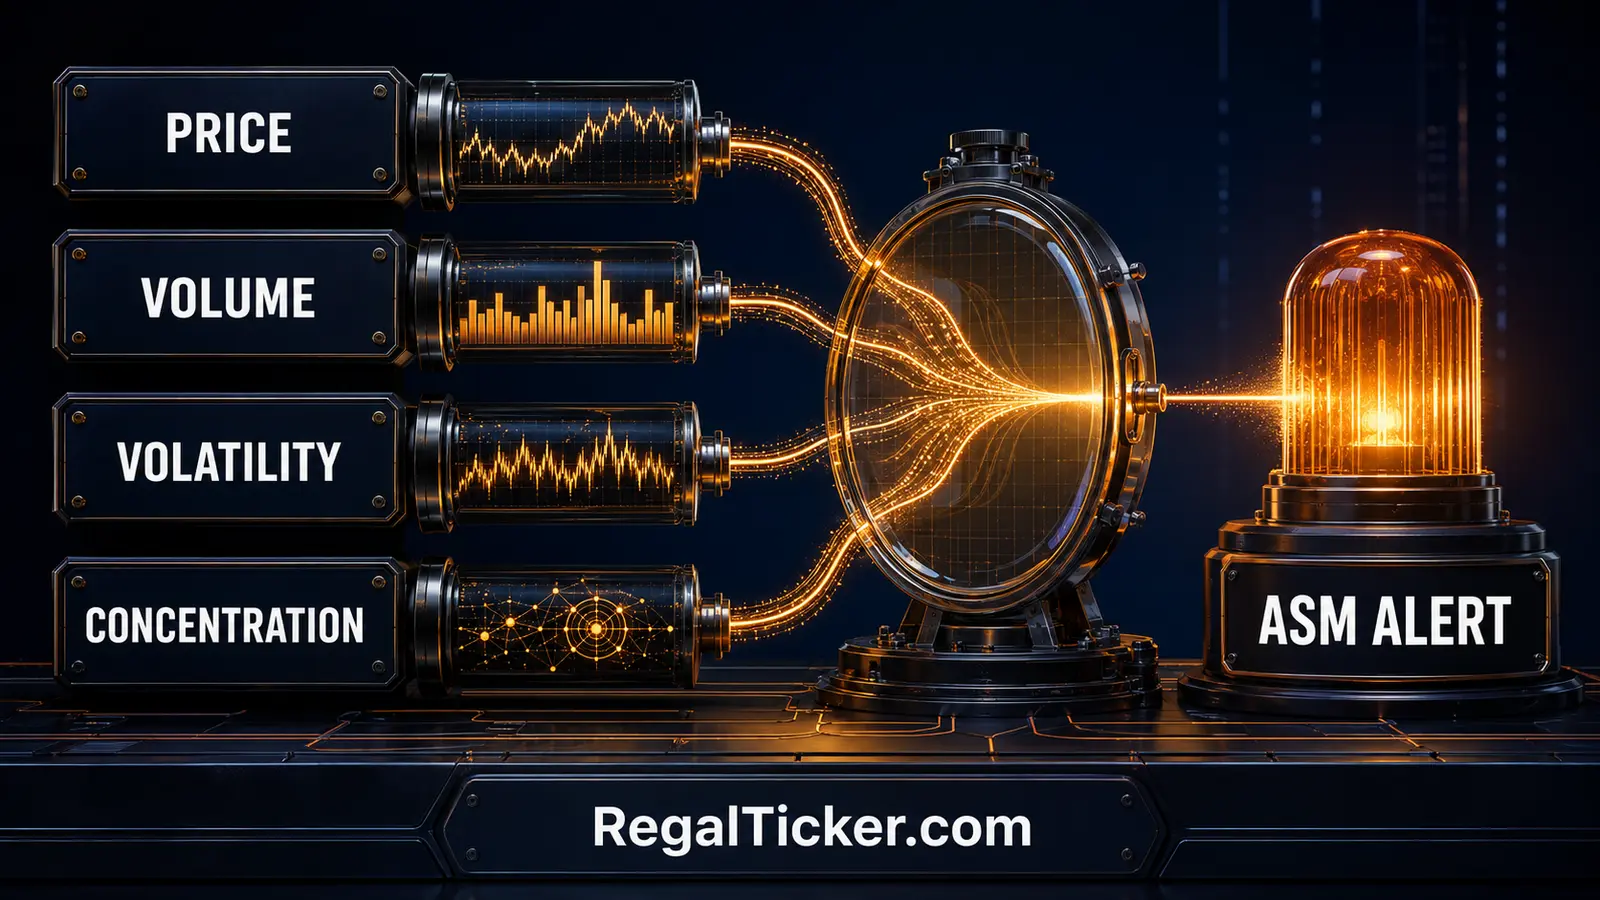
ASM is based on market-surveillance criteria such as price variation, volume variation, volatility, client concentration, delivery percentage, market capitalisation, number of unique PANs and valuation measures. A stock can move into, through or out of an ASM stage according to the applicable review. The framework includes long-term and short-term forms, and the exact action depends on the security and stage.
This is why the phrase “ASM stock” is incomplete. The investor should ask: long-term or short-term ASM, which stage, which effective date, what action applies, and whether another surveillance measure also applies.
GSM Uses Progressive Stages
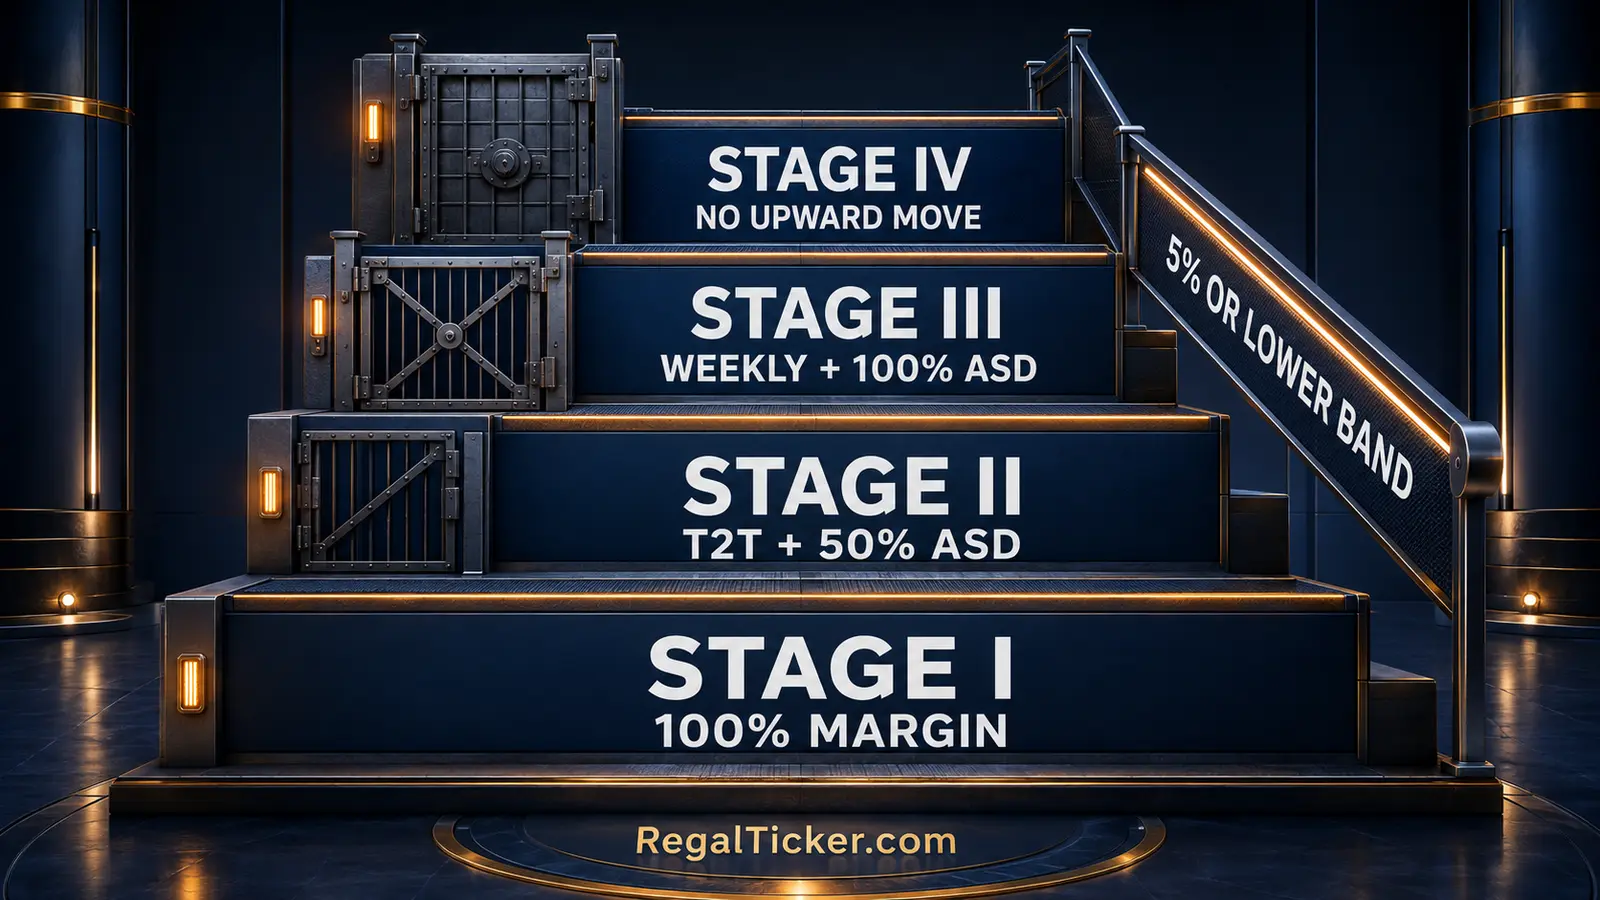
GSM is explicitly graded. Under the current NSE framework displayed in June 2026, Stage I begins with 100% margin and a price band of 5% or lower as applicable. Stage II adds trade-to-trade settlement and a 50% Additional Surveillance Deposit for buyers. Stage III permits trading once a week and requires a 100% ASD from buyers. Stage IV continues weekly trading and 100% ASD with no upward movement.
Do not rely on the word “GSM” alone. Stage I and Stage IV have materially different implications for trading frequency, cash commitment and exit flexibility.
T2T Is About Settlement
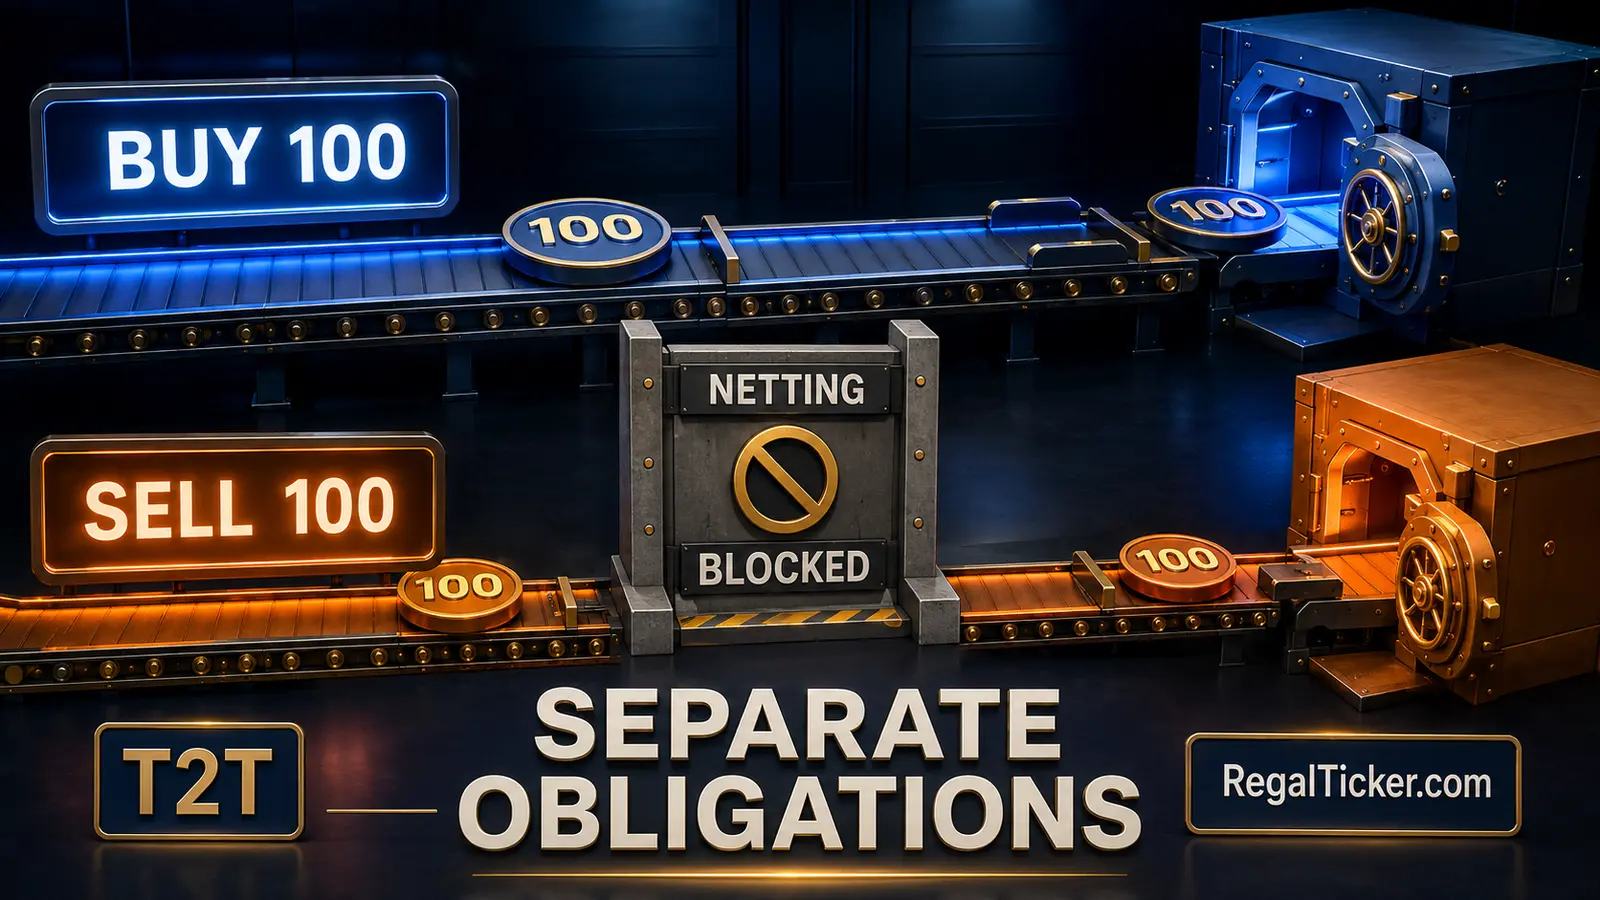
On NSE, securities in the trade-to-trade segment are made available under the BE series. Settlement occurs on a trade-for-trade basis and netting is not allowed. A purchase and sale are treated as separate settlement obligations rather than being collapsed into a single intraday net position.
T2T can appear as an action inside a surveillance framework, but it also has its own periodic movement and review process. Therefore, “T2T” and “GSM” cannot be used as synonyms.
One Security May Face More Than One Control
Surveillance measures operate alongside other exchange controls. A security may have an ASM or GSM indicator, a reduced price band and gross settlement. A broker may impose an additional house restriction beyond the exchange minimum. The correct question is not “Which one label applies?” but “What is the complete current trading and settlement condition?”
Before calculating a possible trade, open the current exchange list, read the stage or series, and check the broker order screen. Then estimate the planned downside with the Risk-Reward Calculator and transaction costs with the Brokerage Calculator. A calculator cannot remove a surveillance restriction, but it can prevent the restriction from hiding weak personal arithmetic.
What ASM Stocks Mean and How the Framework Works
The NSE Additional Surveillance Measure page states that SEBI and the exchanges use enhanced pre-emptive surveillance to safeguard market integrity and investor interests. Securities are shortlisted through objective criteria that include high-low variation, client concentration, close-to-close variation, market capitalisation, volume variation, delivery percentage, unique PANs and P/E.
The key word is surveillance. ASM responds to unusual or concentrated market behaviour. It is not an audit opinion on the company and not a replacement for reading its filings.
Long-Term ASM
Long-term ASM monitors securities through a stage structure. The detailed entry criteria are technical and are updated through exchange circulars. They compare corporate-action-adjusted price behaviour, index-relative variation, trading concentration, volume, delivery, market capitalisation and other parameters.
For a beginner, the stage actions matter more than memorising every formula:
| Long-term ASM stage | Simplified current action for non-derivative stocks |
|---|---|
| Stage I | Applicable margin becomes 100% from the specified effective day |
| Stage II | Price band moves to the next lower level; margin remains 100% |
| Stage III | Price band is reduced further; margin remains 100% |
| Stage IV | Gross settlement, 100% margin and a 5% price band |
These are simplified practical effects from the September 2025 NSE ASM FAQ. Derivative stocks and their F&O contracts have a related but different action path, including changes in margin and market-wide position limits. An investor must read the applicable framework rather than copying the cash-market table to every security.
Short-Term ASM
Short-term ASM is designed for sharp market behaviour over shorter windows. The current FAQ describes identification through combinations of price variation, client concentration and other market-based criteria. For shortlisted non-derivative stocks, the applicable margin is 100% or the existing margin, whichever is higher, capped at 100%. Derivative stocks and related contracts have stage-specific margin treatment.
Short-term does not mean harmless. It refers to the surveillance window and review structure, not to a prediction that the restriction will disappear quickly. A stock is reviewed according to the framework; the investor should never plan liquidity around an assumed exit date.
Why Corporate-Action-Adjusted Prices Matter
A bonus issue or stock split can mechanically change the displayed price. Surveillance calculations use corporate-action-adjusted prices where specified so that a legitimate adjustment is not confused with an unexplained market move.
Investors must make the same distinction in their own records. If quantity changed after a bonus, use the Bonus Share Calculator. For a split, use the Stock Split Calculator. To compare economic return across either event, use the Bonus & Split Adjusted Return Calculator. Do not treat an adjusted price as a sudden loss or a surveillance trigger by itself.
ASM Is Not an Adverse Finding Against the Company
NSE’s FAQ explicitly says that shortlisting under ASM is purely on account of market surveillance and should not be construed as an adverse action against the company or entity. That is an important protection against sensational conclusions.
It does not mean the stock is safe. It means the label has a defined scope. Research the business through How to Analyse a Company Fundamentally, then examine exchange announcements, financial statements, auditor remarks, related-party transactions, promoter holding and pledge data. Use Promoter Holding and Pledged Shares to keep ownership risk separate from the surveillance label.
What 100% Margin Changes
At 100% margin, the trading system and broker require substantially higher funds or eligible collateral relative to the position. Leverage can be reduced or unavailable. Broker-level treatment may be stricter. This changes the cash committed, but it does not cap the investor’s economic loss after purchase.
Suppose an investor buys 500 shares at ₹120. The position value is ₹60,000 before charges. Funding ₹60,000 does not make the investment low-risk. If the stock later falls to ₹90 and the order can execute, the price loss is ₹15,000 before costs:
Price loss = (₹120 − ₹90) × 500 = ₹15,000
Model the position with the Risk-Reward Calculator, add estimated charges through the Brokerage Calculator, and record only executed purchases in the Stock Average Calculator. Margin is a market-risk control, not a return guarantee.
What GSM Stocks Mean and How the Four Stages Work
GSM is intended to warn investors and apply stronger controls in stages. The NSE GSM page explains that market participants dealing in identified securities must be extra cautious and diligent. The current page, updated 12 June 2026, shows four stages.
Stage I: 100% Margin and a 5% or Lower Price Band
At Stage I, the applicable margin rate is 100%, and the price band is 5% or lower as applicable. The narrow band can create queues and constrain daily price discovery. A buyer should not interpret the band as downside protection; the price can move through repeated sessions.
Read Upper Circuit and Lower Circuit before placing an order in a narrow-band stock. An upper-band queue may prevent a buy from executing. A lower-band queue may prevent a sell from executing. Displayed order quantity is not guaranteed liquidity.
Stage II: T2T Plus 50% ASD
At Stage II, the security is in trade-to-trade settlement with a 5% or lower price band, and buyers deposit an Additional Surveillance Deposit equal to 50% of trade value under the current framework. ASD is an additional cash deposit; it is separate from the investment amount and ordinary charges.
For a hypothetical trade value of ₹80,000:
50% ASD = ₹80,000 × 50% = ₹40,000
This illustration explains scale only. The broker screen, exchange circular and current framework determine the actual amount and timing. Do not add ₹40,000 to the cost basis as though it were a purchase charge. Track blocked funds separately from acquisition cost. Use the Stock Average Calculator for executed price and quantity and the Brokerage Calculator for transaction charges.
Stage III: Weekly Trading and 100% ASD
At Stage III, trading is permitted once a week—every Monday or the first trading day of the week—and buyers deposit ASD equal to 100% of trade value. The security remains in T2T with a 5% or lower price band.
For a ₹80,000 purchase, a 100% ASD is another ₹80,000 of cash deposit under the stated framework. The total cash tied up can therefore be materially larger than the economic purchase price, before ordinary settlement obligations and charges are considered. Weekly trading also means an investor may not be able to react on the day new information arrives.
That illiquidity must be treated as a core risk. A theoretical stop-loss is not useful if trading is unavailable or the sell order cannot match. The Risk-Reward Calculator can show planned downside, but it cannot promise execution.
Stage IV: Weekly Trading, 100% ASD and No Upward Movement
Stage IV retains trade-to-trade settlement, the 5% or lower band, weekly trading and 100% ASD, while allowing no upward price movement. This is a severe trading constraint. The phrase “no upward movement” must not be mistaken for a low-risk entry. It directly restricts the price path while liquidity remains limited.
An investor who sees a visually low price must not call it cheap. Compare the company’s business, financial statements, share count and liabilities. Review Face Value, Book Value and Market Value because a low market price has no necessary relationship with face value or book value.
GSM Review and Exit Are Not Instant
The GSM framework identifies and reviews securities on the specified schedule. A stock can move between stages or out of the framework after applicable review, but the investor should not assume a particular date or direction. Exchange circulars announce stage movement.
ASD release follows the exchange schedule; it is not freely usable for further exposure while retained. This creates an opportunity cost even if the deposit is later released. Do not measure a GSM investment using only the quoted purchase price. Measure all cash flows and dates. The XIRR Calculator is appropriate when cash moves on different dates, while the CAGR Calculator is appropriate only for one beginning value and one ending value over a multi-year period.
What T2T Stocks Mean and How Settlement Works
Trade-to-trade is a settlement category, not a statement about company quality. The NSE trade-to-trade review page says securities in the segment are available under the BE series and settled on a trade-for-trade basis, with no netting off allowed.
No Netting Means Separate Obligations
In a normal net-settled context, offsetting eligible trades may reduce the final net obligation. In T2T, each trade is considered separately for settlement. If an investor buys 100 shares and sells 100 shares, the two transactions are not simply cancelled as a zero intraday position.
The practical lesson is simple: do not attempt an intraday strategy in a T2T security. Broker systems commonly restrict intraday product types for such stocks. Even if an order interface accepts both sides, settlement obligations remain. Selling shares that are not available for delivery can create short-delivery and auction risk.
Delivery Is More Important Than the Screen Position
Before selling, confirm that settled shares are available in the demat account and eligible for delivery. Do not assume that a recently purchased quantity is immediately safe to resell merely because it appears in a position window. Settlement timing, broker processes, early pay-in and exchange rules matter.
Read What Is a Demat Account? and Demat Account vs Trading Account vs Bank Account to distinguish order execution from securities custody and settlement. A trade confirmation is not the same thing as settled demat availability.
T2T Does Not Guarantee Liquidity
Delivery-based settlement does not create buyers. A security can remain difficult to exit because of a narrow price band, small public float, concentrated activity or a queue at the lower band. Volume on one day also does not guarantee future depth.
Use Trading Volume in Stock Market and Bid Price, Ask Price, Spread and Order Book to read activity and visible liquidity. Then use the Brokerage Calculator to estimate costs. Never treat a low spread or a large displayed order as a promise of execution.
T2T Can Exist Outside GSM
The exchanges periodically review securities for movement into and out of trade-to-trade settlement based on jointly decided criteria. GSM can also place a security into T2T at a specified stage. These are related routes, not one identical label.
To verify the current position, check:
- the exchange series or settlement category;
- the current T2T list and effective date;
- the ASM and GSM lists separately;
- any stage indicator shown by the broker;
- the price band;
- cash, margin or ASD requirement;
- permitted trading days;
- delivery availability before a sell order.
A T2T Purchase Still Has Full Return and Tax Arithmetic
Suppose 300 shares are purchased at ₹75 and later sold at ₹66 after they are settled and sale execution is available.
Gross price result = (₹66 − ₹75) × 300 = −₹2,700
The final economic result also includes charges, dividends if any and tax treatment. Use the Stock Return Calculator for the realised holding result, the Dividend Calculator for income and yield, the Brokerage Calculator for transaction costs, and the Capital Gains Tax Calculator for an estimate based on the applicable gain and holding-period inputs.
How ASM, GSM, T2T and Price Bands Can Overlap
The labels describe different layers of control, so an investor may see several at once. One framework can trigger 100% margin. Another stage can introduce T2T and ASD. The applicable price-band framework can narrow the daily range. The broker can then apply an additional internal restriction.
Think in Layers, Not Labels
Use this order:
| Layer | Question to ask | Source to verify |
|---|---|---|
| Surveillance framework | Is the security under ASM, GSM, ESM or another measure? | Exchange surveillance page and circular |
| Stage | Which current stage applies? | Latest effective exchange list |
| Trading frequency | Can it trade daily or only on a specified weekly day? | Stage action and broker notice |
| Price range | What price band applies today? | Exchange quote and price-band page |
| Settlement | Is it rolling settlement or trade-to-trade/gross settlement? | Series and settlement notice |
| Funds | What margin, ASD or broker cash requirement applies? | Exchange framework and broker order screen |
| Liquidity | Are orders actually matching? | Order book, volume and trade data |
| Company facts | Has the business or disclosure position changed? | Exchange corporate filings |
A Price Band Is Not T2T
A price band restricts the permitted quote range. T2T determines how trades are settled. A security can have a price band without being T2T. A GSM stage can combine both. Read the exact current status instead of translating every circuit message into “trade-to-trade.”
Gross Settlement Is Not the Same as Guaranteed Delivery
Gross or trade-to-trade settlement removes netting, but settlement risk still exists. A seller can fail to deliver. Auction and close-out procedures may apply according to the settlement situation. The buyer should not assume that paying full cash guarantees receipt on every attempted trade.
Surveillance Lists Are Dynamic
A social-media post may show yesterday’s list, an earlier stage or a different exchange. A company can have different series codes or effective dates across venues. Always record:
- source URL;
- publication date;
- effective date;
- exchange;
- security symbol and series;
- framework and stage;
- review or exit circular if applicable.
Corporate Actions Can Change the Screen Without Changing Economics
Bonus issues, splits, rights issues, buybacks and demergers can alter price, share count or cost allocation. The exchange may use adjusted prices where specified, and the investor must adjust personal records too.
Use the Rights Issue Calculator for entitlement and theoretical ex-rights price, the Buyback Acceptance Ratio Calculator for tender assumptions, and the Demerger Cost Basis Calculator after official cost-allocation information is available. Surveillance status does not replace corporate-action arithmetic.
How to Verify a Surveillance Stock Before Placing an Order
The highest-risk mistake is acting from a broker pop-up without reading what it says. A good warning is specific: framework, stage, series, effective date and restriction. Treat it as the beginning of research.
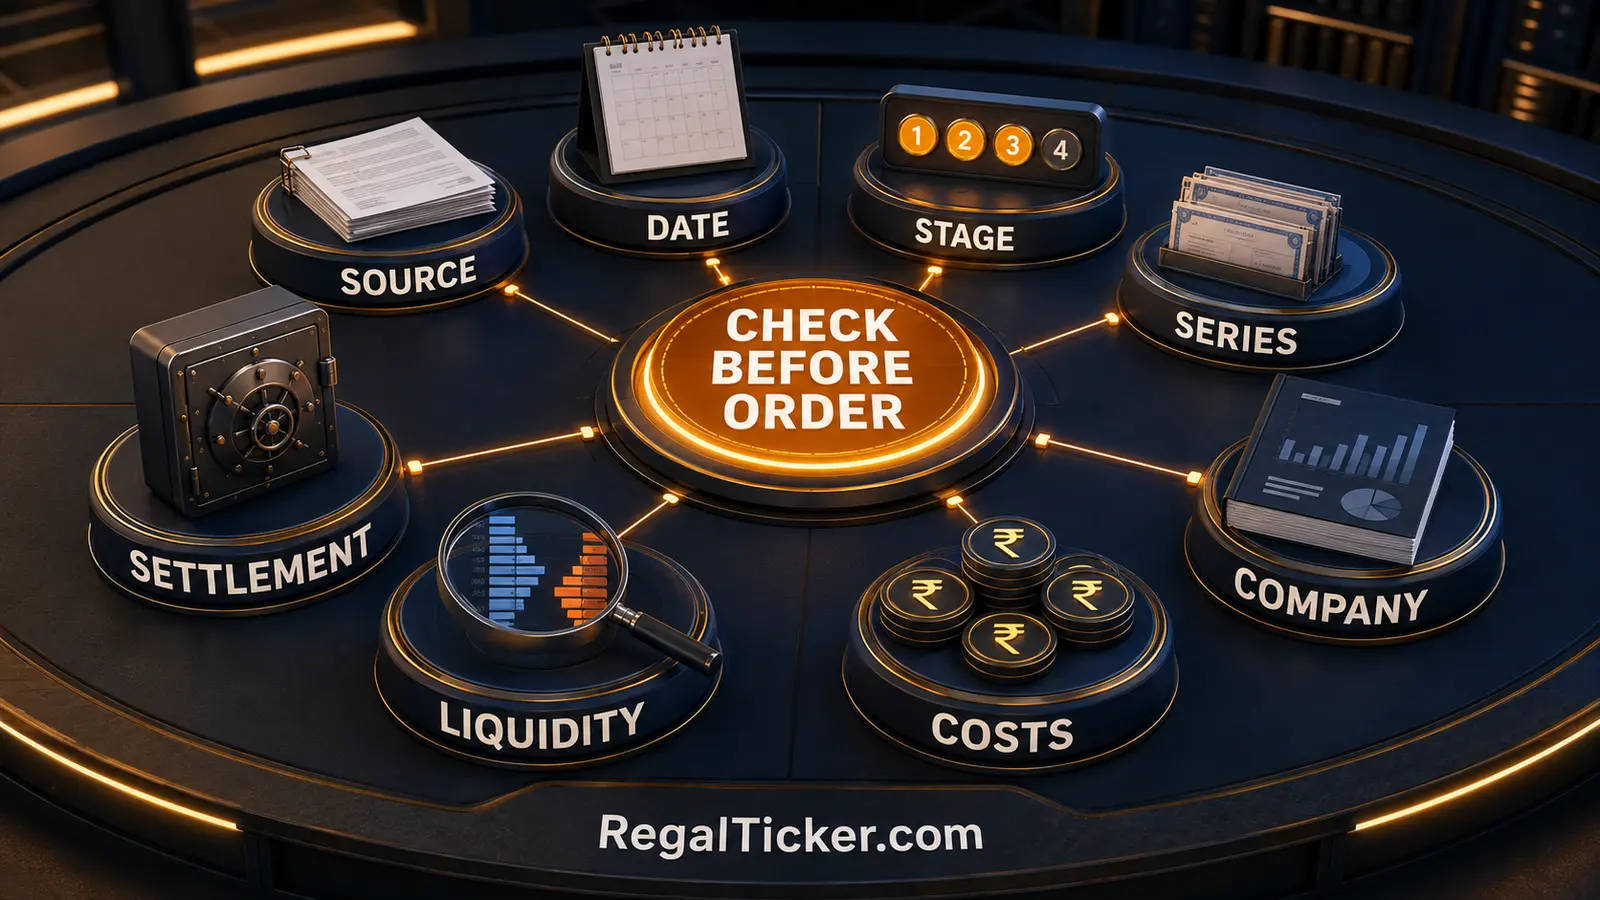
Check 1: Identify the Exact Security
Confirm the company name, symbol, ISIN where available, exchange and series. Similar names and symbols can cause costly errors. A screenshot without these identifiers is insufficient.
Check 2: Open the Official Current List
Use the exchange’s current ASM, GSM or T2T page. Do not rely on a search-result snippet if a new circular may have changed the stage. Save the publication and effective dates in your notes.
Check 3: Read the Framework and Stage Together
“GSM stock” is not a complete answer. Stage I, II, III and IV impose different restrictions. “ASM stock” also requires the long-term or short-term distinction and the stage or applicable action.
Check 4: Confirm Series and Settlement
If NSE shows BE series, understand that settlement is trade-to-trade and no netting is allowed. Confirm settled shares before selling. Do not use an intraday assumption merely because the order window looks familiar.
Check 5: Confirm Trading Day and Price Band
At higher GSM stages, trading may be allowed only once a week. A narrow band can prevent execution. Note both constraints before treating a stop-loss, target or expected holding period as actionable.
Check 6: Calculate All Cash Required
Separate these items:
- trade value;
- applicable margin;
- ASD;
- brokerage and statutory charges;
- tax estimate;
- emergency cash reserve;
- opportunity cost of blocked funds.
Use the Brokerage Calculator for costs and the Risk-Reward Calculator for your planned downside and upside. The broker’s “funds required” figure should be confirmed before order submission.
Check 7: Research the Company Separately
Open financial statements, auditor reports, shareholding patterns, pledge disclosures, board announcements and material events. A surveillance label can coexist with a fundamentally strong or weak business; it is not a substitute for analysis.
Compare quarterly ownership through Promoter Holding and Pledged Shares. If a large transaction is part of the story, read Bulk Deal vs Block Deal. A deal disclosure and a surveillance label answer different questions.
Check 8: Define Exit Feasibility, Not Just Exit Price
An investor may say, “I will sell at ₹90,” but the real questions are: will trading be open, will the price be permitted, will buyers exist and will settled shares be deliverable? Liquidity risk can dominate the price calculation.
If those conditions are uncertain, reduce position size or avoid the trade. The Stock Average Calculator should record executed purchases, not planned averages. Repeatedly averaging down in an illiquid surveillance stock can enlarge a position that remains difficult to exit.
Risks, Misconceptions and a Worked Decision Example
The central risk is not the label alone. It is the combination of volatile price behaviour, limited liquidity, higher cash commitment, delivery obligations, information gaps and investor overconfidence.
Misconception 1: “ASM Means the Company Is Guilty”
Wrong. NSE states that ASM shortlisting is a market-surveillance action and not an adverse action against the company. The correct conclusion is “extra caution and due diligence are required.”
Misconception 2: “GSM Stage I and Stage IV Are Similar”
Wrong. The current stages become progressively restrictive. Weekly trading, ASD and no upward movement materially change liquidity and capital use.
Misconception 3: “T2T Means I Can Safely Buy and Sell the Same Day”
Wrong. T2T does not allow netting. A buy and sell create separate settlement obligations. Broker restrictions may prevent intraday orders altogether.
Misconception 4: “A 5% Band Limits My Maximum Loss to 5%”
Wrong. It limits the permitted move for one session under the applicable reference and band framework. Repeated lower-band sessions can compound losses, and an investor may be unable to exit.
Misconception 5: “Full Margin Means Low Risk”
Wrong. Full funding reduces leverage but does not improve company quality, liquidity or future price. The investor can still lose a large part of the capital.
Misconception 6: “Removal From the List Is a Buy Signal”
Wrong. Removal means the security no longer meets the applicable surveillance or review condition at that point. It is not a valuation opinion or earnings forecast.
Worked Decision Example
Assume a security is quoted at ₹64, is under GSM Stage II and requires T2T settlement plus a 50% ASD. An investor considers buying 1,000 shares.
Trade value = ₹64 × 1,000 = ₹64,000
Illustrative 50% ASD = ₹64,000 × 50% = ₹32,000
Before ordinary charges, the investor must understand that ₹64,000 is the economic purchase value while ₹32,000 is an additional blocked deposit under the stated illustration. They serve different accounting purposes.
Now suppose the planned downside price is ₹50 and target is ₹78:
Planned price risk = (₹64 − ₹50) × 1,000 = ₹14,000
Planned price reward = (₹78 − ₹64) × 1,000 = ₹14,000
The simple reward-to-risk ratio is 1:1 before charges, tax and execution risk. But the target may not be reachable within the band structure, and the stop may not execute if sell orders queue. Therefore, 1:1 is not the complete decision.
Use the Risk-Reward Calculator for the price scenario, the Brokerage Calculator for charges, the Stock Return Calculator after execution, and the Capital Gains Tax Calculator for an estimate based on the realised result. Then add a qualitative liquidity test that no calculator can solve: could the order actually exit under the current stage?
Do Not Average Down Automatically
If the security falls to ₹56, buying another 1,000 shares would lower the weighted average to ₹60 before charges:
Average price = [(1,000 × ₹64) + (1,000 × ₹56)] ÷ 2,000 = ₹60
The arithmetic is correct, but the position doubles to 2,000 shares and ₹120,000 of purchase value. Liquidity and ASD requirements may also enlarge. Use the Stock Average Calculator to understand the number, then decide from risk capacity—not from the emotional comfort of a lower average.
Use All 19 Regal Ticker Calculators With Surveillance Stocks
Calculators solve the investor’s arithmetic. They do not predict ASM/GSM movement, override T2T settlement or guarantee order execution. The most relevant tools here are risk-reward, brokerage, stock average, stock return, XIRR and capital-gains tax. Corporate-action tools prevent mechanical share-count changes from being misread, while planning tools keep one speculative idea from taking over a long-term plan.
Trade, Cost, Return and Risk Calculators
| Investor question | Calculator | Correct use |
|---|---|---|
| What is my weighted price after settled purchases? | Stock Average Calculator | Combine executed quantities and prices; do not treat a lower average as lower liquidity risk. |
| What was my realised holding result? | Stock Return Calculator | Include purchase, sale, quantity and income after verified adjustments. |
| What annualised rate connects one start and one end value? | CAGR Calculator | Use for a multi-year lump-sum result, not irregular deposits or ASD cash flows. |
| What return applies to dated irregular cash flows? | XIRR Calculator | Record multiple buys, sells, dividends and other dated cash flows. |
| What dividend income and yield did the holding produce? | Dividend Calculator | Add declared income without calling a high yield proof of safety. |
| What is planned reward relative to downside? | Risk-Reward Calculator | Test entry, invalidation and target, then separately test whether exit is feasible. |
| What transaction charges may apply? | Brokerage Calculator | Estimate costs and break-even using the intended delivery trade. |
| What may the capital-gains tax be? | Capital Gains Tax Calculator | Estimate tax from the realised gain and holding-period inputs after checking current law. |
A disciplined sequence is to test downside with the Risk-Reward Calculator, estimate charges with the Brokerage Calculator, record only completed purchases in the Stock Average Calculator, then measure the realised result through the Stock Return Calculator. Use the XIRR Calculator if cash flows occur on several dates and the CAGR Calculator only when its start-to-end structure fits.
Corporate-Action Calculators
| Event | Calculator | Why it matters beside surveillance data |
|---|---|---|
| Bonus issue | Bonus Share Calculator | Adjust quantity and reference price before interpreting a screen change. |
| Stock split | Stock Split Calculator | Separate a face-value and quantity adjustment from economic gain. |
| Rights issue | Rights Issue Calculator | Model entitlement and theoretical ex-rights price from official terms. |
| Tender buyback | Buyback Acceptance Ratio Calculator | Model tender assumptions without predicting acceptance or surveillance status. |
| Bonus/split adjusted performance | Bonus & Split Adjusted Return Calculator | Preserve comparable economic return across quantity changes. |
| Demerger | Demerger Cost Basis Calculator | Allocate original cost after official cost-allocation guidance is published. |
Use official ratios and dates. Run the Bonus Share Calculator or Stock Split Calculator before calling an adjusted price a crash. Use the Rights Issue Calculator only from official issue terms, the Buyback Acceptance Ratio Calculator for tender scenarios, and the Demerger Cost Basis Calculator after the company provides the cost split. Then use the Bonus & Split Adjusted Return Calculator where relevant.
Long-Term Planning Calculators
| Planning question | Calculator | Role when a surveillance stock attracts attention |
|---|---|---|
| What may periodic investing grow to? | SIP Calculator | Keep diversified long-term contributions separate from one restricted security. |
| What monthly contribution may target a future goal? | Goal SIP Calculator | Protect goal planning from speculative position changes. |
| What may one lump-sum investment grow to? | Lumpsum Calculator | Compare long-term compounding assumptions without treating them as guarantees. |
| How may withdrawals affect a corpus? | SWP Calculator | Test withdrawal durability; do not depend on an illiquid stock for scheduled cash needs. |
The SIP Calculator, Goal SIP Calculator, Lumpsum Calculator and SWP Calculator keep goals and cash flows visible. A high-risk, restricted or illiquid security should not be the assumed source for a time-sensitive goal or withdrawal.
Explore the complete Regal Ticker Investor Tools hub when your arithmetic changes. First verify the official surveillance status; then select a tool for cost, return, tax, corporate action or planning. Never use a calculator result as permission to ignore an exchange warning.
ASM GSM and T2T Stocks FAQs and Final Takeaway
What is the meaning of ASM stocks?
ASM stocks are securities shortlisted under the Additional Surveillance Measure framework using objective market parameters such as price or volume variation, volatility, concentration and related criteria. The framework applies enhanced controls and alerts investors to exercise caution. Inclusion is not automatically an adverse finding against the company.
What is the meaning of GSM stocks?
GSM stocks are securities under the Graded Surveillance Measure framework. Restrictions become stronger by stage. Under the current NSE framework, the four stages can involve 100% margin, a 5% or lower price band, T2T settlement, ASD, weekly trading and no upward movement.
What is a T2T stock?
A T2T stock is settled on a trade-for-trade basis. On NSE these securities are available under the BE series, and no netting off is allowed. Each trade creates its own delivery and funds obligation.
Is ASM the same as GSM?
No. Both are surveillance frameworks, but their selection, review and stage actions differ. ASM includes long-term and short-term frameworks. GSM applies its own graded stage structure. Always read the current exchange list and stage.
Is every GSM stock also T2T?
Not at every stage. Under the current NSE framework, GSM Stage I begins with 100% margin and a 5% or lower price band. T2T is added from Stage II. Separately, a security can enter T2T through the periodic trade-to-trade review process.
Can I do intraday trading in a T2T stock?
Do not plan intraday trading in a T2T stock. No netting is allowed, and brokers commonly block intraday product types. A buy and sell create separate settlement obligations, which can create delivery and auction risk.
Does ASM or GSM mean fraud?
No. A surveillance label is not proof of fraud. It indicates that specified market-surveillance criteria or framework conditions apply. Investors must separately review company filings, governance, financial statements and regulatory actions.
Does 100% margin mean I cannot lose money?
No. It reduces leverage or requires full funding, but the price can still fall and liquidity can disappear. Margin protects the market mechanism; it does not guarantee the investor’s capital.
What is ASD in GSM?
ASD is Additional Surveillance Deposit. Under current higher GSM stages, buyers deposit a specified percentage of trade value in cash. It is retained and released according to the exchange schedule and cannot be treated as freely available trading capital while blocked.
Why is a GSM stock sometimes traded only once a week?
Weekly trading is one of the stronger graded controls. Under the current NSE framework it applies at Stages III and IV, on Monday or the first trading day of the week. The exchange circular and current stage determine the applicable day.
Where can I check the current ASM, GSM or T2T list?
Use the official NSE or BSE surveillance pages and their latest circulars. Confirm the exchange, symbol, series, framework, stage, publication date and effective date. A broker warning is useful, but the exchange notice is the primary source.
Can a stock leave ASM, GSM or T2T?
Yes, securities are reviewed under the applicable framework and can move between stages or out of a measure. Exit is not automatic on the investor’s preferred date and is not a buy signal. Use the latest exchange circular.
Final Takeaway
ASM GSM and T2T stocks must be understood through framework, stage, series, settlement and date—not through one alarming label. ASM applies enhanced surveillance using objective market data. GSM increases restrictions through graded stages. T2T settles every trade separately without netting. Price bands, margin, ASD and weekly trading are additional controls that can change the investor’s cash requirement and ability to exit.
Before acting, verify the official list, exact stage, series, trading day, price band, settlement obligation and funds required. Then research the company independently and define personal risk. Use the Risk-Reward Calculator, Brokerage Calculator, Stock Average Calculator, Stock Return Calculator, XIRR Calculator and Capital Gains Tax Calculator for your own numbers. Use the exchange for surveillance facts. Never reverse those roles.