
Finding a company with rising sales or a low valuation ratio is easy. Deciding whether its business is understandable, financially healthy, well managed, reasonably valued and capable of surviving future risks is much harder.
That complete investigation is fundamental analysis.
Fundamental analysis does not begin with a stock tip, and it should not end with a single P/E ratio. It connects the company’s business model, industry position, management, financial statements, cash flows, balance sheet, capital efficiency, valuation and risks into one evidence-based view.
This guide provides a practical process for analysing an Indian listed company. You can use it while reading annual reports, investor presentations, exchange filings, earnings calls and financial statements. It is an educational checklist—not a formula that guarantees returns or identifies an automatic buy.
Quick Fundamental Analysis Framework
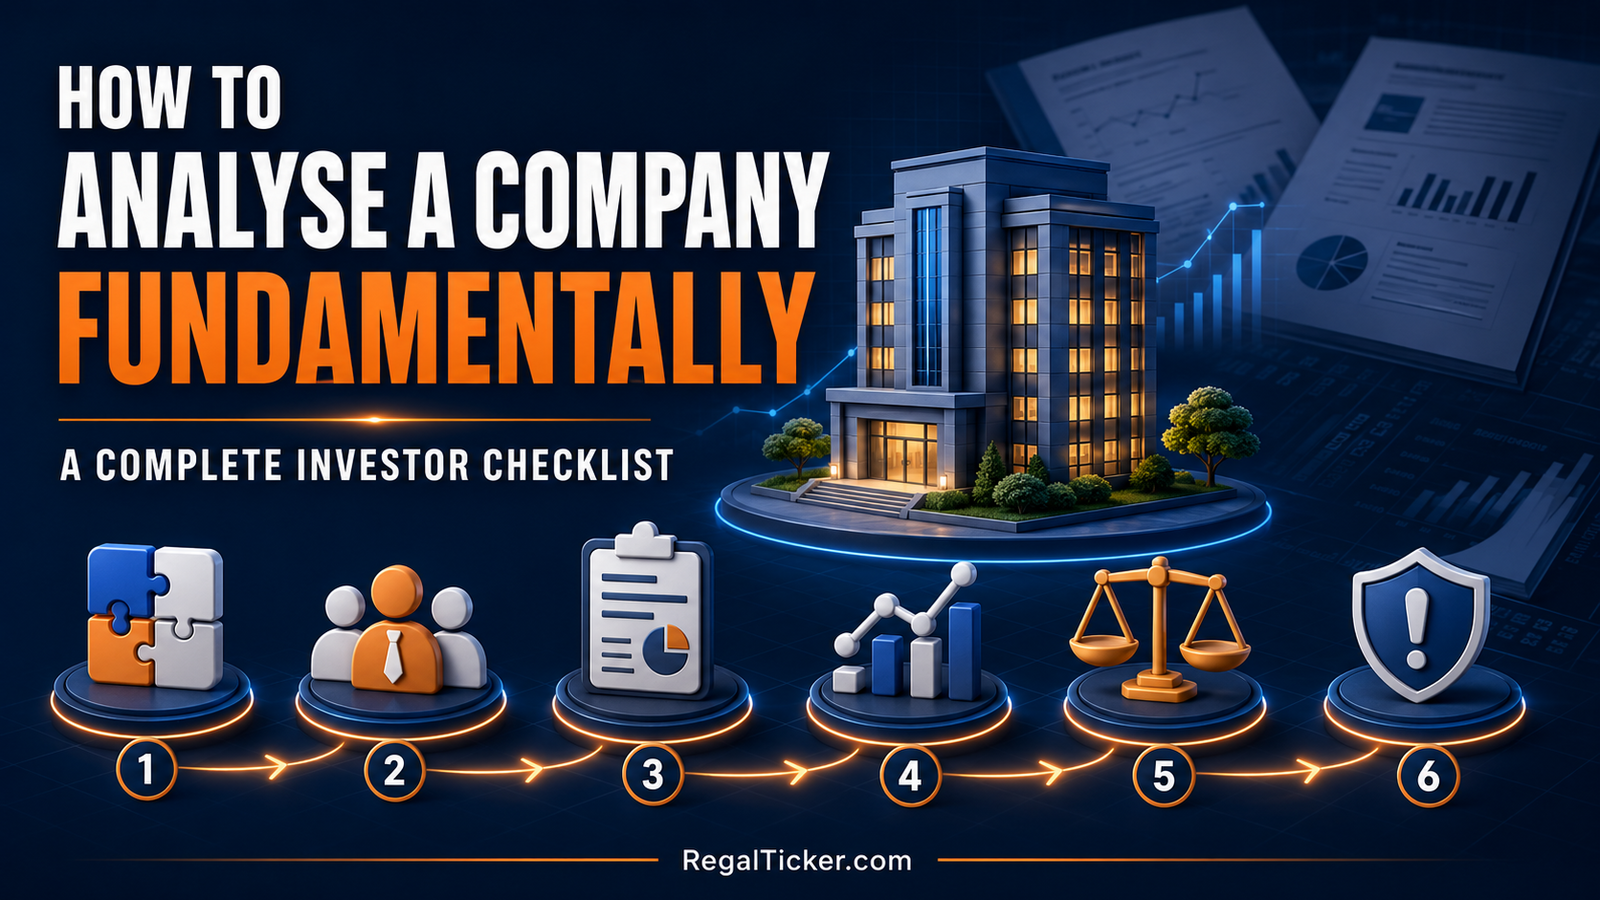
Use the following sequence:
| Stage | Main question | Evidence to examine |
|---|---|---|
| 1. Understand the business | How does the company earn money? | Annual report, segment data, products, customers and revenue model |
| 2. Study the industry | Can the company defend and expand its position? | Market structure, competition, regulation, demand drivers and cyclicality |
| 3. Evaluate management | Does management allocate capital honestly and intelligently? | Track record, disclosures, remuneration, related-party dealings and capital allocation |
| 4. Read the financial statements | Are growth and profit supported by a sound balance sheet and real cash? | Income statement, balance sheet, cash-flow statement and notes |
| 5. Analyse ratios and trends | Is the business improving, weakening or merely benefiting from a cycle? | Margins, returns, leverage, working capital and per-share growth |
| 6. Value the company | What expectations are already reflected in the price? | Suitable valuation multiples, peers, history, growth, quality and risks |
| 7. Record risks and a thesis | What must happen, and what could prove the idea wrong? | Thesis, assumptions, red flags, monitoring triggers and valuation range |
The order matters. If you do not understand how the business makes money, its ratios can look precise while giving you very little insight.
Understand the Business, Industry and Management
Numbers describe what has happened. Business and management analysis help explain why it happened and whether it can continue.
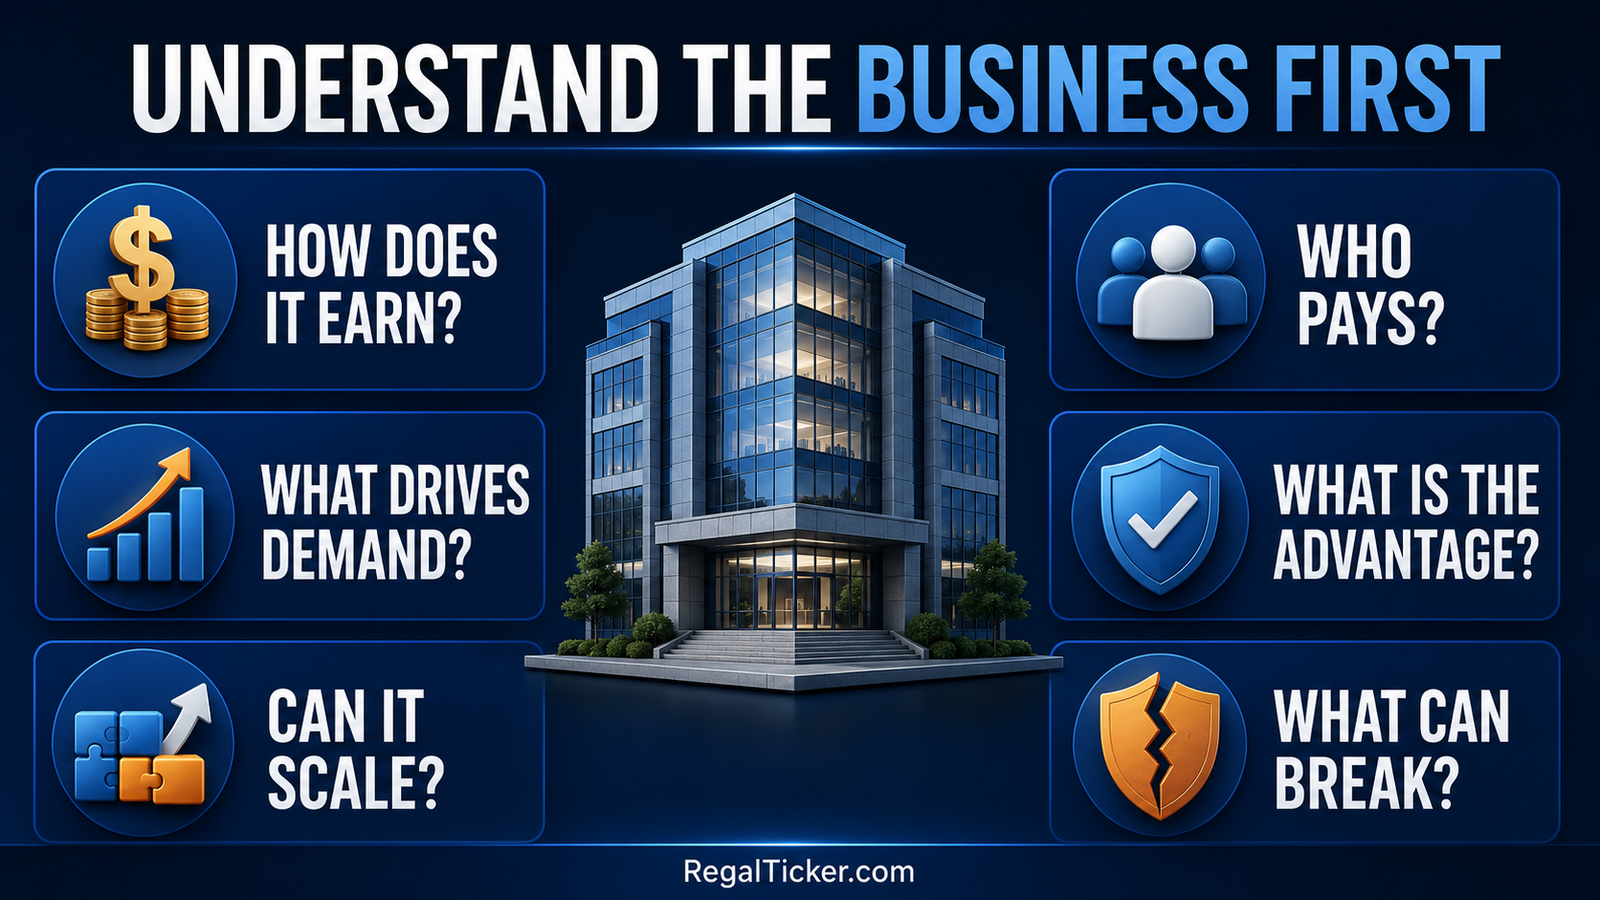
Start with the business model
Write a plain-language answer to these questions:
- What does the company sell?
- Who are its customers?
- Why do customers choose it?
- How does it charge: per product, subscription, commission, interest, licence, project or another model?
- Which products, geographies or customer groups generate most of its revenue and profit?
- What costs are fixed, and which rise with sales?
- Does the company require heavy capital expenditure or working capital to grow?
- What could make its product unnecessary, uncompetitive or regulated?
If you cannot explain the business simply after reading its annual report, either continue researching or place it in the “too difficult” category. Avoid replacing understanding with a high growth rate.
Read What Is Fundamental Analysis? for the difference between studying a business and studying only its market price.
Identify the company’s economic engine
Two companies can report the same revenue growth for very different reasons. Growth may come from:
- Higher selling prices
- Increased sales volume
- New stores, plants or capacity
- Acquisitions
- A temporary commodity-price rise
- Currency movements
- A new product
- Expansion into a new geography
Separate repeatable operating growth from temporary or acquisition-led growth. Ask whether growth is also improving profit per share and cash generation. A company can expand sales while destroying value if it needs excessive debt, continual dilution or uneconomic investment.
Revenue, Profit and Profit Margins Explained shows how to distinguish revenue, operating profit and net profit before interpreting their trends.
Examine industry structure and competitive advantage
A strong company can still struggle in an unattractive industry. Study:
- Market growth and maturity
- Number and strength of competitors
- Customer bargaining power
- Supplier dependence
- Threat of substitutes
- Entry barriers
- Regulation and government policy
- Exposure to interest rates, currency or commodity prices
- Cyclicality and capacity additions
Then ask what allows the company to earn better returns than competitors. Possible advantages include a trusted brand, distribution reach, cost leadership, patents, network effects, customer switching costs, licences, data, efficient operations or scarce assets.
A claimed advantage matters only if evidence supports it. Look for sustained margins, customer retention, market-share stability, pricing power or superior return on capital—not merely promotional language.
Evaluate management and governance
Management quality cannot be reduced to whether the chief executive gives confident interviews. Assess actions over several years:
- Did management meet important operational promises?
- Were acquisitions sensible, and did they create value?
- Is debt used prudently?
- Are new shares issued repeatedly without proportional per-share growth?
- Are dividends and buybacks consistent with the company’s opportunities and finances?
- Is executive remuneration reasonable relative to performance?
- Are related-party transactions clearly disclosed and commercially sensible?
- Does management discuss failures as clearly as successes?
- Are accounting policies or business targets changed frequently?
Promoter ownership can align interests, but ownership alone does not prove good governance. Review promoter pledging, auditor changes, regulatory actions, contingent liabilities, related-party dealings and transactions between the listed company and promoter-controlled entities.
Useful primary documents include annual reports, exchange announcements, shareholding patterns, earnings-call transcripts, credit-rating rationales and statutory filings. Prefer original disclosures over social-media summaries.
Test Financial Quality Across All Three Statements
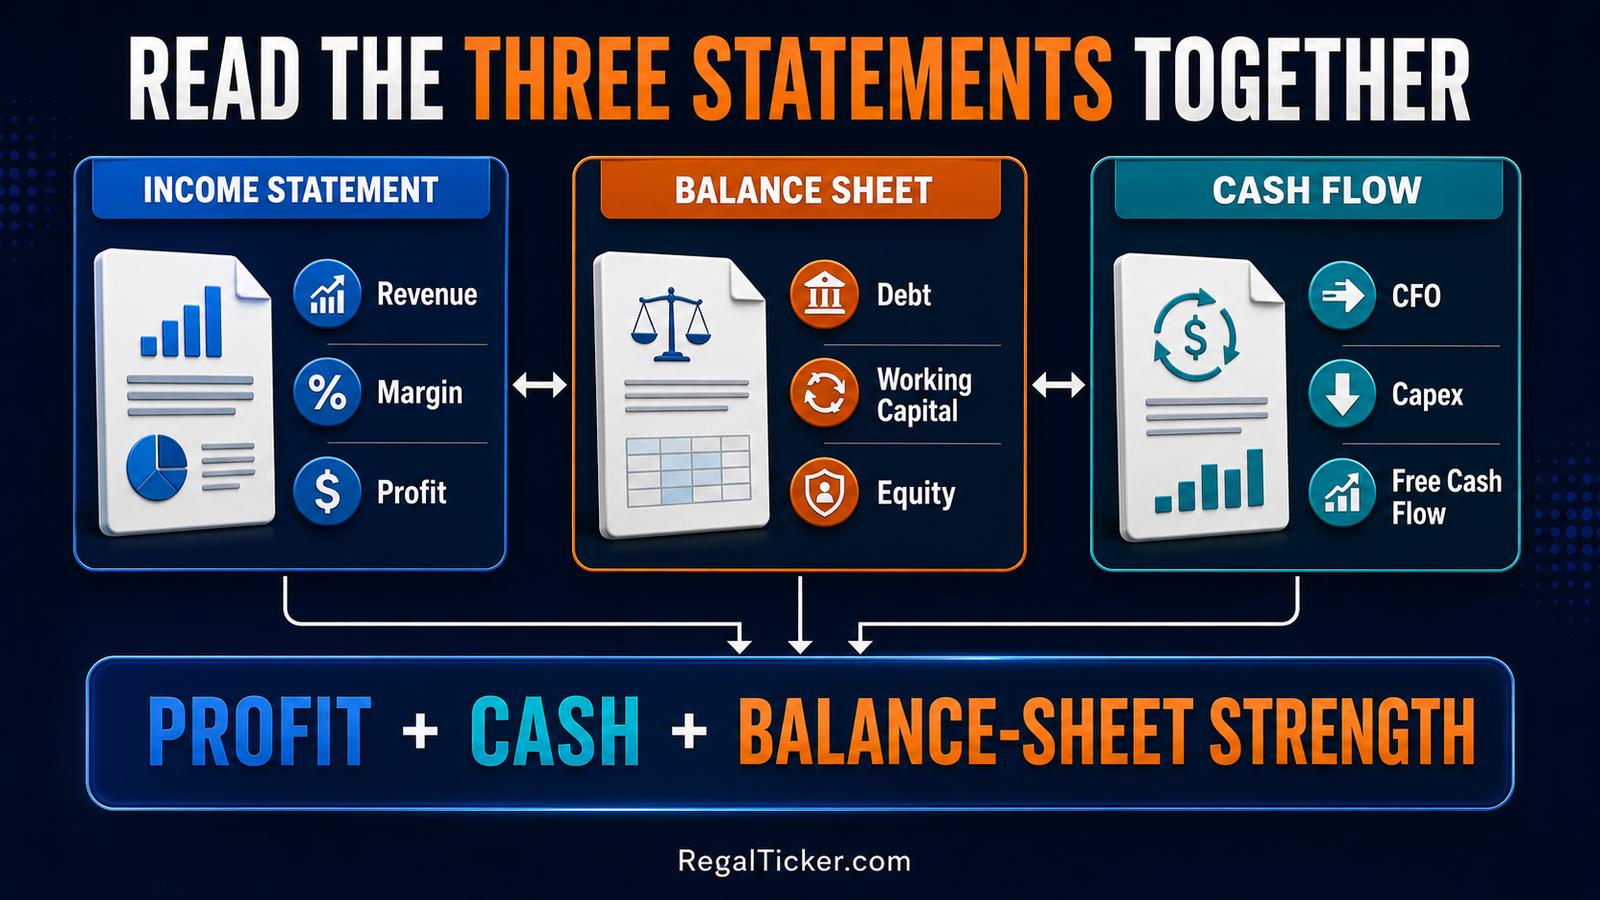
Never analyse the income statement, balance sheet and cash-flow statement in isolation. Profit affects equity, working capital affects cash, borrowing changes interest costs, and capital expenditure connects operating growth with future depreciation.
Read the income statement as a trend
Study at least five years when comparable data are available, and include a full business cycle for cyclical companies.
Check:
- Revenue growth and its drivers
- Gross or operating margin, where applicable
- EBITDA and EBIT trends
- Finance costs
- Tax rate
- Profit after tax
- Earnings per share
- Exceptional and non-recurring items
- Segment-level revenue and profit
Do not focus only on the latest growth percentage. Compare sales, profit and EPS over time. If profit grows much faster than revenue, determine whether the reason is sustainable margin improvement, lower interest, a tax change or a one-time gain.
Use How to Read an Income Statement to examine expenses, operating profit, finance costs, tax and exceptional items properly.
Inspect balance-sheet strength
The balance sheet reveals what the company owns, what it owes and how the business is financed.
Study:
- Cash and liquid investments
- Trade receivables and their ageing
- Inventory and obsolescence risk
- Property, plant and equipment
- Goodwill and other intangible assets
- Short-term and long-term borrowings
- Lease liabilities
- Trade payables
- Provisions and contingent liabilities
- Shareholders’ equity
Debt is not automatically bad. Its risk depends on cash-flow stability, interest coverage, repayment dates, currency exposure and the returns generated from borrowed capital.
Rapid receivable or inventory growth can be an early warning. If these items repeatedly rise faster than sales, reported profit may not be converting into cash efficiently.
How to Read a Balance Sheet explains assets, liabilities, equity, working capital and balance-sheet red flags in detail.
Reconcile profit with cash flow
Net profit is calculated using accrual accounting; it is not the same as cash received.
Check:
- Cash flow from operating activities, or CFO
- Net profit
- Working-capital changes
- Capital expenditure
- Borrowing and repayment
- Dividends and buybacks
- Acquisitions
- Free cash flow
A useful basic calculation is:
Free cash flow = Cash flow from operations − Capital expenditure
One weak cash-flow year may reflect expansion or a temporary working-capital movement. Persistent profit without operating cash deserves investigation.
Also distinguish growth capital expenditure from the spending needed to maintain existing operations. Management estimates may help, but they should be tested against the company’s asset age, capacity and historical spending.
Read How to Read a Cash Flow Statement before treating EBITDA or accounting profit as freely available cash.
Connect the statements and inspect the notes
Financial-statement notes often contain the information that headline tables hide:
- Revenue-recognition policy
- Receivable ageing
- Inventory valuation
- Debt terms
- Capital commitments
- Contingent liabilities
- Related-party transactions
- Segment details
- Share-based payments
- Acquisitions and goodwill
- Changes in accounting estimates
The auditor’s report should also be read. Pay attention to modified opinions, emphasis-of-matter paragraphs, key audit matters and weaknesses in internal financial controls.
How the Three Financial Statements Are Connected shows how profit, retained earnings, working capital, capital expenditure, debt and ending cash move between the statements.
Use ratios as questions, not verdicts
| Area | Useful measures | Question to ask |
|---|---|---|
| Growth | Revenue, profit and EPS growth | Is growth consistent, per-share and supported by cash? |
| Profitability | Operating margin and net margin | Are margins durable or temporarily inflated? |
| Returns | ROE and ROCE | Does the company use shareholder and total capital efficiently? |
| Leverage | Debt-to-equity and interest coverage | Can cash generation support debt through a downturn? |
| Working capital | Receivable days, inventory days and payable days | Is growth consuming increasing cash? |
| Cash quality | CFO to profit and free cash flow | Does accounting profit convert into cash over time? |
No universal ratio threshold fits every sector. Banks, insurers, manufacturers, retailers, software businesses and infrastructure companies have different economics. Compare a company with relevant peers and with its own history.
ROE, ROCE and Debt-to-Equity Ratio Explained covers return and leverage ratios without treating any one number as a pass–fail test.
Compare Valuation with Growth, Quality and Risk
A good business can be a poor investment at an unrealistic price. A low-priced business can remain cheap because its economics are deteriorating.
Valuation asks: What expectations are already embedded in the market price?
Choose measures that fit the business
Common measures include:
| Valuation measure | Often useful for | Important limitation |
|---|---|---|
| P/E | Profitable businesses with meaningful earnings | Distorted by one-time profit, cyclicality or negative earnings |
| PEG | Relating P/E to an earnings-growth estimate | Highly sensitive to uncertain future growth |
| P/B | Banks and some asset-heavy businesses | Book value may not reflect asset quality or intangible value |
| EV/EBITDA | Comparing operating businesses with different debt | Ignores capital expenditure, tax and working-capital needs |
| Free-cash-flow yield | Mature cash-generating businesses | Cash flow can be volatile and depends on capex classification |
| Dividend yield | Income-oriented mature businesses | A high yield may be unsustainable |
Use EPS, P/E Ratio and PEG Ratio Explained for earnings-based valuation. Book Value, P/B Ratio, Enterprise Value and EV/EBITDA Explained covers equity-value and whole-business multiples.
Compare like with like
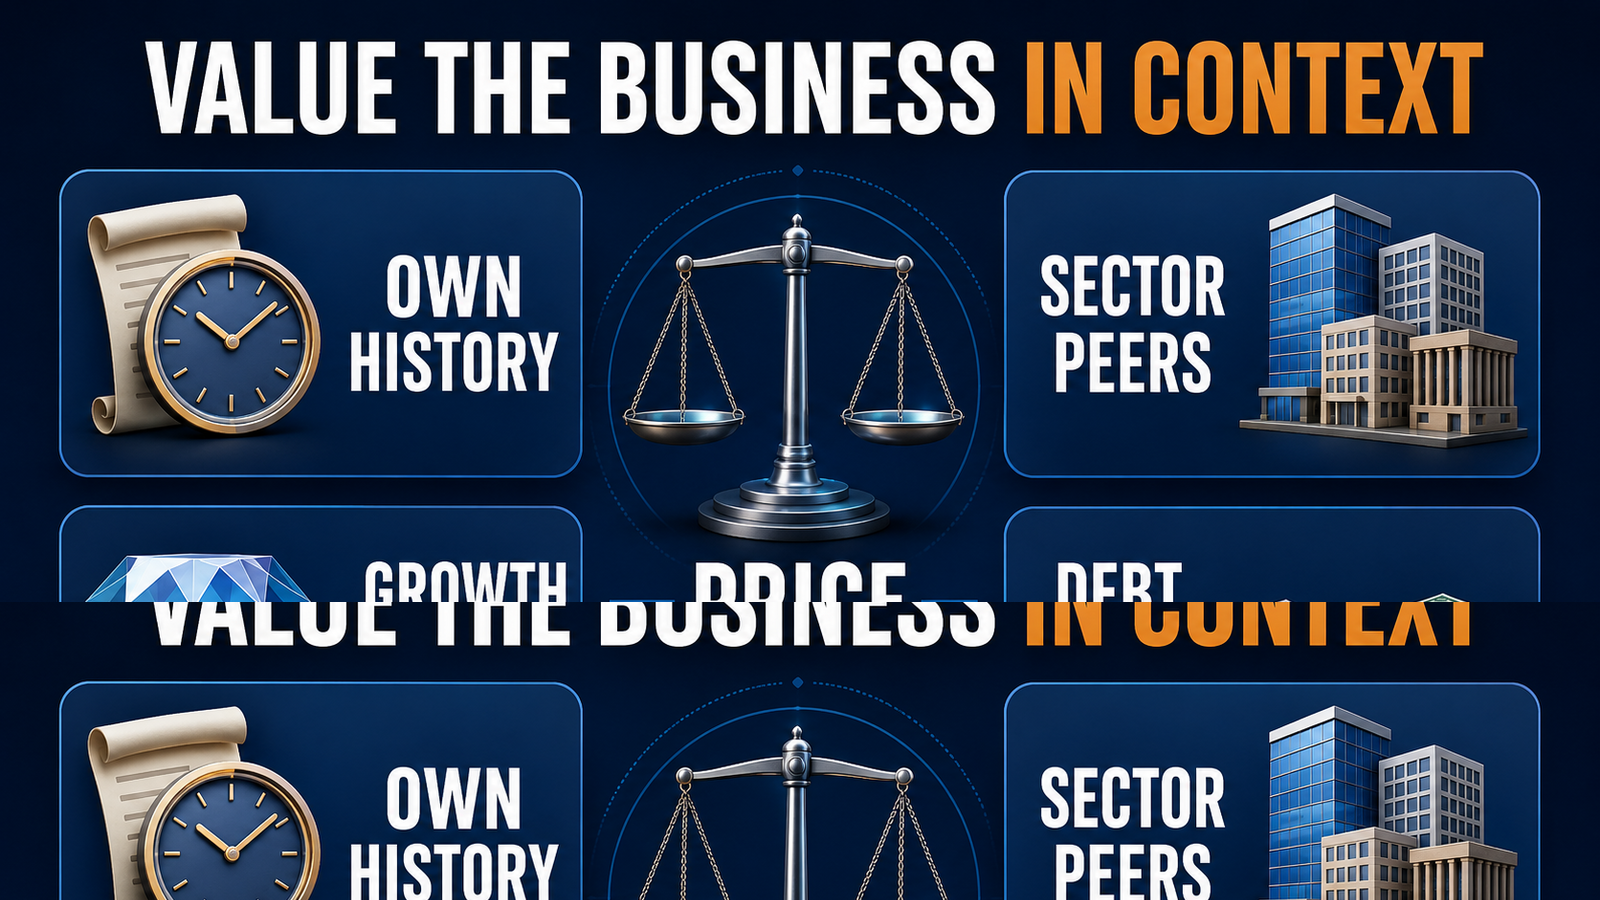
A valuation becomes more informative when compared with:
- The company’s own historical range
- Peers with similar business models
- Growth and margin prospects
- ROE and ROCE
- Debt and cash
- Cyclicality
- Accounting quality
- Regulatory and governance risk
Peer comparison requires care. A company with higher margins, lower debt and more durable growth may deserve a higher multiple. A temporary earnings peak can make a cyclical company’s P/E look deceptively low.
Use more than one scenario
Instead of relying on one forecast, write at least three:
- Base case: the most reasonable operating outcome
- Optimistic case: stronger growth or margins, with evidence required
- Cautious case: slower demand, margin pressure or higher capital needs
For each scenario, record revenue drivers, margins, reinvestment, debt, share count and a suitable valuation range. The purpose is not to predict the exact future price. It is to expose which assumptions control your conclusion.
Remember that share prices are decided by changing supply, demand and expectations in the market. Fundamental value is an estimate, not a quoted fact.
Identify Red Flags, Risks and Evidence Gaps
Risk analysis should happen before the investment decision, not after the share price falls.
Financial and accounting red flags
Investigate:
- Profit rising while operating cash flow remains weak
- Receivables or inventory repeatedly growing faster than sales
- Frequent exceptional gains
- Capitalised costs increasing aggressively
- Large unexplained changes in accounting policies
- High debt with weak interest coverage
- Significant contingent liabilities
- Repeated equity dilution
- Auditor resignation or qualified opinion
- Complex subsidiaries and related-party transactions
A red flag is a request for more evidence, not always proof of wrongdoing. Read the notes, compare several years and seek a credible explanation.
Business and industry risks
Consider:
- Dependence on one product, customer, supplier or geography
- Technological disruption
- Regulatory change
- Commodity, currency or interest-rate exposure
- Price competition
- New capacity across the industry
- Environmental or legal liabilities
- Key-person dependence
- Weak customer retention
- A business model that requires continual external funding
Separate temporary volatility from risks that can permanently impair the business.
Management and governance risks
Warning signs may include vague disclosures, frequently missed targets, unrelated diversification, questionable acquisitions, excessive promoter pledging, unusual related-party transactions, large remuneration despite weak results or a pattern of blaming every disappointment on external factors.
Also record what you do not know. An evidence gap should reduce confidence instead of being filled with an optimistic assumption.
Worked Example: Applying the Checklist
Assume Sample Components Ltd. is a fictional manufacturer. The example is simplified and is not an investment recommendation.
Business and industry evidence
The company supplies specialised components to several industrial customers. Demand is linked to capital expenditure, so the business is cyclical. It has no single customer above 15% of revenue, but one imported raw material creates currency risk.
The initial conclusion is mixed: customer concentration is manageable, while cyclicality and raw-material dependence require monitoring.
Five-year financial evidence
| Item | Year 1 | Year 5 | Initial interpretation |
|---|---|---|---|
| Revenue | ₹1,000 crore | ₹1,610 crore | About 10% annualised growth |
| Operating margin | 12% | 15% | Improved, but durability must be tested |
| Net profit | ₹60 crore | ₹120 crore | Grew faster than revenue |
| Operating cash flow | ₹55 crore | ₹105 crore | Broadly supports profit |
| Debt | ₹300 crore | ₹180 crore | Leverage reduced |
| Outstanding shares | 10 crore | 10 crore | No dilution in this period |
| ROCE | 13% | 19% | Capital efficiency improved |
These numbers deserve further investigation; they do not complete the analysis. The investor should determine whether margin improvement came from operational efficiency, favourable raw-material prices or a temporary industry shortage.
Cash conversion is reasonably close to profit, but receivable days, maintenance capital expenditure and debt maturities still need checking.
Valuation and thesis
Suppose the company trades above its own long-term average P/E and above two slower-growing peers. The premium may be justified if higher ROCE and margins are sustainable. It may be risky if current earnings represent a cyclical peak.
A concise thesis could be:
> The company may compound earnings if specialised-product growth and operating efficiency sustain higher returns while debt continues to decline.
Evidence that would support the thesis:
- Stable or rising market share
- Healthy order conversion
- Operating margin remaining within a normalised range
- Operating cash flow tracking profit
- ROCE remaining healthy without large acquisitions
Evidence that could break it:
- Margin normalisation below the assumed range
- Receivables rising sharply
- Debt-funded unrelated acquisition
- Loss of a major product approval
- New industry capacity causing sustained price pressure
This written structure is more useful than saying, “The stock has a low ratio” or “management is good.”
Final Company Analysis Checklist
Use this shorter sheet after completing the detailed research.
Business and industry
- can explain how the company earns money in plain language.
- understand its main products, customers, segments and geographies.
- know the major demand drivers and cost drivers.
- understand the industry cycle, competition and regulation.
- can identify evidence of any competitive advantage.
Management and governance
- reviewed management’s track record, not only its guidance.
- checked promoter holding and pledging.
- reviewed remuneration, related-party transactions and capital allocation.
- checked auditor comments, regulatory actions and important disclosures.
- understand how management uses debt, dividends, buybacks and acquisitions.
Financial quality
- reviewed at least five years where comparable information is available.
- separated operating growth from acquisitions and one-time items.
- compared revenue, profit and EPS.
- checked margins, ROE, ROCE and leverage in context.
- compared operating cash flow with profit.
- reviewed working capital, capital expenditure and free cash flow.
- read important notes and the auditor’s report.
- checked whether the share count has changed.
Valuation and decision
- selected valuation measures appropriate for the sector.
- compared valuation with peers and the company’s history.
- considered growth, quality, debt, cash and cyclicality.
- wrote base, optimistic and cautious scenarios.
- listed the main risks and evidence gaps.
- wrote a thesis in one or two sentences.
- recorded what would prove or break the thesis.
- know what information I will monitor after the decision.
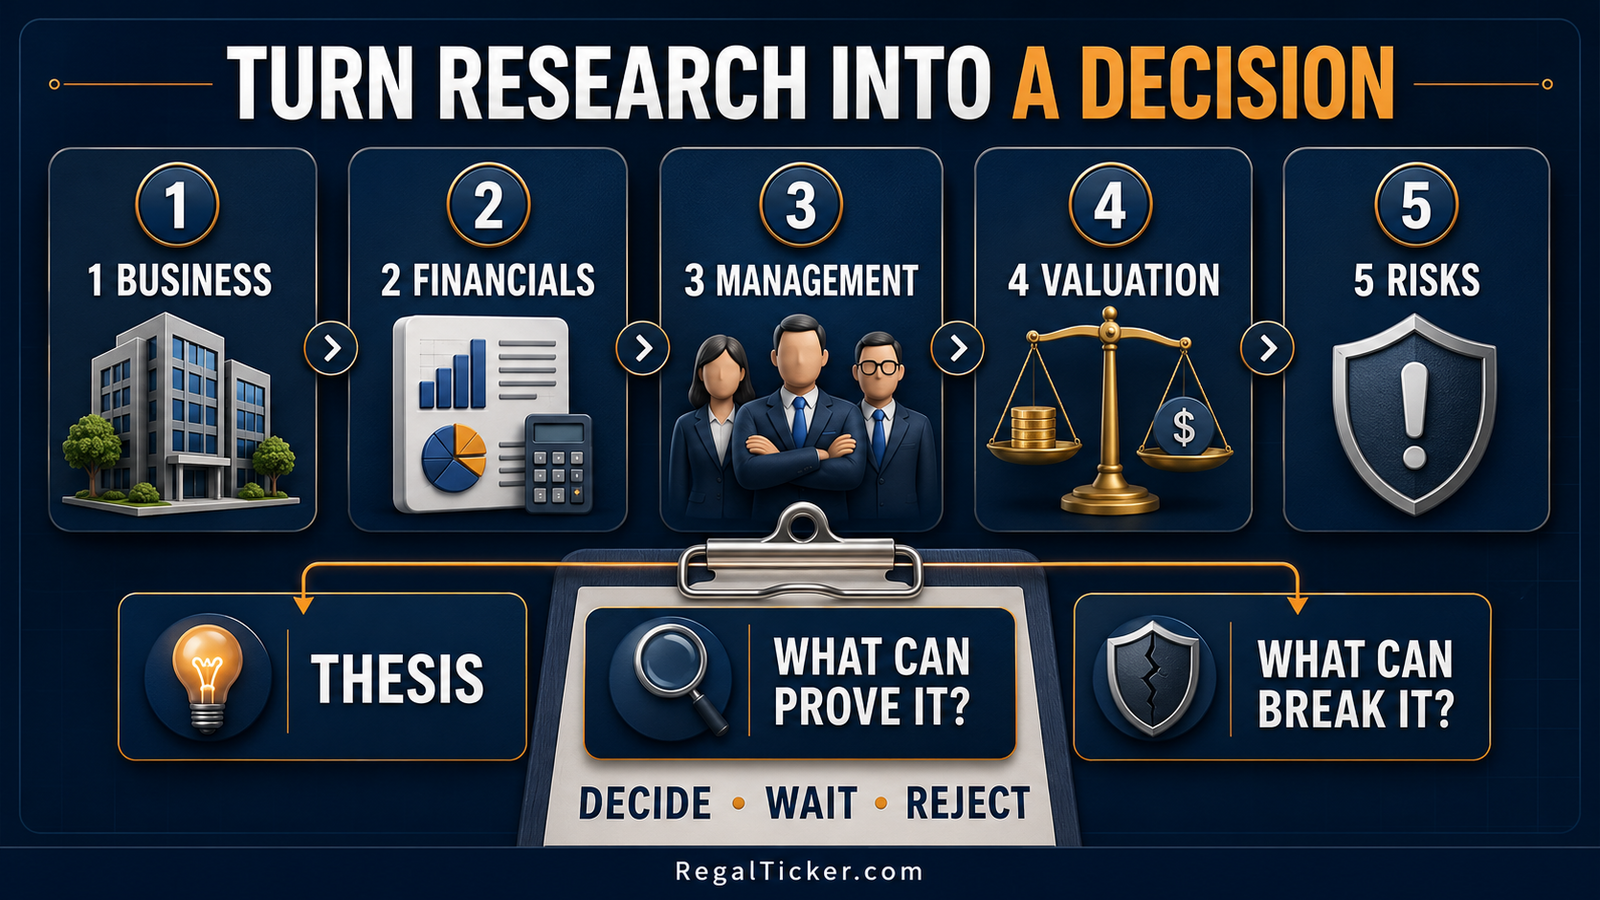
The checklist has three valid outcomes: proceed for deeper decision-making, wait for better evidence or valuation, or reject the idea. Time already spent researching is not a reason to invest.
The Investor Tools hub can support calculations, but a calculator cannot judge management quality, accounting choices, competitive advantage or risk. Tools organise evidence; they do not replace thought.
Frequently Asked Questions
How do beginners analyse a company fundamentally?
Begin with the annual report and explain the business in plain language. Then study its industry, management, income statement, balance sheet and cash flow across several years. Analyse returns, debt and cash conversion, compare a suitable valuation with peers and history, and finish with a written thesis and risks.
How many years of financial data should I check?
Five years is a useful starting point when comparable data are available. Ten years can reveal more about cyclicality and capital allocation. For a recently listed or transformed company, the available period may be shorter, so confidence should be adjusted.
Which ratio is best for fundamental analysis?
No single ratio is best. P/E, P/B, EV/EBITDA, ROE, ROCE, debt-to-equity and free cash flow answer different questions. Their relevance depends on the sector, accounting structure, business maturity and purpose of the comparison.
Is a low P/E stock fundamentally strong?
Not necessarily. A low P/E may reflect temporary peak earnings, weak future growth, high risk, poor governance, debt or a declining business. Analyse earnings quality and sustainability before interpreting the multiple.
Where can I find company information in India?
Start with the company’s investor-relations page and its filings on the recognised stock exchanges. Useful documents include annual and quarterly results, annual reports, shareholding patterns, corporate announcements, earnings-call material and credit-rating rationales. Use primary disclosures whenever possible.
Can fundamental analysis predict the future share price?
No. It helps investors form a reasoned estimate of business quality, financial strength and valuation under stated assumptions. Unexpected events, changing expectations and market behaviour can still produce very different outcomes.
Is fundamental analysis only for long-term investors?
It is most closely associated with long-term investing, but knowledge of financial health and business events can help other market participants too. Investing vs Trading explains why the time horizon, evidence and risk process differ.
Final Takeaway
Complete fundamental analysis is a chain of evidence:
Business understanding → Industry position → Management quality → Financial statements → Ratios and cash flow → Valuation → Risks → Written thesis
Do not let a strong story excuse weak cash flow. Do not let one low ratio excuse poor governance. Do not let a premium valuation pass without testing the growth and quality required to support it.
The objective is not to eliminate uncertainty. It is to identify the assumptions you are making, demand evidence for them and know what would prove you wrong.
This completes the Fundamental Analysis learning sequence. You can now use Lessons 1–9 as focused references and this final checklist as the repeatable process that connects them.
Official references: SEBI Investor—Due Diligence and NSE Financial Statement Analysis.