
Absolute return vs CAGR vs XIRR is not a contest in which one formula is always best. Each measure answers a different question. Absolute return shows the overall percentage gain or loss. CAGR converts the growth between one beginning value and one ending value into a smooth annualised rate. XIRR calculates an annualised rate when money enters or leaves on different dates. Total return adds relevant income, such as dividends, to the change in value.
Suppose ₹1,00,000 becomes ₹1,30,000. The absolute return is 30%. But that statement is incomplete until you know whether the change took six months, three years or ten years. If the investment involved several SIP instalments, a single CAGR calculated from total contributions can be misleading because every rupee was not invested for the same period. If the asset paid dividends, price change alone can understate the investor’s economic return.
The right sequence is therefore:
- Identify every cash flow.
- Record the correct dates.
- Decide whether income and costs are included.
- Select the measure that matches the cash-flow pattern.
- Compare like with like.
This third lesson in the Market Terminology learning hub builds on Stock Market Terminology: 50 Essential Terms and Face Value, Book Value and Market Value. It focuses on return language because investors often quote impressive percentages without stating the period, cash flows, income, costs or risk behind them.
Absolute Return vs CAGR vs XIRR: Quick Comparison
The simplest way to choose a measure is to examine the cash-flow pattern.
| Return measure | Main question answered | Best suited to | Time-aware? | Handles multiple dated cash flows? |
|---|---|---|---|---|
| Absolute return | How much did the value change overall? | One holding-period gain or loss | No | No |
| CAGR | What constant annual rate connects one start value and one end value? | One investment with no intermediate external cash flows | Yes | No |
| XIRR | What annualised rate fits all actual cash flows and dates? | SIPs, staggered purchases, withdrawals and irregular investments | Yes | Yes |
| Total return | What was earned from price change plus included income? | Stocks, funds or indices where dividends/distributions matter | Only if separately annualised | Depends on calculation method |
One-Minute Selection Rule
- Use absolute return when you need the total percentage change for a stated holding period.
- Use CAGR when there is one starting amount, one ending amount and a period longer than a year.
- Use XIRR when there are several investments, withdrawals or distributions on different dates.
- Use total return when price change alone would omit dividends or other included cash income.
These labels can overlap. A total return can be reported as an absolute total return for a short period, a CAGR over several years or an XIRR for an investor’s actual dated cash flows. “Total” describes what is included; “CAGR” and “XIRR” describe how the rate is calculated.
Why the Period Must Always Be Stated
A 30% absolute return in six months and a 30% absolute return in ten years are economically different. The same percentage does not imply the same pace of wealth creation.
Likewise, a 12% CAGR for five years is not the same statement as a 12% absolute return over five years. The first is an annualised compounded rate; the second is the entire five-year change.
Before comparing any two return figures, check:
- the start and end dates;
- whether the figure is absolute or annualised;
- whether dividends are included;
- whether contributions and withdrawals are included;
- whether the return is before or after costs and taxes; and
- whether the benchmark uses a price-return or total-return version.
What Is Absolute Return?
Absolute return is the percentage change in value over the full measurement period. It does not convert the result into an annual rate.
For a simple investment with no income or intermediate cash flow:
Absolute return = (Ending value − Beginning value) ÷ Beginning value × 100
If ₹1,00,000 becomes ₹1,30,000:
Absolute return = (₹1,30,000 − ₹1,00,000) ÷ ₹1,00,000 × 100 = 30%
The gain is ₹30,000 and the absolute return is 30%. The formula does not care whether this happened in four months or four years. The holding period must be stated separately.

Absolute Price Return vs Absolute Total Return
For a share, price return considers only the change in market price:
Price return = (Selling price − Purchase price) ÷ Purchase price × 100
If a share rises from ₹200 to ₹230, the price return is 15%.
If the investor also receives ₹8 per share in dividends and the calculation intentionally includes that income:
Gross total return = (₹230 − ₹200 + ₹8) ÷ ₹200 × 100 = 19%
The price return is 15%, while the gross total return is 19%. Brokerage, statutory charges, taxes and dividend reinvestment are not yet reflected in this simplified example.
Use the Stock Return Calculator when you want to combine purchase price, sale/current price, quantity and dividend income. Use the Dividend Calculator when the question is specifically dividend amount or yield.
When Absolute Return Is Useful
Absolute return is useful for:
- a short holding period;
- a simple trade result;
- a clearly dated one-time investment;
- communicating the total gain or loss; and
- checking the output of a more advanced return calculation.
It is easy to understand, which makes it valuable. Its weakness is not that it is wrong; its weakness is that it ignores the speed at which the return occurred.
When Absolute Return Can Mislead
Absolute return can mislead when:
- two investments have different holding periods;
- money was added or withdrawn during the period;
- dividends or distributions are omitted;
- a stock split or bonus issue makes the raw share price look lower;
- costs and taxes materially reduce the amount retained; or
- the percentage is presented without the start and end dates.
For a trade, estimate execution costs with the Brokerage Calculator. For a simplified tax estimate, use the Capital Gains Tax Calculator. A pre-cost return and a post-cost return answer different questions and should never be presented as though they are identical.
What Is CAGR?
CAGR means compound annual growth rate. It is the constant annual rate that would connect one beginning value with one ending value over a stated number of years, assuming compounding.
CAGR = (Ending value ÷ Beginning value)^(1 ÷ Number of years) − 1
Suppose ₹1,00,000 grows to ₹1,60,000 in four years:
CAGR = (₹1,60,000 ÷ ₹1,00,000)^(1 ÷ 4) − 1
CAGR = 1.6^0.25 − 1 ≈ 12.47%
This does not mean the investment earned exactly 12.47% in every calendar year. It means that a hypothetical steady 12.47% compounded rate would produce the same start-to-end change.

CAGR Smooths the Path
An investment can move like this:
- Year 1: +28%
- Year 2: −15%
- Year 3: +22%
- Year 4: +18%
Its CAGR may still be around one smooth annual rate. CAGR hides the year-by-year volatility, sequence of returns and drawdowns. That smoothing is useful for comparison, but it must not be mistaken for the actual journey.
The CAGR Calculator is the correct tool for one beginning value, one ending value and a known time period. It is especially useful for comparing long-term growth in a stock, portfolio, revenue, profit, book value or another quantity.
CAGR Is a Geometric Rate, Not an Arithmetic Average
Suppose an investment rises 50% in Year 1 and falls 50% in Year 2.
- Starting value: ₹100
- After +50%: ₹150
- After −50%: ₹75
The arithmetic average of +50% and −50% is 0%, but the investment has lost 25% overall. Its two-year CAGR is approximately −13.40%, not 0%.
Percent gains and losses apply to different bases. That is why compounding requires geometric mathematics.
When CAGR Is Appropriate
CAGR works well when:
- there is one starting value;
- there is one ending value;
- the time period is known;
- no external cash is added or removed; and
- the comparison uses the same return basis.
For a one-time mutual-fund or portfolio projection, the Lumpsum Calculator shows how a single amount may grow at an assumed rate. The assumed rate is only an illustration; market returns are not fixed or guaranteed. SEBI’s investor calculators make the same limitation clear.
When CAGR Is the Wrong Tool
CAGR is normally the wrong tool for:
- monthly SIP instalments;
- several stock purchases on different dates;
- partial redemptions;
- an SWP with recurring withdrawals;
- cash dividends taken out on different dates; or
- any cash-flow stream where each rupee has a different holding period.
Adding all contributions, treating the sum as though it was invested on day one and calculating CAGR can distort the result. In those cases, XIRR is designed for the actual dates.
What Is XIRR?
XIRR is the extended internal rate of return. It finds one annualised rate that makes the present value of all dated cash inflows and outflows balance.
In simplified notation, XIRR solves for r in:
Σ [Cash flow ÷ (1 + r)^(Days from first cash flow ÷ 365)] = 0
Cash paid into an investment is normally entered as negative. Cash received from withdrawals, dividends or the final value is normally entered as positive. At least one negative and one positive cash flow are required for a meaningful calculation.
Why Dates Change the Answer
Consider these fictional cash flows:
| Date | Cash flow | Meaning |
|---|---|---|
| 1 January 2022 | −₹1,00,000 | Initial investment |
| 1 July 2022 | −₹50,000 | Additional investment |
| 15 March 2023 | −₹30,000 | Additional investment |
| 1 January 2025 | +₹2,45,000 | Final redemption value |
Total contributions are ₹1,80,000 and total money received is ₹2,45,000. The simple gain is ₹65,000, or 36.11% on total contributions.
However, the full ₹1,80,000 was not invested for three years. The second and third amounts arrived later. Using the actual dates, the XIRR is approximately 12.21% per year.
If someone incorrectly treated ₹1,80,000 as invested on 1 January 2022 and calculated a three-year CAGR to ₹2,45,000, the result would be approximately 10.82%. The difference exists because that shortcut gives later contributions too much time.
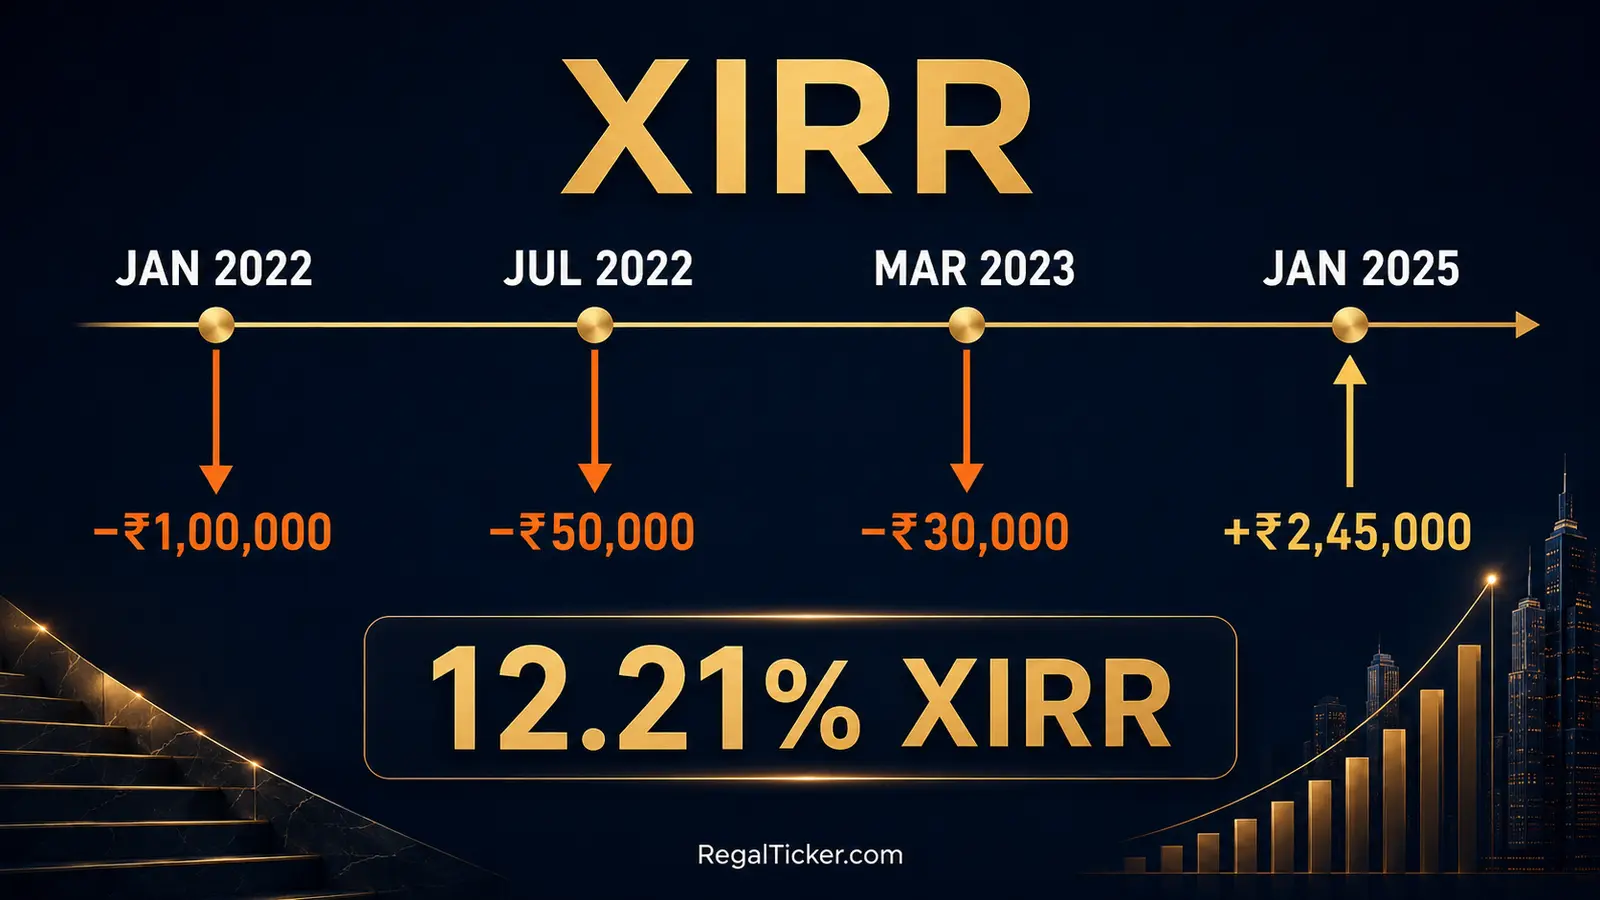
Use the XIRR Calculator for irregular investments, staggered stock purchases, SIPs with missing instalments, redemptions and other dated cash flows.
XIRR for SIP Investments
A SIP creates multiple investments. The first instalment remains invested longer than the last one, so the total contribution is not a single beginning amount.
Use the SIP Calculator to project the future value of regular contributions at an assumed return. Use the XIRR calculator to measure the annualised return actually achieved from dated contributions and the current or redemption value.
For goal planning, the Goal SIP Calculator works backwards from a target corpus, time period and assumed return to an estimated contribution. It does not replace XIRR for measuring realised performance.
XIRR for Withdrawals and Income
XIRR can also include:
- partial redemptions;
- irregular dividends taken as cash;
- recurring withdrawals;
- additional purchases; and
- a final portfolio value on the measurement date.
The SWP Calculator can illustrate how withdrawals may affect a corpus under an assumed return. XIRR answers a separate historical question: what annualised return is consistent with the actual dated cash flows?
XIRR Limitations
XIRR is powerful, but it can fail or confuse when:
- a cash flow has the wrong sign;
- dates are missing or incorrect;
- the final portfolio value is omitted;
- there is no positive or no negative cash flow;
- unusual patterns create more than one mathematical solution; or
- the output is presented without explaining the included flows.
The result is only as accurate as the cash-flow record. Reconcile investments, withdrawals, income and the ending value before trusting the percentage.
What Is Total Return?
Total return measures the change in investment value plus the income included in the calculation. For a simple share held through the period:
Total return = (Ending price − Beginning price + Included income) ÷ Beginning price × 100
Included income may be dividends or distributions. The calculation should state whether income is assumed to be reinvested, held as cash or excluded.
Price Return vs Total Return
Using the earlier example:
- Purchase price: ₹200
- Ending or sale price: ₹230
- Dividend received: ₹8
Price return is:
(₹230 − ₹200) ÷ ₹200 × 100 = 15%
Gross total return is:
(₹230 − ₹200 + ₹8) ÷ ₹200 × 100 = 19%
If the dividend was reinvested, the exact end value depends on the reinvestment date and price. For a personal cash-flow calculation, XIRR can include the actual dated dividend or the reinvestment transaction.
NSE Indices explains that a total-return index includes price movement and dividends, with dividends reinvested in the index. This makes a total-return benchmark more comparable with a fund or portfolio return that also includes income than a price-only index would be.
Total Return Does Not Automatically Mean After-Tax Return
“Total” does not mean every economic effect has been included. A gross total return may still exclude:
- brokerage;
- securities transaction tax and other charges;
- capital-gains tax;
- tax treatment of dividend income;
- foreign withholding tax;
- inflation; and
- the investor’s opportunity cost.
Always read the methodology. Use the Brokerage Calculator and Capital Gains Tax Calculator as separate estimation steps when evaluating what may remain after costs and taxes.
Corporate Actions Can Break Raw Price Comparisons
A lower post-action share price does not necessarily mean a loss. Bonus issues and stock splits increase share count while the per-share price adjusts. Rights issues add a subscription decision. Demergers move value into another security. A buyback changes outstanding shares and the investor’s accepted quantity.
Use the calculator that matches the event:
- Bonus Share Calculator for revised quantity and theoretical ex-bonus price.
- Stock Split Calculator for face-value ratio, revised shares and adjusted per-share figures.
- Rights Issue Calculator for entitlement, subscription cost and theoretical ex-rights price.
- Buyback Acceptance Ratio Calculator for estimated accepted shares and remaining holding.
- Bonus & Split Adjusted Return Calculator when a raw before-and-after share price would misstate return.
- Demerger Cost Basis Calculator to allocate original cost between resulting holdings using the chosen supported basis.
Return calculations must follow the economic holding, not merely two unadjusted price quotes.
One Investment, Four Different Answers
Consider a fictional share investment:
- 100 shares purchased at ₹200 on 1 January 2022
- Purchase value: ₹20,000
- Cash dividend received: ₹800 during the holding period
- 100 shares sold at ₹260 on 1 January 2025
- Sale value: ₹26,000
- Holding period: three years
- Costs and taxes excluded for simplicity
Answer 1: Absolute Price Return
(₹26,000 − ₹20,000) ÷ ₹20,000 × 100 = 30%
This measures only the price change.
Answer 2: Absolute Total Return
(₹26,000 − ₹20,000 + ₹800) ÷ ₹20,000 × 100 = 34%
This includes the cash dividend but does not annualise the result.
Answer 3: Price CAGR
(₹26,000 ÷ ₹20,000)^(1 ÷ 3) − 1 ≈ 9.14% per year
This annualises the price-only change.
Answer 4: XIRR Including the Dividend Date
To calculate XIRR, enter:
- the purchase outflow on 1 January 2022 as negative;
- the ₹800 dividend on its actual payment date as positive; and
- the ₹26,000 sale proceeds on 1 January 2025 as positive.
The precise XIRR depends on the dividend date. This is why a single end-value CAGR cannot exactly reproduce a stream containing intermediate cash income unless assumptions are made about timing and reinvestment.
All four answers can be mathematically valid. They are not interchangeable because they include different components and treat time differently.
The Regal Ticker Calculator Playbook
Regal Ticker’s 19 calculators are most useful when they form a connected workflow rather than isolated pages. The table below shows where each tool fits.
| Investor question | Best-matched calculator | What it helps calculate |
|---|---|---|
| What could regular investing grow to? | SIP Calculator | Projected value of recurring contributions |
| How much SIP may be needed for a target? | Goal SIP Calculator | Estimated regular contribution for a goal |
| What could one investment grow to? | Lumpsum Calculator | Future value of a single amount |
| How may withdrawals affect a corpus? | SWP Calculator | Withdrawal schedule and illustrative remaining value |
| What annual rate connects one start and end value? | CAGR Calculator | Compound annual growth rate |
| What annual rate fits dated cash flows? | XIRR Calculator | Annualised return for irregular flows |
| What is the average cost after several purchases? | Stock Average Calculator | Weighted average purchase cost |
| What dividend amount or yield does the holding produce? | Dividend Calculator | Dividend income and yield |
| What is the stock’s gain including selected income? | Stock Return Calculator | Profit and percentage return |
| Is the planned reward proportionate to defined risk? | Risk-Reward Calculator | Risk, reward and ratio before a trade |
| What charges may affect execution? | Brokerage Calculator | Estimated brokerage and trading charges |
| What tax may apply under selected assumptions? | Capital Gains Tax Calculator | Simplified capital-gains tax estimate |
| How do shares and price adjust for a bonus issue? | Bonus Share Calculator | Revised quantity and theoretical price |
| How do shares adjust for a face-value split? | Stock Split Calculator | Split factor, quantity and adjusted per-share values |
| What are entitlement, cost and TERP in a rights issue? | Rights Issue Calculator | Rights entitlement and theoretical ex-rights price |
| How many tendered shares may be accepted? | Buyback Acceptance Ratio Calculator | Estimated acceptance and resulting holding |
| What is return after bonus or split adjustment? | Bonus & Split Adjusted Return Calculator | Economically adjusted holding return |
| How can original cost be allocated after a demerger? | Demerger Cost Basis Calculator | Cost-basis allocation between resulting holdings |
| How many shares may I receive in a merger or amalgamation? | Share Exchange Ratio Calculator | Share entitlement, fractional shares and indicative consideration |
A Practical Calculation Sequence
For a completed stock investment, a disciplined sequence can be:
- Reconstruct purchases with the Stock Average Calculator.
- Adjust quantity and per-share values for relevant corporate actions.
- Add dividends or other included cash income.
- Estimate brokerage and statutory charges.
- Calculate the gross or net stock return.
- Use CAGR for one uninterrupted start-to-end amount or XIRR for dated flows.
- Estimate tax separately under current applicable rules.
- Compare the result with an appropriate total-return benchmark and the risk taken.
The Risk-Reward Calculator is mainly a planning tool, not a historical-performance measure. It belongs before a trade; CAGR or XIRR belongs after a period of investment. Connecting the two helps prevent a high historical return from hiding an undisciplined original risk.
Link the Tool to the Decision, Not Just the Keyword
A calculator is useful only when its inputs match the financial question. Do not use:
- a SIP projection as proof of future returns;
- CAGR for irregular dated contributions;
- XIRR without a final value;
- dividend yield as total return;
- a raw stock-price comparison across a split or bonus issue; or
- a pre-tax return as though it were the final amount retained.

Common Return Mistakes and Risk Blind Spots
Mistake 1: Comparing Absolute Return with CAGR
“Fund A returned 40%” and “Fund B returned 14% CAGR” cannot be compared until the first figure’s period and method are known. Convert both to the same basis.
Mistake 2: Calculating CAGR on Total SIP Contributions
The full contribution was not invested on the first date. Use actual dated instalments and XIRR for realised performance.
Mistake 3: Omitting Dividends
Price return can understate economic return when dividends are material. Compare a total-return portfolio figure with a total-return benchmark.
Mistake 4: Treating CAGR as the Actual Yearly Experience
CAGR smooths the journey. It does not show volatility, maximum drawdown or the order of yearly returns.
Mistake 5: Ignoring Costs and Taxes
Gross return, net-of-cost return and post-tax return are separate figures. State which one you are using.
Mistake 6: Ignoring Inflation
A nominal return shows growth in money terms. Real return adjusts for the loss of purchasing power.
A simplified approximation is:
Real return ≈ [(1 + nominal return) ÷ (1 + inflation rate)] − 1
If nominal return is 10% and inflation is 6%, real return is approximately 3.77%, not 4% exactly.
Mistake 7: Ignoring Risk
Two investments with the same CAGR can have very different volatility, drawdown, liquidity and concentration. Return is only one dimension of an investment outcome.
SEBI’s investor material repeatedly warns that market returns are not fixed or predictable. Calculator projections are illustrations, not promises. Past performance may not continue.
Mistake 8: Using the Wrong Benchmark
An equity portfolio should not be declared successful merely because it beat a savings-account rate. Compare it with a relevant benchmark over the same dates and on the same return basis.
If a fund return includes distributions or assumes reinvestment, a price-only index can make the comparison unfair. A total-return index is usually the more consistent reference.
Mistake 9: Forgetting Corporate-Action Adjustments
A share price falling from ₹1,000 to roughly ₹500 after a 1:1 bonus issue does not represent a 50% economic loss when the investor now owns twice as many shares. Compare the value of the entire adjusted holding.
Mistake 10: Reporting Too Many Decimals
An XIRR of 12.213746% looks precise, but the inputs may include estimated values and rounded dates. A sensible presentation such as 12.21% is normally clearer. Precision in display cannot repair inaccurate data.
Return Checklist and Frequently Asked Questions
Before quoting any return, complete this checklist:
- What is the exact start date?
- What is the exact end date?
- What was invested and on which dates?
- Were there withdrawals or additional purchases?
- Are dividends or distributions included?
- Were corporate actions correctly adjusted?
- Is the result absolute or annualised?
- Is it price return or total return?
- Are costs and taxes included or excluded?
- Is the benchmark measured on the same basis?
- Does the period match the comparison period?
- What risk and drawdown accompanied the return?
What is the main difference between absolute return and CAGR?
Absolute return shows the total percentage gain or loss for the whole period. CAGR converts the growth between one beginning value and one ending value into an equivalent annual compounded rate.
What is the difference between CAGR and XIRR?
CAGR is suitable for one beginning amount and one ending amount with no intermediate external cash flows. XIRR is suitable for multiple investments, withdrawals or income amounts occurring on different dates.
Is XIRR better than CAGR?
Not universally. XIRR is more appropriate for irregular dated cash flows, while CAGR is simpler and correct for one uninterrupted start-to-end investment. The cash-flow pattern decides the tool.
Can CAGR be used for SIP returns?
Using total SIP contributions as though they were invested on the first day can mislead. XIRR is generally more suitable for measuring actual SIP performance because it uses each instalment date.
Is total return the same as CAGR?
No. Total return describes the components included, such as price change plus dividends. CAGR describes how a start-to-end change is annualised. A total return can itself be reported as an absolute return or annualised CAGR.
Does total return include tax?
Not automatically. A gross total return may exclude brokerage, charges and tax. The methodology must explicitly state what is included.
Why is my XIRR calculation giving an error?
Common causes include missing dates, incorrect cash-flow signs, no positive cash flow, no negative cash flow or omission of the final portfolio value. In unusual cash-flow patterns, a stable unique solution may also be difficult to find.
Can CAGR be negative?
Yes. If the ending value is below the beginning value over the measurement period, CAGR will be negative, provided the inputs permit the standard formula.
Should dividends be included in stock return?
Include dividends when calculating total return. Exclude them only when deliberately calculating price return. State the basis clearly so readers know which return is being quoted.
Which calculator should a beginner use first?
For one purchase and one ending value, start with the Stock Return Calculator and CAGR Calculator. For several dated cash flows, use the XIRR Calculator. Use corporate-action, brokerage and tax calculators when those events affect the holding.
Conclusion
The core lesson in absolute return vs CAGR vs XIRR is simple: match the formula to the cash flows.
- Absolute return shows the whole-period change.
- CAGR expresses one start-to-end change as an equivalent annual compounded rate.
- XIRR respects multiple cash flows and their actual dates.
- Total return includes selected income as well as value change.
No percentage is complete without its period, method and inclusions. Before comparing returns, make sure both figures use the same dates, cash-flow treatment, dividend basis, cost basis and benchmark type.
RegalTicker’s calculators support different stages of that process, but they do not turn assumed returns into guarantees. Use them to organise the mathematics, verify the inputs and ask better questions—not to remove market uncertainty.
The next Market Terminology lesson will explain market capitalisation, enterprise value and valuation multiples without repeating the dedicated company-size and fundamental-analysis lessons.
Official References
- SEBI Investor — Financial Calculators
- SEBI Investor — SIP Calculator and Illustration Disclaimer
- SEBI Investor — Future Value Calculator
- AMFI — Reading Fund Performance and Fact Sheets
- NSE Indices — Total Return Index Methodology
Educational disclaimer: This article is for investor education and general information only. It is not investment advice, a research recommendation, an invitation to trade, an offer to buy or sell securities, or a guarantee of returns. Market returns are uncertain. Calculator outputs depend on the assumptions and inputs supplied. Tax rules, transaction charges, corporate-action terms and regulations can change; verify current details through official sources and qualified professionals before acting.