
52 week high and low are two reference prices, not buy and sell signals. The 52-week high is the highest relevant price recorded for a security during a rolling period of roughly one year. The 52-week low is the lowest relevant price in the same moving window. Together, they show the recent trading range and help investors place the current price in historical context.
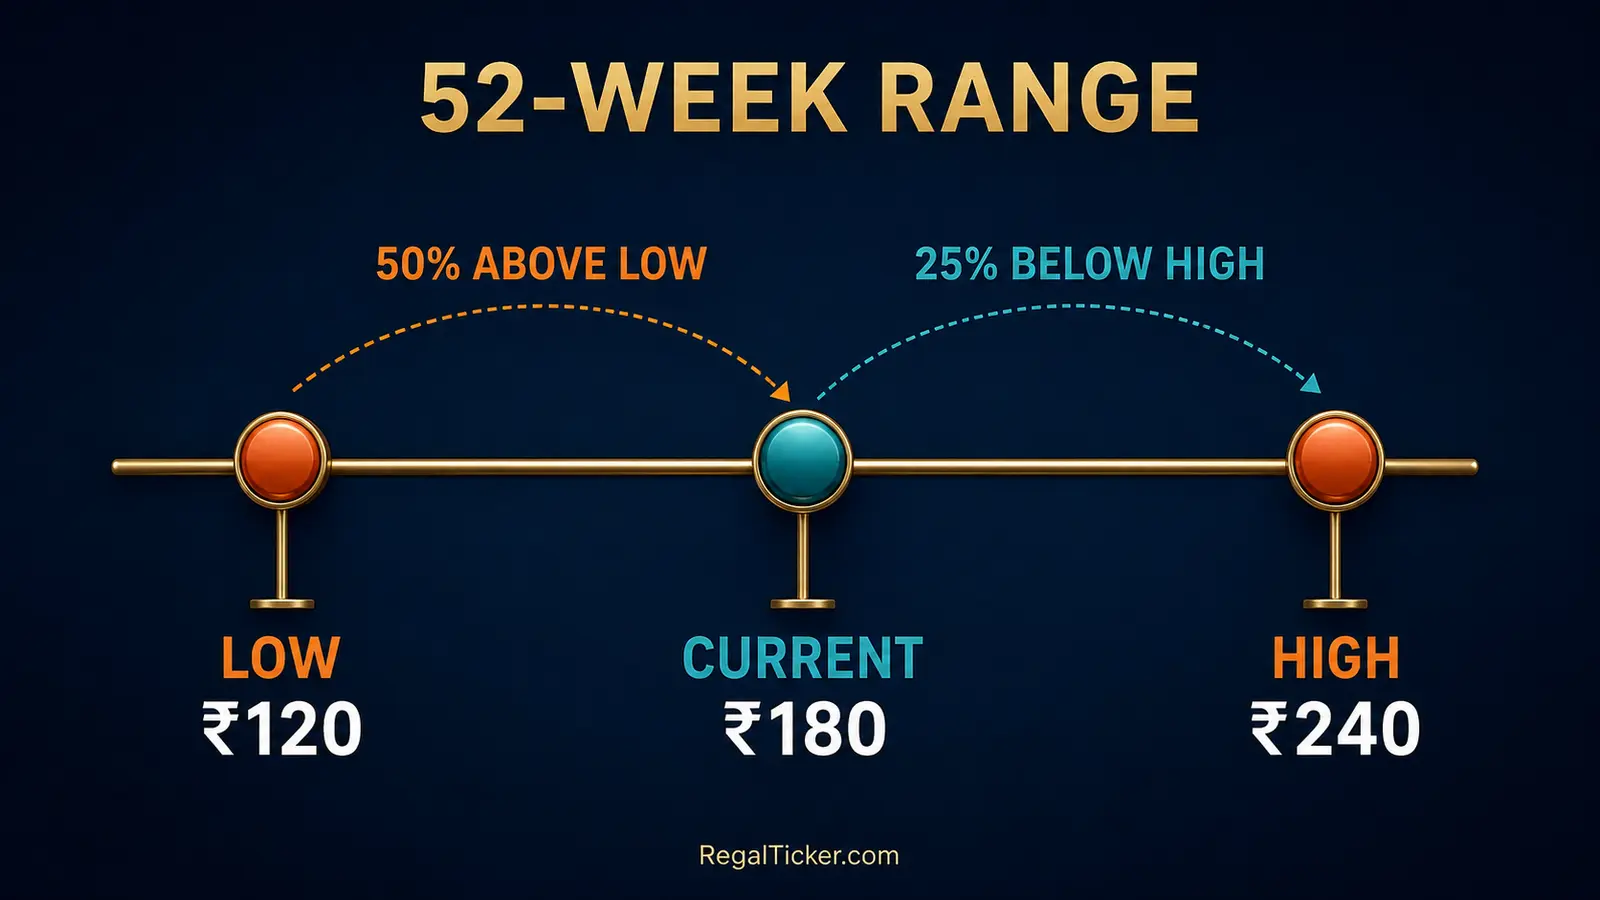
Suppose a fictional share has a 52-week low of ₹120, a current price of ₹180 and a 52-week high of ₹240. The current price sits exactly halfway between the two values in rupee terms. Yet it is 50% above the low and only 25% below the high because those percentages use different starting values. That simple example shows why the range must be calculated carefully rather than read as a visual shortcut.
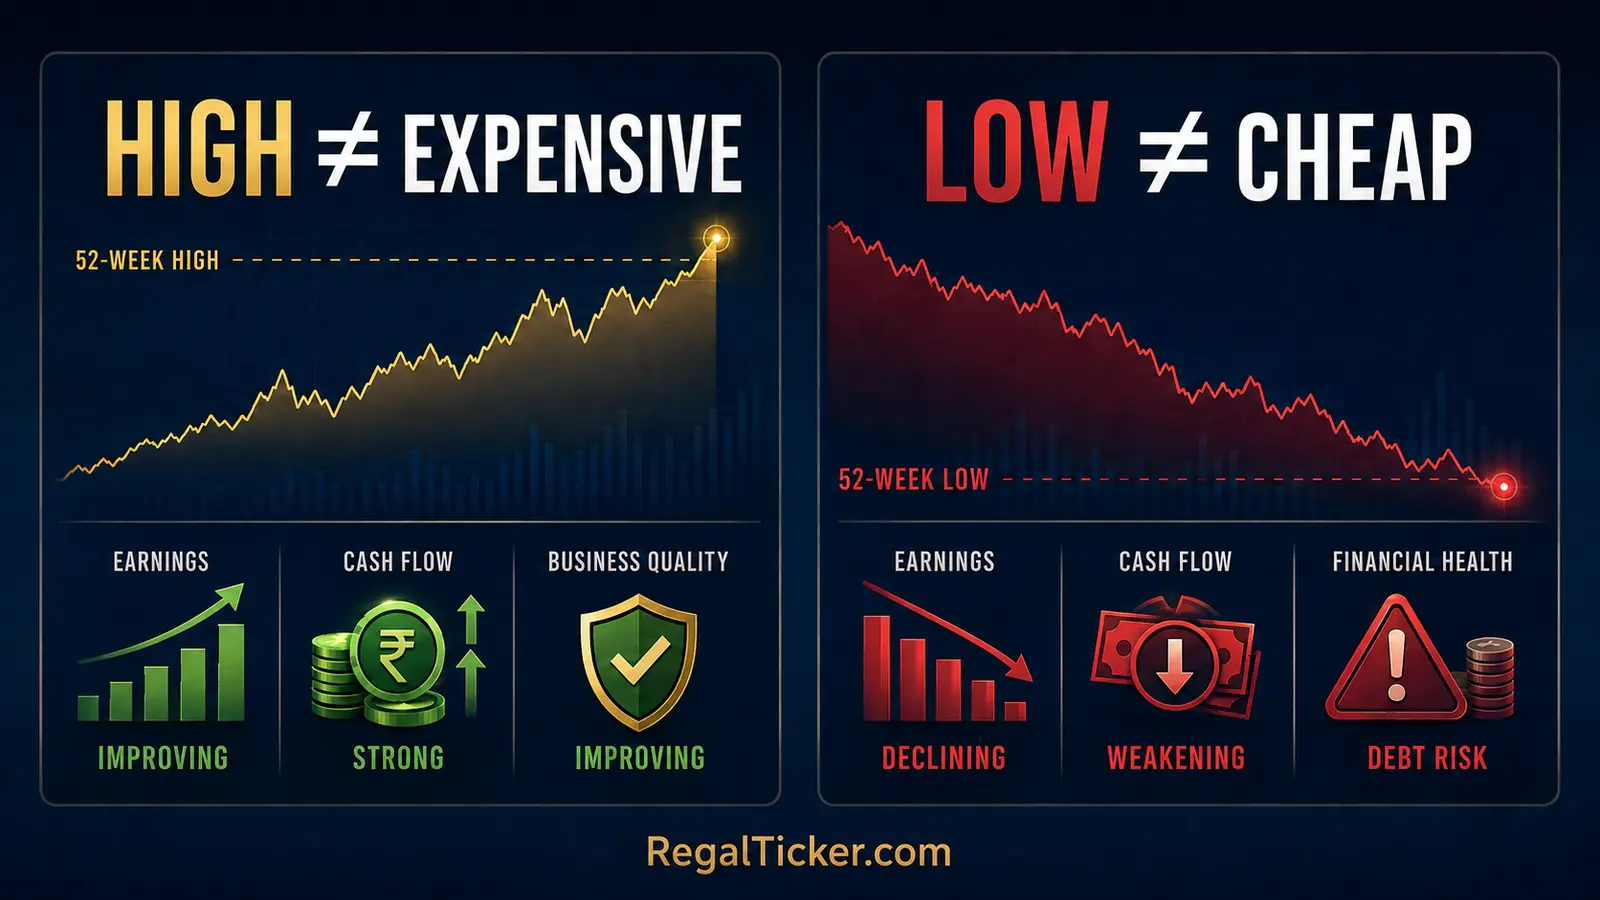
A share near its high is not automatically overpriced. Stronger earnings, improving cash flow or better business prospects may have moved the market’s expectations upward. A share near its low is not automatically a bargain. Falling profits, excessive debt, dilution, governance concerns or a deteriorating industry may explain the decline.
This fourth lesson in the Market Terminology learning hub builds on Stock Market Terminology: 50 Essential Terms, Face Value, Book Value and Market Value and Absolute Return vs CAGR vs XIRR. It explains the range statistic itself. For deeper trend, breakout and valuation analysis, it links to the relevant specialist lessons instead of repeating them.
52 Week High and Low: Quick Meaning
The 52-week high is the highest price reported for a security within the applicable rolling look-back period. The 52-week low is the lowest price reported within that same period. The interval between them is commonly called the 52-week range.
The National Stock Exchange provides a dedicated new 52-week high and low market page, and SEBI’s investor material identifies 52-week high/low alongside open, high, low, close, net change, P/E and dividend information that an investor may see on a stock screen.
What the Range Tells You
The statistic can answer several factual questions:
- What was the highest reported price in the rolling window?
- What was the lowest reported price in that window?
- Is the current price near the top, middle or bottom of its recent range?
- How wide has the recent price range been?
- Has the security just exceeded a previous one-year extreme?
These observations can help organise further analysis. They do not explain why the price moved, whether the business improved, whether the security is fairly valued or what the price will do next.
What the Range Does Not Tell You
The range does not directly reveal:
- intrinsic value;
- earnings quality;
- balance-sheet strength;
- sustainable growth;
- expected future return;
- liquidity at the displayed price;
- the size of a sensible position; or
- whether a breakout or reversal will succeed.
Read How Are Share Prices Decided? to understand the order-driven price-discovery process behind every point in the range. Buyers and sellers create traded prices through the exchange; the 52-week range merely summarises selected extremes from those prices.
High, Low and Range Are Relative Terms
A ₹2,000 share and a ₹40 share can both be at their respective 52-week highs. The nominal share prices cannot be compared directly to decide which business is larger or cheaper. What Is Market Capitalisation? explains why company size depends on price multiplied by outstanding shares, while the earlier lesson on face value, book value and market value separates three other values that beginners often confuse.
The high and low are also relative to a chosen period. A security can be at a 52-week high while remaining below its all-time high. It can be at a 52-week low without being at the lowest price in its entire listed history.
How the Rolling 52-Week Window Works
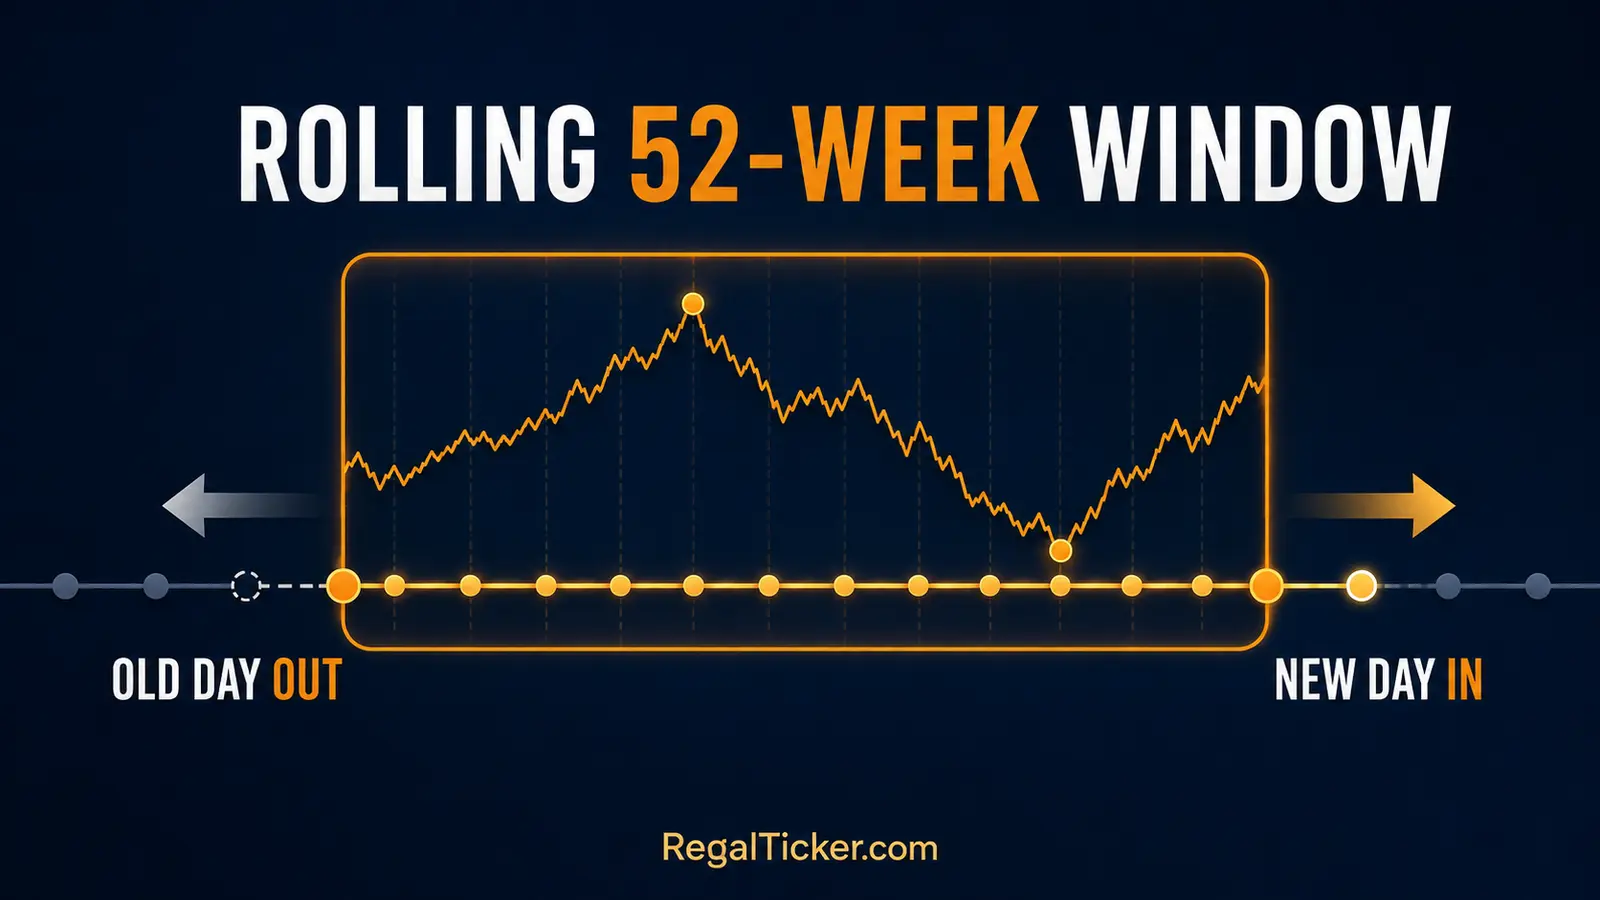
The phrase “52 week” does not mean a fixed January-to-December calendar year. It describes a rolling look-back window that moves forward with time.
On each new trading day:
- the newest price information enters the window;
- the oldest information outside the look-back period drops out;
- the highest remaining relevant value becomes the 52-week high; and
- the lowest remaining relevant value becomes the 52-week low.
This means the displayed high or low can change even when the current price does not set a new extreme.
How an Old High Can Disappear
Suppose the highest price in the existing window was ₹240, recorded on the oldest included day. The share now trades at ₹180. When the ₹240 observation eventually leaves the rolling window, the next-highest remaining observation—perhaps ₹225—can become the new 52-week high.
The displayed high has fallen from ₹240 to ₹225 even though the current share price did not suddenly fall on that day. The reference set changed because an old observation expired.
The same logic applies to a low. If an old ₹100 low leaves the window and the next-lowest remaining price is ₹115, the displayed 52-week low can rise to ₹115 without the current price reaching a new low.
Why 52 Weeks and One Year Are Close but Not Identical Labels
Fifty-two weeks equals 364 days. Markets are also closed on weekends and exchange holidays. Data services may describe the look-back as one year, 52 weeks or a set of trading sessions. The practical lesson is to use the exchange or data provider’s displayed field and methodology consistently rather than manually mixing calendar dates, trading days and unrelated data series.
NSE’s all-reports page provides security-wise monthly, yearly and 52-week high/low reporting. When precise historical analysis matters, use a consistent official dataset and state the observation convention.
Intraday High/Low Versus Closing-Price High/Low
Do not assume that every platform constructs the figure in exactly the same way. A traded-price high may use the highest intraday price reached during the window. A closing-price study uses the highest daily close. These are different statistics.
A share can touch ₹240 during a session but close at ₹232. A traded-price series may record ₹240 as the high, while a closing-price series may not. The difference is not automatically an error; it may be a difference in methodology, adjustment or data timing.
Before comparing two sources, check:
- whether the figure uses intraday extremes or closing prices;
- whether historical values are adjusted for corporate actions;
- whether the current session is complete;
- whether the data is real time, delayed or end of day; and
- whether both sources refer to the same exchange and security series.
How to Calculate and Read the 52-Week Range
The high and low themselves are selected from the relevant historical price series:
52-week high = Maximum relevant price in the rolling window
52-week low = Minimum relevant price in the rolling window
Investors often want three additional measurements: percentage below the high, percentage above the low and position within the full range.
Use this fictional example:
- 52-week low: ₹120
- Current price: ₹180
- 52-week high: ₹240
Percentage Below the 52-Week High
Percentage below high = (52-week high − Current price) ÷ 52-week high × 100
For the example:
(₹240 − ₹180) ÷ ₹240 × 100 = 25%
The current price is 25% below the 52-week high.
Percentage Above the 52-Week Low
Percentage above low = (Current price − 52-week low) ÷ 52-week low × 100
For the example:
(₹180 − ₹120) ÷ ₹120 × 100 = 50%
The current price is 50% above the 52-week low.
The two percentages do not add to 100 because they use different denominators. The first uses ₹240; the second uses ₹120.
Position Within the Range
To show where the current price sits between the two endpoints:
Range position = (Current price − Low) ÷ (High − Low) × 100
For the example:
(₹180 − ₹120) ÷ (₹240 − ₹120) × 100 = 50%
The price is halfway through the rupee range. A range position of 0% corresponds to the low, while 100% corresponds to the high.
This measurement is descriptive. A 90% range position does not mean the share has a 90% probability of rising or falling. It means only that the current price is near the upper end of the chosen range.
Range Width and Asymmetric Recovery Mathematics
The move from ₹120 to ₹240 is a 100% rise:
(₹240 − ₹120) ÷ ₹120 × 100 = 100%
The fall from ₹240 to ₹120 is a 50% decline:
(₹120 − ₹240) ÷ ₹240 × 100 = −50%
The same ₹120 distance produces different percentage changes because the starting bases differ. A 50% decline requires a 100% gain merely to return to the original price.
Use the Stock Return Calculator to measure price or total return for an actual holding. Use the CAGR Calculator when one beginning value, one ending value and a multi-year period need to be annualised. If purchases, sales or receipts occurred on several dates, use the XIRR Calculator. The 52-week range is not a substitute for any of those return measures.
Why Stocks Reach New 52-Week Highs or Lows
A new high or low is the result of actual trading, but the forces behind it can differ greatly.
Business and Earnings Changes
Prices can rise toward new highs when reported profit, revenue, margins, cash generation or guidance improve more than the market expected. Prices can move toward new lows when results weaken, costs rise, cash flow disappoints or management reduces expectations.
The direction alone is not enough. A company can report profit growth and still fall if investors expected faster growth. A company can report weak numbers and still rise if the outcome is less negative than feared.
Valuation Re-Rating
A share can reach a new high because investors are willing to pay a higher valuation multiple for each rupee of earnings, book value or operating performance. That re-rating may reflect better quality or growth, but it can also reflect excessive optimism.
Similarly, a share can reach a new low because its valuation multiple contracts even before current earnings fall. Markets often react to future expectations rather than wait for the reported numbers to confirm them.
Sector, Economy and Market Conditions
Interest rates, commodity prices, currency movements, regulation, government policy, global markets and risk appetite can move an entire sector. A company’s price may approach a high or low even when the most recent company-specific disclosure is limited.
Corporate Announcements and Capital Changes
Acquisitions, demergers, rights issues, buybacks, bonus issues, stock splits, dividends, fund-raising and major orders can change the share price, share count, expectations or historical comparison. The Corporate Actions learning hub explains these events in their proper context.
Liquidity and Market Participation
In an actively traded share, many orders may be available near the current price. In an illiquid share, a comparatively small order can move across several price levels. A printed high does not guarantee that a large quantity could have been sold there. A printed low does not guarantee that a large quantity could have been purchased there.
Use the Brokerage Calculator to estimate transaction costs and break-even impact for an intended trade, but remember that a calculator cannot model unavailable liquidity or slippage perfectly.
Why High Does Not Mean Expensive and Low Does Not Mean Cheap
“High” and “low” describe position within recent price history. “Expensive” and “cheap” require a valuation framework. Mixing the two creates one of the most common beginner errors.
A Share Near Its High May Still Have Improving Fundamentals
Imagine a company’s earnings, free cash flow and return on capital have improved for several years. Debt has fallen, market share has increased and the business outlook has become more durable. The share price may be near a new high because the business and expectations have improved.
That does not prove the share is attractively valued. It does show why the recent high alone cannot prove that it is overvalued.
For valuation, compare price with relevant business measures. The market-capitalisation guide explains equity size. The Fundamental Analysis lessons on EPS, P/E, book value, P/B and enterprise value provide the deeper valuation framework. Do not recreate that analysis from the 52-week range.
A Share Near Its Low May Face a Permanent Problem
A price decline can reflect temporary fear, but it can also reflect:
- structurally lower demand;
- repeated dilution;
- weak cash conversion;
- excessive debt;
- loss of competitive advantage;
- regulatory or governance risk;
- poor capital allocation; or
- a business model under lasting pressure.
A share falling from ₹500 to ₹100 has declined 80%. It can still fall another 100% from ₹100 to zero. The size of the previous fall does not create a floor.
Averaging Down Is a New Decision, Not an Automatic Repair
If you buy more shares after a decline, your average purchase price changes. The Stock Average Calculator can calculate the weighted average accurately. It cannot decide whether the new purchase is sensible.
Before averaging, ask:
- Has the original investment thesis changed?
- Are the latest official results and disclosures consistent with the thesis?
- Is financial risk increasing?
- Is the position becoming too large?
- Would you buy the same security today if you did not already own it?
The arithmetic of a lower average cost must not replace fresh analysis.
Dividends Can Change the Economic Return
A stock can trade below a past high while the shareholder has also received dividends. Compare total economic return rather than price alone. The Dividend Calculator estimates income and yield, while the Stock Return Calculator can combine price change with selected dividend income.
The correct return measure and the 52-week price position answer different questions. Lesson 3 on absolute return, CAGR and XIRR explains that distinction in detail.
Technical Context: Trend, Volume, Breakouts and Price Bands
Some market participants use the 52-week high or low as a visible reference level. That makes the surrounding price behaviour important, but the level must not be treated as a guaranteed barrier.
Trend Comes Before the Label
A share can trade near its high after a steady uptrend, after one sudden news-driven gap or after a volatile recovery. Those structures are not equivalent. Trend Analysis: Uptrend, Downtrend and Sideways Market explains how sequences of highs and lows define market structure.
Likewise, a share near its low may be in a persistent downtrend, a broad sideways range or a short-lived panic. The same “near 52-week low” label can describe very different charts.
Support and Resistance Are Zones, Not Guarantees
A previous high can attract attention because some holders may consider selling near the old peak while breakout traders watch for acceptance above it. A previous low can attract attention because some participants expect support while others watch for a breakdown.
Read Support and Resistance in Stock Market before treating an exact printed value as an unbreakable line. Real markets often react around zones, and old levels can fail.
Volume Adds Participation Context
A move to a new high on broad participation may carry different information from a brief thin-volume trade at the same price. A move to a new low with heavy selling may differ from an isolated print in an illiquid security.
Trading Volume in Stock Market explains how to compare current participation with the security’s own normal activity. Volume confirms activity, not future success.
Intraday Touch Versus Accepted Close
A security can trade above the previous high during the day and close back below it. It can also trade below a previous low and recover before the close. The intraday touch proves that a trade occurred at the extreme; it does not prove that the market accepted prices beyond the level.
Breakout and Breakdown in Stock Market explains candle closes, follow-through, retests, volume confirmation, false signals and invalidation. Use that complete framework instead of buying merely because a screen flashes “new high.”
52-Week Extremes Are Not the Same as Price Bands or Circuits
A 52-week high or low summarises a historical rolling range. A daily price band restricts the permitted movement for a security during a particular session under applicable exchange rules.
NSE explains that daily price bands may be 2%, 5%, 10% or 20% depending on the security and applicable framework, while certain securities have different operating arrangements. Its price-bands page and daily review explanation should be checked for current exchange details.
A security can reach a 52-week high without hitting its upper price band. It can hit an upper band without setting a 52-week high. The same distinction applies to a 52-week low and lower band.
Define Risk Before Acting on a Technical Setup
If a trader uses the range as part of a setup, the entry, invalidation, potential exit and quantity should be defined before the order. The Risk-Reward Calculator helps quantify planned risk and reward. Risk Management in Stock Market explains why position size, liquidity, gaps and total portfolio exposure matter more than an attractive chart label.
Corporate Actions, Adjusted Data and Comparison Errors
Corporate actions can change the quoted share price or the number of shares without creating an equivalent gain or loss in shareholder wealth. Historical comparisons must therefore use consistent, adjusted data.
NSE’s market-data notes state that its 52-week high and low prices are adjusted for bonus issues, consolidation, stock splits and rights corporate actions. NSE’s reports also distinguish adjusted 52-week columns from actual unadjusted values available in underlying market data. This is why a raw old price copied from a chart may not match the adjusted high or low shown in a quote field.
Stock Split Example
Suppose a share traded at ₹1,000 before a 1:5 split. After the split, one old share becomes five shares and the theoretical price becomes ₹200, ignoring market movement.
Comparing the post-split ₹200 directly with an unadjusted ₹1,000 historical high would falsely suggest an 80% collapse. The Stock Split Calculator reconstructs the ratio, revised quantity and theoretical per-share adjustment.
Bonus-Issue Example
In a 1:1 bonus issue, the shareholder receives one additional share for every share held, subject to eligibility and the actual terms. The theoretical per-share price adjusts because the number of shares doubles. Use the Bonus Share Calculator to model the revised quantity and theoretical price, and the Bonus & Split Adjusted Return Calculator when several bonus and split events must be incorporated into a holding-return calculation.
Rights Issue, Buyback and Demerger
A rights issue can affect entitlement, subscription cost and theoretical ex-rights price. Use the Rights Issue Calculator for those mechanics rather than assuming that a lower ex-rights price represents an ordinary market loss.
A buyback can change cash proceeds and the remaining holding according to participation and acceptance. The Buyback Acceptance Ratio Calculator estimates accepted shares and resulting quantities under the chosen inputs.
A demerger can create a separate resulting-company holding and require cost allocation. Use the Demerger Cost Basis Calculator to organise the supported cost-basis inputs. The parent company’s before-and-after price should not be interpreted without the value and cost basis of the resulting holding.
Use One Data Basis Throughout
Before calculating distance, return or trend:
- confirm the security and exchange;
- confirm the date and data timestamp;
- identify adjusted versus unadjusted history;
- check recent corporate actions;
- use the same basis for high, low and current price; and
- document any manual adjustment.
Mixing an adjusted high with an unadjusted current or historical price can create a result that looks precise but has no valid economic meaning.
Seven Investor Checks and the 19-Calculator Network
A useful interpretation process begins with context and ends with risk control. It does not begin with the assumption that “near high” means sell or “near low” means buy.

Check 1: Verify the Data
Confirm the exchange, security series, date, high/low methodology and corporate-action adjustment. If two platforms disagree, compare definitions before deciding that one is wrong.
Check 2: Measure the Position Correctly
Calculate percentage below the high, percentage above the low and range position. Do not confuse any of them with your own investment return.
For your holding, reconstruct purchase quantities with the Stock Average Calculator, measure profit and total return with the Stock Return Calculator, annualise one start/end period with the CAGR Calculator, or use the XIRR Calculator for dated cash flows.
Check 3: Identify the Trend and Participation
Study the broader trend, important zones, volume and liquidity. A single extreme without follow-through is weaker evidence than a well-supported move, but even a confirmed breakout can fail.
Check 4: Read Official Results and Disclosures
Ask what changed in revenue, profit, margins, cash flow, debt, share count, industry conditions and management commentary. Use official exchange filings and company reports rather than social-media excitement.
Check 5: Separate Price Location From Valuation
Compare the market’s price with relevant earnings, assets, cash flows, growth and risk. A low price relative to its own history does not establish undervaluation. A high price relative to its own history does not establish overvaluation.
Check 6: Adjust for Corporate Actions, Costs and Tax
Reconstruct bonus, split, rights, buyback or demerger effects. Estimate execution costs with the Brokerage Calculator. For a simplified listed-equity tax estimate under selected assumptions, use the Capital Gains Tax Calculator and verify current rules independently. A gross price move and the investor’s net outcome are different figures.
Check 7: Define Risk Before the Decision
Decide the maximum acceptable loss, invalidation condition, position size and total exposure. Use the Risk-Reward Calculator for trade geometry. Do not increase size merely because the price is far below its previous high.
Where Every RegalTicker Calculator Fits
RegalTicker’s Investor Tools hub contains 19 calculators. Not every tool calculates a 52-week range; each answers a separate financial question that may arise before, during or after an investment decision.
| Investor question | Relevant calculator | Correct role |
|---|---|---|
| What could regular monthly investing grow to under an assumed rate? | SIP Calculator | Illustrative future value of recurring contributions |
| What starting SIP may be needed for a target? | Goal SIP Calculator | Goal-based contribution estimate |
| What could one invested amount grow to? | Lumpsum Calculator | Illustrative future value of one contribution |
| How may scheduled withdrawals affect a corpus? | SWP Calculator | Withdrawal schedule and illustrative remaining value |
| What annual rate connects one beginning and ending value? | CAGR Calculator | Annualised compound growth rate |
| What annualised rate fits irregular dated cash flows? | XIRR Calculator | Money-weighted return from dated flows |
| What is the weighted average cost of several purchases? | Stock Average Calculator | Average purchase price and quantity |
| What income and yield may a dividend produce? | Dividend Calculator | Dividend income and yield estimate |
| What is the holding’s profit and selected total return? | Stock Return Calculator | Price gain, income and return measurement |
| What are the defined downside and upside of a planned trade? | Risk-Reward Calculator | Planned risk, reward and ratio |
| What transaction costs and break-even price may apply? | Brokerage Calculator | Estimated Indian equity charges |
| What listed-equity tax may apply under selected inputs? | Capital Gains Tax Calculator | Simplified STCG/LTCG tax estimate |
| How may a bonus issue change shares and theoretical price? | Bonus Share Calculator | Bonus entitlement and price adjustment |
| How may a split change shares, face value and price? | Stock Split Calculator | Split factor and revised per-share figures |
| What are rights entitlement, subscription cost and TERP? | Rights Issue Calculator | Rights mechanics and theoretical ex-rights price |
| How many tendered shares may be accepted in a buyback? | Buyback Acceptance Ratio Calculator | Estimated acceptance, proceeds and remaining holding |
| What is the return after sequential bonus and split adjustments? | Bonus & Split Adjusted Return Calculator | Economically adjusted holding return |
| How can original cost be allocated after a demerger? | Demerger Cost Basis Calculator | Supported cost-basis allocation workflow |
The range statistic can help describe where a price is. These calculators help answer different questions about cash flows, costs, returns, risk, goals and corporate actions. None predicts the next market price or guarantees a return.
Frequently Asked Questions and Final Takeaway
What is the meaning of 52 week high and low?
The 52-week high is the highest relevant price reported during a rolling period of roughly one year, while the 52-week low is the lowest relevant price in that period. Together, they form the recent 52-week range.
Is a stock at its 52-week high a good buy?
The label alone cannot answer that. Investigate the trend, volume, results, valuation, liquidity, corporate actions and risk. A strong company can rise to new highs, but a high price can also reflect excessive expectations.
Is a stock at its 52-week low cheap?
Not necessarily. The decline may reflect temporary pessimism or a permanent deterioration in earnings, balance-sheet strength, governance, industry conditions or business quality. Historical price location is not valuation.
How do I calculate percentage below the 52-week high?
Use:
(52-week high − Current price) ÷ 52-week high × 100
If the high is ₹240 and the current price is ₹180, the share is 25% below the high.
How do I calculate percentage above the 52-week low?
Use:
(Current price − 52-week low) ÷ 52-week low × 100
If the low is ₹120 and the current price is ₹180, the share is 50% above the low.
Why do percentage above the low and percentage below the high not add to 100?
They use different denominators. Percentage above the low uses the low as its base, while percentage below the high uses the high as its base. Use the range-position formula when you want the current price’s location between the two endpoints.
Can the 52-week high fall even if the share price does not fall that day?
Yes. If the old highest observation leaves the rolling window, the next-highest remaining observation becomes the new 52-week high. The reference can change because the window moved.
Is the 52-week high based on an intraday price or closing price?
The convention can differ by dataset or analytical purpose. Exchange quote fields may use high/low price data, while some studies use closing-price extremes. Check the source’s methodology, timestamp and corporate-action adjustment before comparing figures.
Are 52-week high and low prices adjusted for stock splits and bonus issues?
NSE states that its 52-week high/low prices are adjusted for bonus, consolidation, split and rights corporate actions. Other charts or providers may display history differently, so verify the data basis before performing a manual comparison.
Is a 52-week high the same as an all-time high?
No. A 52-week high covers only the rolling one-year window. An all-time high refers to the highest price over the security’s full available trading history, subject to the data and adjustment convention used.
Is a 52-week low the same as a lower circuit?
No. A 52-week low is a rolling historical extreme. A lower circuit or lower price band is a session-specific trading limit under applicable exchange rules. A security can reach one without reaching the other.
Which calculator should I use with the 52-week range?
Use the Stock Return Calculator for an actual holding’s return, the Stock Average Calculator for several purchase prices, CAGR for one start/end period, XIRR for irregular cash flows and Risk-Reward for a planned trade. Use the appropriate corporate-action calculator when splits, bonus issues, rights, buybacks or demergers affect the comparison.
Final Takeaway
The 52-week high and low are useful reference prices because they compress a rolling year of market history into an understandable range. Their usefulness ends when they are mistaken for fair value, forecasts or automatic trading instructions.
Read the statistic in order:
- verify the data and adjustment basis;
- calculate the current position correctly;
- study trend, volume and liquidity;
- read official results and disclosures;
- separate price location from valuation;
- adjust for corporate actions, costs and tax; and
- define risk before acting.
The next Market Terminology lesson will explain upper circuit, lower circuit, circuit filters and daily price bands—terms that are often confused with 52-week highs and lows but describe a different market mechanism.
Official Sources
- SEBI Investor — How to Buy and Sell Shares in Stock Exchanges
- NSE — New 52-Week High/Low
- NSE — Security-Wise Monthly, Yearly and 52-Week High/Low Reports
- NSE — Price Bands
- NSE — Daily Review of Price Bands
Educational disclaimer: This article is for investor education and general information only. It is not investment advice, a research recommendation, an invitation to trade, an offer to buy or sell securities, or a guarantee of returns. Market prices can rise or fall, and past price ranges do not predict future outcomes. Verify current exchange data, company disclosures, corporate-action terms, costs and tax rules before making a decision.