Upper circuit and lower circuit are price-boundary terms, not automatic buy and sell signals. When a security reaches its applicable upper price limit for a trading session, market participants commonly say it has hit the upper circuit. When it reaches the applicable lower price limit, they say it has hit the lower circuit. Trading cannot normally occur beyond the permitted boundary while that band remains applicable, but orders may still be entered or remain queued at the allowed price.
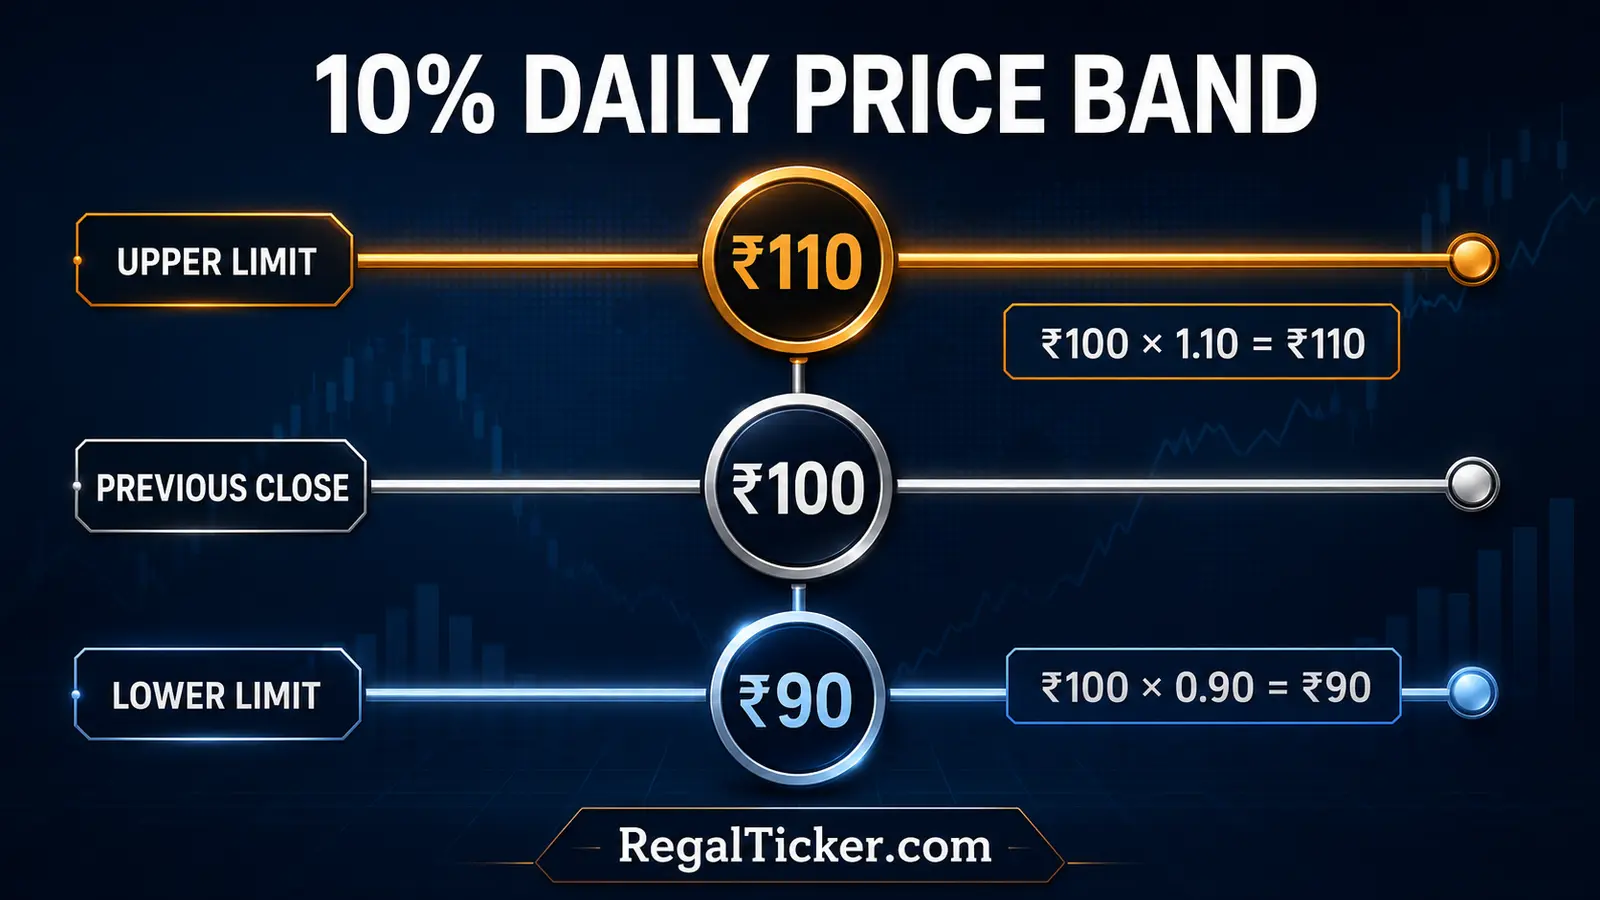
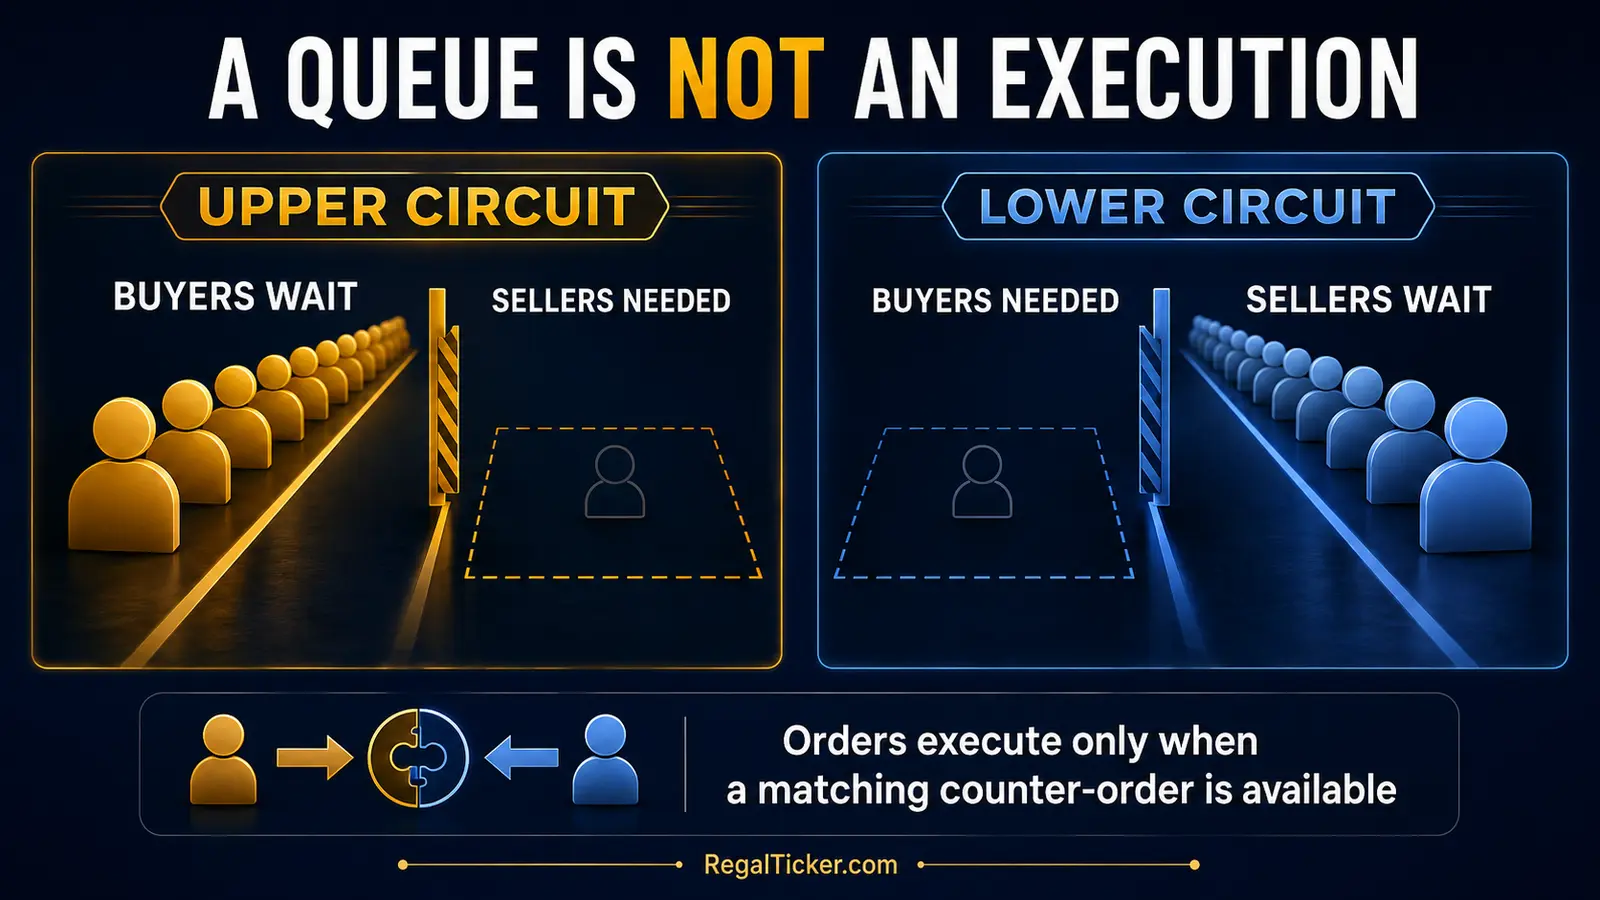
Imagine a fictional share with a previous close of ₹100 and an applicable 10% daily price band. Its indicative upper limit is ₹110 and its indicative lower limit is ₹90. If it trades at ₹110, it has reached the top of that day’s allowed range. If many buyers remain at ₹110 but sellers are absent, buy orders can wait without execution. The reverse can happen at ₹90: sellers may wait because willing buyers are unavailable.
That order-matching detail is crucial. “Upper circuit” does not mean every buyer earned 10%. “Lower circuit” does not mean every holder successfully sold. A displayed queue is an intention to trade, not proof that a trade has occurred. Execution requires a matching counter-order under the exchange’s priority and trading rules.
This is the fifth lesson in the Market Terminology learning hub. It builds on the vocabulary in Stock Market Terminology: 50 Essential Terms, the separation of face value, book value and market value, and the return measures in Absolute Return vs CAGR vs XIRR. This lesson focuses narrowly on daily price boundaries, market-wide circuit breakers, queues and investor risk.
Upper Circuit and Lower Circuit: Quick Meaning
An upper circuit is the upper permitted price boundary applicable to a security for the session. A lower circuit is the lower permitted boundary. The expression circuit filter is often used in market conversation for such limits, while official exchange material commonly uses the term price band for the range in which a security can move.
The National Stock Exchange explains on its official price-bands page that daily bands may be 2%, 5%, 10% or 20% for securities under the applicable framework. The exact band for a security is not chosen by the investor, broker or company each morning. It follows exchange and surveillance rules and can change through review or regulatory action.
Upper Circuit Meaning
A stock is commonly described as being in upper circuit when its traded price reaches the upper permitted limit and cannot trade above it under the current band. If buy demand remains while sell supply disappears, unexecuted buy orders can accumulate at that price.
Three facts must be separated:
- The permitted upper price: the highest price allowed under the current boundary.
- The last traded price: the price of the latest completed trade.
- The pending buy quantity: orders waiting to buy that have not necessarily executed.
A screen showing the upper price and a large buy queue does not prove that every queued buyer will receive shares. A seller must accept or place a compatible order, and orders are processed according to the applicable price-time priority and exchange mechanism.
Lower Circuit Meaning
A stock is commonly described as being in lower circuit when its traded price reaches the lower permitted limit and cannot trade below it under the current band. If sell supply remains while buyers disappear, unexecuted sell orders can accumulate at the lower boundary.
The lower limit does not guarantee an exit. A holder can place a sell order at the permitted price and still remain unmatched. This is a liquidity risk: the displayed market value of a holding may not be immediately realisable for the desired quantity.
Price Limit Does Not Fix Fair Value
An exchange boundary controls the permitted trading range; it does not estimate intrinsic value. A stock at upper circuit may be undervalued, fairly valued or extremely overvalued. A stock at lower circuit may be temporarily weak, fundamentally impaired or still expensive after the decline.
Read How Are Share Prices Decided? for the underlying process. Buyers and sellers create executable prices through orders. A price band restricts the range in which that matching can occur; it does not replace demand, supply, valuation or company analysis.
Circuit, Closing Price and Return Are Different
If a stock closes at its upper limit, the session’s price change may be positive, but an individual investor’s return depends on the purchase price, quantity, costs, dividends and holding period. Someone who bought earlier at ₹150 and sees the stock at ₹110 still has a loss even if the stock rose from ₹100 to ₹110 that day.
Use the Stock Return Calculator for holding-level price and total return. Use the Brokerage Calculator to include estimated transaction charges. A circuit percentage and a portfolio return answer different questions.
How Daily Price Bands Are Calculated
For a simple educational calculation, apply the stated percentage on both sides of the relevant reference price, commonly the previous closing price under the exchange methodology.
Indicative upper limit = Previous close × (1 + Price-band percentage)
Indicative lower limit = Previous close × (1 − Price-band percentage)
Suppose the fictional previous close is ₹100 and the applicable band is 10%.
Upper limit = ₹100 × 1.10 = ₹110
Lower limit = ₹100 × 0.90 = ₹90
The exchange applies the final permitted values using its exact reference, tick size, rounding rules and current surveillance framework. Therefore, use the official exchange display for live trading rather than assuming that a manually calculated decimal is the executable limit.
Worked Examples for 2%, 5%, 10% and 20% Bands
Using the same fictional ₹100 previous close makes the comparison easy:
| Applicable band | Indicative lower limit | Previous close | Indicative upper limit |
|---|---|---|---|
| 2% | ₹98 | ₹100 | ₹102 |
| 5% | ₹95 | ₹100 | ₹105 |
| 10% | ₹90 | ₹100 | ₹110 |
| 20% | ₹80 | ₹100 | ₹120 |
A 20% band does not predict a 20% move. It describes the outer permitted range. The stock may move only 1%, remain unchanged or trade anywhere else within the allowed interval.
Why the Two Percentage Moves Are Not Symmetric Over Time
The daily boundaries are symmetric around the reference in percentage points, but investment recovery mathematics is not symmetric across multiple days. A 20% fall from ₹100 produces ₹80. A later 20% rise from ₹80 produces only ₹96, not ₹100.
The gain required to recover a loss is:
Required recovery = Loss ÷ (1 − Loss) × 100
After a 20% loss:
20% ÷ 80% × 100 = 25%
Use the Stock Return Calculator to measure an actual holding and the CAGR Calculator to annualise one beginning value and one ending value over multiple years. If cash flows occurred on several dates, the XIRR Calculator is more appropriate. None of these tools should treat a circuit percentage as an expected return.
Reference Price Can Change After a Corporate Action
Bonus issues, stock splits, rights issues, dividends and other corporate actions can affect theoretical prices, historical comparisons or exchange reference calculations. A large nominal price change around an ex-date may not represent an equivalent economic gain or loss.
For example, a 1:1 bonus issue theoretically doubles the share count and halves the per-share reference before market movement. The Bonus Share Calculator estimates the entitlement and theoretical ex-bonus price. A stock split changes face value, share count and theoretical price; use the Stock Split Calculator. To compare holding returns through either event, use the Bonus & Split Adjusted Return Calculator.
Always check the official exchange notice and corporate filing. Do not label an adjusted price as a crash or circuit event merely because an unadjusted chart appears to show a large gap.
Which Securities Have 2%, 5%, 10% or 20% Bands?
NSE’s published framework lists daily price bands of 2%, 5% and 10%, with 20% bands on remaining securities under the stated conditions. It also explains that no ordinary fixed price band applies to securities on which derivative products are available, although an operating range is used to prevent orders at non-genuine prices.
The key beginner lesson is not to memorise one permanent percentage for every stock. The applicable treatment depends on the security, segment and current exchange or surveillance rules.
Why a Band Can Become Narrower
Exchanges use surveillance measures to support orderly markets. A security may be moved to a narrower band where the applicable criteria or surveillance action warrants it. NSE’s daily review of price bands says downward revision is a daily process, while upward revision is bi-monthly and subject to objective criteria.
A move from a 20% band to a 10%, 5% or 2% band does not itself prove fraud, nor does it certify that the company is unsafe. It shows that a trading-control or surveillance treatment applies. The reason and relevant notice should be checked rather than guessed from social-media messages.
Why a Band Can Later Widen
An upward revision can occur when the required review conditions are satisfied. The change does not guarantee higher prices. A wider band simply permits a wider potential session range.
Investors should verify:
- the current band shown by the exchange or broker;
- the security series and market segment;
- whether surveillance measures apply;
- whether the session is a normal market, call auction or special session;
- whether a corporate action changed the reference; and
- whether a current exchange notice explains the revision.
Dynamic Price Bands and Operating Ranges
For securities without an ordinary fixed band because derivative products are available, NSE states that a dynamic price band or operating range is used. The range can be flexed under pre-determined criteria. This is not the same as saying that such a security can trade at any arbitrary price without controls.
Dynamic arrangements are a more advanced exchange mechanism. A beginner does not need to predict when a range will flex. The practical rule is to read the live exchange or broker boundary and never assume that yesterday’s permitted range will remain unchanged today.
Check the Security, Not a Generic Internet List
Exchange data changes. A blog post, video or screenshot can become outdated after a band revision, series change or corporate action. NSE publishes a price-bands and surveillance-actions section and downloadable reports. BSE also provides a live circuit-filter view. Use official sources for the current security rather than treating a static educational example as live trading data.
Stock Price Band Versus Market-Wide Circuit Breaker
The phrases are often mixed together, but they describe different levels of market control.
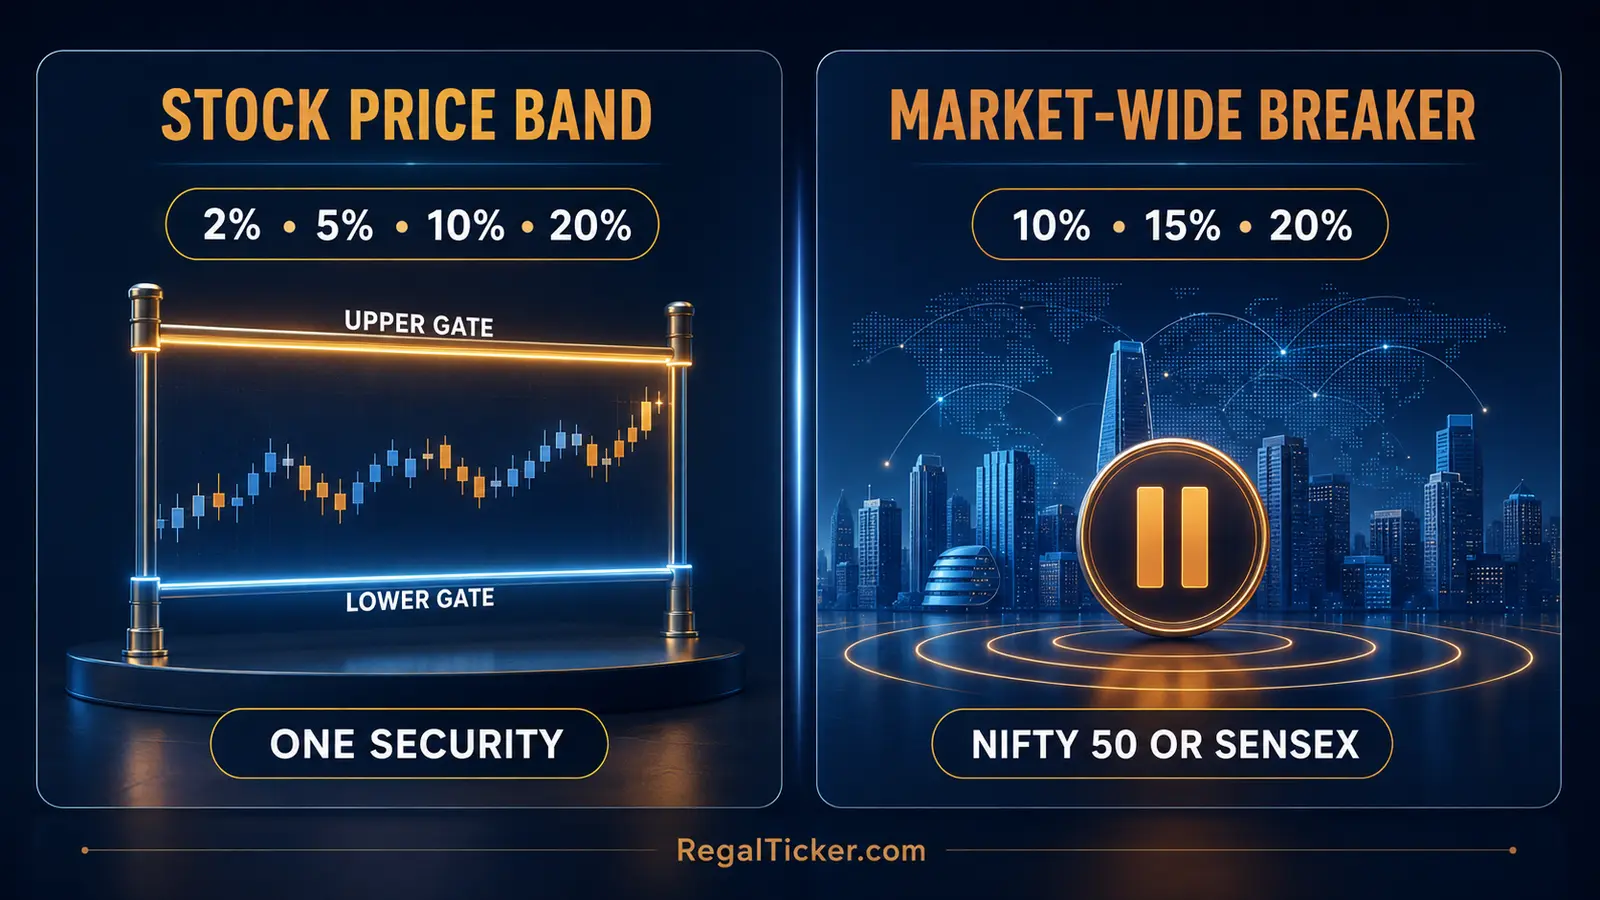
An individual-security price band limits the permitted movement of one security under its applicable framework. An index-based market-wide circuit breaker responds to a sufficiently large movement in the broad market and can trigger a coordinated trading halt across equity and equity-derivative markets nationwide.
The Core Difference
| Feature | Individual-security price band | Market-wide circuit breaker |
|---|---|---|
| Main reference | A particular security | Nifty 50 or BSE Sensex |
| Common levels | 2%, 5%, 10% or 20%, as applicable | 10%, 15% and 20% |
| Main effect | Restricts the security’s permitted price range | Coordinates a broad market halt or closure under the timing rules |
| Scope | One security or applicable instrument | Equity and equity-derivative markets nationwide |
| Can orders remain unmatched? | Yes | Outstanding orders are handled under the halt/reopening rules |
| Is it a valuation signal? | No | No |
Market-Wide Breaker Levels
NSE’s official circuit-breakers page states that the mechanism applies at index movements of 10%, 15% and 20% in either direction. It is triggered by whichever is breached earlier: the BSE Sensex or Nifty 50.
The 10% and 15% outcomes depend on the time of breach. For example, NSE’s current table provides a 45-minute halt plus a 15-minute pre-open call auction for a 10% breach before 1:00 p.m.; later breaches have shorter or no halts according to the table. A 20% breach at any time closes the market for the remainder of the day.
Because these rules are operational and may be revised, always use the current official exchange page. The educational point is the tiered structure, not an invitation to trade around a halt.
NSE’s secondary-market FAQs also state that outstanding orders at the time of an index-based market-wide halt are cancelled and that reopening uses a pre-open call auction where applicable. Investors should therefore check fresh order status after the market reopens rather than assume an earlier order remains active.
A Stock Can Hit Its Band Without Halting the Market
One small-cap share can reach its upper or lower band while Nifty 50 and Sensex move very little. That is a security-level event. Other shares can continue trading normally.
Conversely, a market-wide breaker can be triggered by an index move even though many individual securities have not reached their own permitted boundaries. The breaker responds to the broad index threshold, not a count of how many stocks show “upper circuit” or “lower circuit.”
A 52-Week High or Low Is Different Again
A 52-week high or low is a rolling historical statistic. A price band is a session boundary. A market-wide breaker is a coordinated index-level control. One security can set a 52-week high without touching its upper daily band; it can touch an upper band without setting a 52-week high.
This distinction prevents three separate market labels from being treated as one signal. Historical location, permitted daily movement and market-halt rules answer different questions.
What Happens When a Stock Hits a Circuit Limit?
Reaching a boundary does not automatically stop every activity in the security. The exchange continues to apply its order-matching and permitted-price rules. Compatible orders at the boundary may execute. Unmatched orders can wait in the book.
At Upper Circuit: Buyers May Queue
Suppose the upper limit is ₹110. If sellers are available at ₹110, trades can occur. If buy demand is greater than sell supply, some buy orders may execute and others may remain pending. If no seller is available, a buyer cannot force an execution simply by choosing “market order.”
A large pending buy quantity can look impressive, but it does not establish:
- the quality of the business;
- the authenticity of market rumours;
- the next day’s opening price;
- the number of sessions the move will continue;
- the ability to exit later; or
- a sensible position size.
The queue can change as participants place, modify or cancel orders under the applicable rules. Treat it as current order-book information, not a promise.
At Lower Circuit: Sellers May Be Trapped in a Queue
Suppose the lower limit is ₹90. If willing buyers exist at ₹90, sell orders may match. If selling supply overwhelms buying demand, sell orders can remain pending. The holder still owns the shares until an execution occurs.
This is why liquidity must be considered before entry, not only after a decline. A theoretical stop-loss at ₹92 offers limited protection if the security gaps to ₹90 and no buyer is available. Risk control must account for gaps and execution risk.
Use the Risk-Reward Calculator to quantify a planned entry, invalidation and target, but treat its output as planning arithmetic. Read Risk Management in Stock Market for position sizing, liquidity and gap risk. A calculator cannot create a counterparty at the lower limit.
Limit Order, Market Order and the Boundary
A limit order states the worst price the investor is willing to accept. A market order seeks immediate execution at available prices, but availability still matters. A market order cannot legitimately trade beyond the permitted price range, and it cannot execute when no compatible counter-order exists.
Before submitting an order:
- read the displayed upper and lower limits;
- inspect best available buy and sell prices;
- check quantities on both sides;
- choose a quantity that fits the planned risk;
- understand the broker’s order status; and
- confirm execution in the trade book or contract note rather than assuming it occurred.
Pending, Open, Rejected and Executed Are Different
A pending or open order has not necessarily traded. A rejected order was not accepted. A partially executed order filled only some of the desired quantity. A completed order filled the accepted quantity according to the status shown.
Do not calculate profit, tax or average cost using an unexecuted order. After confirmed trades, use the Stock Average Calculator to combine multiple purchase quantities and prices. Use the Brokerage Calculator for estimated transaction charges and the Capital Gains Tax Calculator for an educational estimate after an actual taxable sale.
Circuit Can Open During the Session
A stock described as “locked” at a boundary may later trade away from it if compatible supply and demand appear. For example, sellers arriving at the upper limit can satisfy pending buyers. After enough selling, the last traded price may move below the upper boundary.
Likewise, buyers arriving at the lower limit can absorb pending sell orders. The phrase “circuit opened” is informal market language for the stock resuming trades away from a previously locked one-sided condition. It does not mean the exchange removed the applicable daily boundary.
Why Stocks Hit Upper or Lower Circuit
A boundary can be reached for many reasons. The price event shows an imbalance strong enough to move to the permitted extreme; it does not identify the cause by itself.
Company Announcements and Results
Results, orders, acquisitions, fund-raising, regulatory decisions, management changes, insolvency developments or other disclosures can rapidly change expectations. Stronger-than-expected information may produce buying pressure. Negative or uncertain information may produce selling pressure.
Read the filing itself. A social-media summary may omit conditions, timelines, dilution, contingent liabilities or risks. Verify the announcement on the exchange and compare it with the company’s earlier disclosures.
Rumours, Tips and Unverified Messages
Illiquid securities can move sharply on rumours or promotional messages. A circuit queue can then be used as supposed “proof” that the story is true. The reasoning is circular: people buy because the price is rising, and the rising price is presented as evidence for the claim.
Price movement does not verify information. Search the exchange filings, company announcements and regulator communications. Do not send money, share credentials or place an order because a message promises repeated upper circuits.
Low Liquidity and Small Free Float
When few shares are normally available near the market price, a modest order imbalance can move the traded price quickly. The same illiquidity that helps a stock reach an upper limit can make the later exit difficult.
Trading Volume in Stock Market explains why current volume should be compared with the security’s own history. Volume shows participation, but even high reported volume does not guarantee continuous two-sided liquidity at the moment an investor needs it.
Corporate Actions and Adjustment Confusion
Bonus issues, stock splits, rights issues, buybacks and demergers change share counts, theoretical prices, entitlements or cost allocation. An unadjusted screen can create a misleading impression.
Use the Rights Issue Calculator for theoretical ex-rights price and entitlement economics. Use the Buyback Acceptance Ratio Calculator to model accepted and unaccepted quantities. For a demerger, the Demerger Cost Basis Calculator helps allocate the original tax cost using the stated proportions. These tools support the Corporate Actions learning hub; they do not predict a circuit.
Broad Market Panic or Euphoria
Market-wide news can produce strong one-directional activity across many securities. In extreme circumstances, an index-based breaker may operate. During less extreme periods, individual securities may reach their own boundaries while the broad market remains open.
The Breakout and Breakdown guide explains why a close, follow-through, retest and invalidation matter more than one exciting print. A circuit can interrupt normal technical evidence, so avoid treating the boundary itself as a complete setup.
Seven Mistakes and Risk Checks Before Acting
The safest interpretation begins with verification and ends with position-level risk. The circuit status belongs in the middle; it should not dominate the decision.
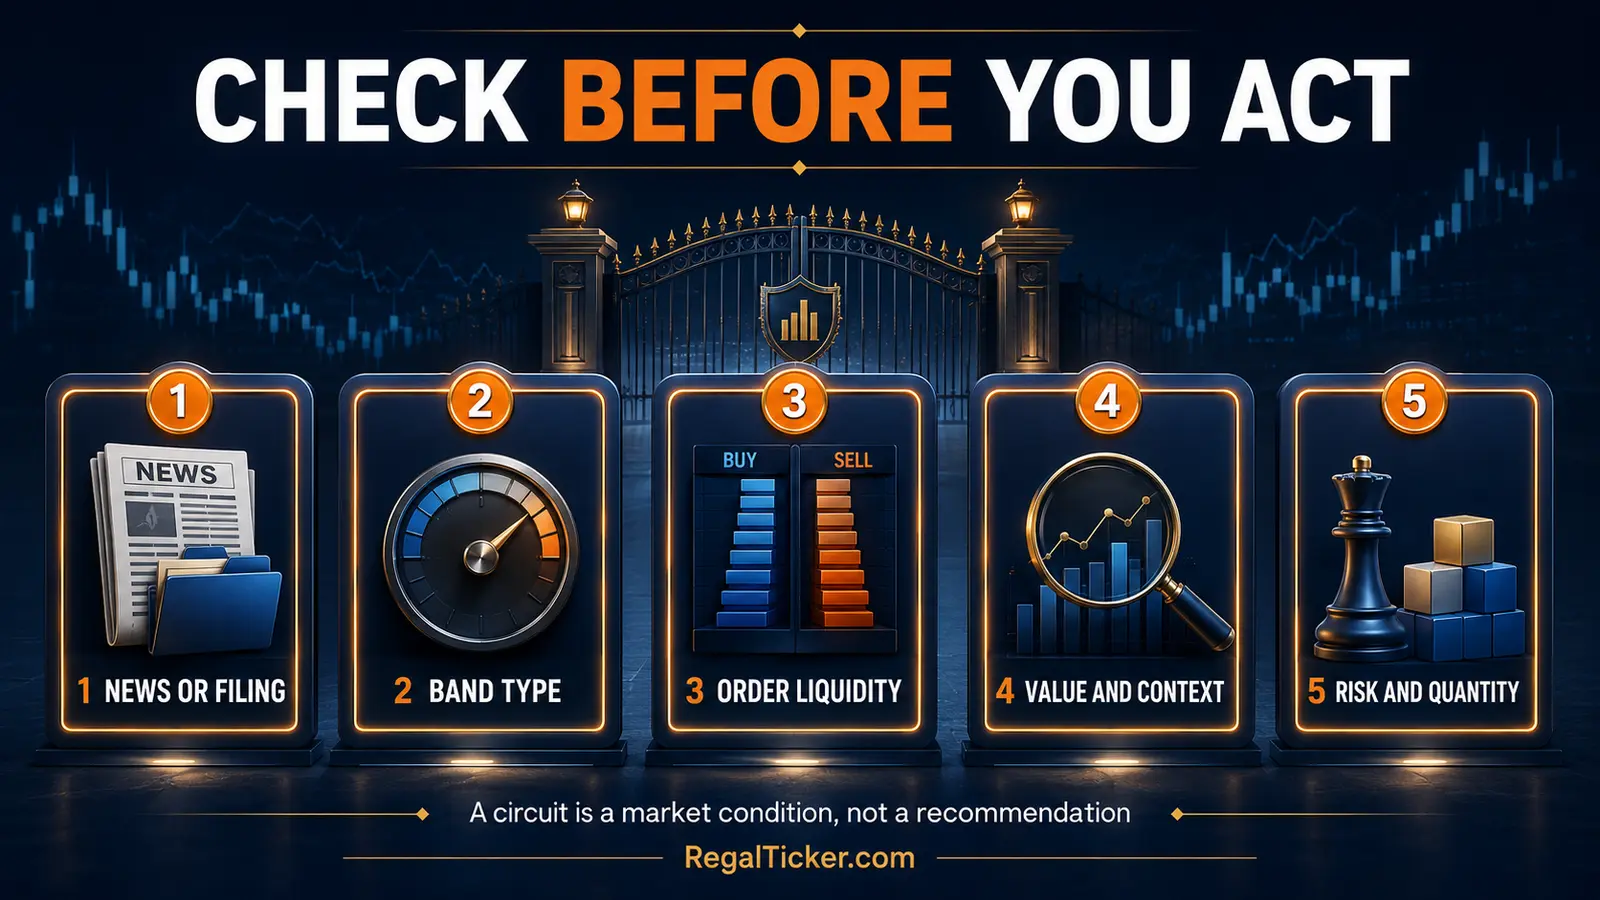
1. Verify the Official News or Filing
Identify the actual information that may have caused the move. Check the exchange filing, results, corporate-action notice or regulatory communication. If no reliable source exists, classify the cause as unknown rather than converting a rumour into a fact.
2. Confirm the Applicable Band Type
Check whether the security has a fixed 2%, 5%, 10% or 20% band, a dynamic operating range, or a different arrangement for its segment. Also distinguish a security-level event from a market-wide circuit breaker.
3. Inspect Both Sides of the Order Book
A large buy queue at the upper limit may have little sell supply. A large sell queue at the lower limit may have little buy demand. Look for executable counterparties, not just the headline pending quantity. Even then, quantities can change before your order reaches priority.
4. Separate Momentum From Value
Upper circuit does not equal undervaluation. Lower circuit does not equal bargain. Compare the price with earnings, cash flow, balance-sheet strength, business quality and realistic expectations.
If dividends materially affect the holding, use the Dividend Calculator for income and yield and the Stock Return Calculator for total-return arithmetic. These figures add context; they do not turn a circuit into a recommendation.
5. Define Risk and Quantity Before the Order
Decide how much capital can be lost if the security gaps or remains locked. Set the position size from risk, not excitement. Use the Risk-Reward Calculator to compare a planned entry, invalidation and target. Then reduce the quantity if the stock’s liquidity or gap behaviour makes the nominal stop unreliable.
6. Include Costs, Tax and Execution Reality
A gross price change is not a net return. Estimate trading charges with the Brokerage Calculator. After an actual sale, use the Capital Gains Tax Calculator as an educational estimate and verify the applicable tax rules or professional advice.
Never count an unexecuted queued order as a purchase or sale. Confirm the final quantity and price first.
7. Avoid Chasing and Blind Averaging
Buying only because a stock has repeated upper circuits can leave an investor with no exit when the queue reverses. Averaging repeatedly into lower circuits can concentrate capital in a deteriorating or illiquid security.
The Stock Average Calculator calculates the weighted average after confirmed purchases. It cannot judge whether another purchase is sensible. Reassess the thesis, official information, valuation, liquidity and total portfolio exposure before adding.
A Compact Pre-Order Checklist
Before considering a circuit-affected security, answer all of these:
- What is the official source for the price-moving information?
- What price band or operating range applies today?
- Is this an individual-security event or a market-wide breaker?
- Are compatible orders available on the opposite side?
- Can the desired quantity realistically execute?
- What happens if the stock opens at another limit tomorrow?
- What percentage of portfolio capital is at risk?
- Is the valuation supported by business evidence?
- Are corporate-action adjustments understood?
- Have brokerage, tax and liquidity been considered?
If any answer is unknown, the correct response is further research or a smaller/no position—not confidence based on the circuit label.
Use All 18 Regal Ticker Calculators Wisely
Calculators convert known inputs into transparent arithmetic. They do not forecast order-book liquidity, a circuit opening or the next day’s price. Use the relevant tool only after identifying the question.
Stocks, Returns, Costs and Risk
| Investor question | Calculator | Correct use around circuit events |
|---|---|---|
| What is my weighted purchase price after confirmed buys? | Stock Average Calculator | Combine executed quantities and prices; exclude pending orders. |
| What return did the holding actually produce? | Stock Return Calculator | Measure price change and selected income from the investor’s cost, not the daily band. |
| What is the annualised rate between two values? | CAGR Calculator | Annualise a multi-year start and end value. |
| What is the return across irregular dated cash flows? | XIRR Calculator | Measure dated purchases, sales and receipts after they occur. |
| What dividend income or yield applies? | Dividend Calculator | Add income context without treating yield as price protection. |
| What is the planned reward relative to risk? | Risk-Reward Calculator | Test the planned entry and invalidation, then account for gap and liquidity risk. |
| What transaction charges may apply? | Brokerage Calculator | Estimate net break-even using confirmed or intended trade values. |
| What may the capital-gains tax be? | Capital Gains Tax Calculator | Estimate tax after identifying the actual gain, holding period and inputs. |
The strongest workflow is: first define risk with the Risk-Reward Calculator, then test costs with the Brokerage Calculator, and after confirmed execution update the Stock Average Calculator. When the position is finally sold, calculate economic performance with the Stock Return Calculator and, where relevant, the Capital Gains Tax Calculator.
Corporate-Action Calculators
| Corporate-action question | Calculator | Why it matters for price interpretation |
|---|---|---|
| How many bonus shares and what theoretical adjusted price? | Bonus Share Calculator | Prevents an ex-bonus price adjustment from being mistaken for a normal fall. |
| How do shares and price adjust after a split? | Stock Split Calculator | Separates a mechanical per-share adjustment from investment return. |
| What are TERP, entitlement and subscription economics? | Rights Issue Calculator | Helps interpret price around the ex-rights date and subscription decision. |
| What quantity might a buyback accept? | Buyback Acceptance Ratio Calculator | Separates tender assumptions from guaranteed acceptance. |
| What is the adjusted holding return after bonus or split? | Bonus & Split Adjusted Return Calculator | Compares economic return across share-count changes. |
| How should original cost be allocated after a demerger? | Demerger Cost Basis Calculator | Supports cost tracking across the resulting holdings. |
Use the Bonus Share Calculator together with the Bonus & Split Adjusted Return Calculator when a bonus changes both share count and the chart’s apparent price. Use the Stock Split Calculator for split arithmetic. For rights, buybacks and demergers, use the Rights Issue Calculator, Buyback Acceptance Ratio Calculator and Demerger Cost Basis Calculator only with the official announcement’s terms.
Goals and Mutual-Fund Calculators
| Planning question | Calculator | Appropriate role |
|---|---|---|
| What might regular monthly investing grow to? | SIP Calculator | Model a diversified long-term contribution plan instead of chasing one locked stock. |
| What SIP may be needed for a target? | Goal SIP Calculator | Connect a target, horizon and assumed return. |
| What may a one-time investment grow to? | Lumpsum Calculator | Test long-term compounding assumptions. |
| How could periodic withdrawals affect a corpus? | SWP Calculator | Model withdrawals from a portfolio; it is not a stock-exit guarantee. |
The SIP Calculator, Goal SIP Calculator, Lumpsum Calculator and SWP Calculator address long-term planning. They are deliberately different from circuit analysis. Their value here is behavioural: a goal-based plan can reduce the temptation to abandon diversification for a stock promoted through repeated circuit screenshots.
Explore the complete Regal Ticker Investor Tools hub whenever the question changes. Choose the tool that matches the cash-flow pattern or corporate action; do not force every market event into one return calculation.
Frequently Asked Questions
What is upper circuit in the stock market?
Upper circuit is the common term for a security reaching its applicable upper price boundary for the session. It cannot normally trade beyond that permitted limit while the band applies. Buy orders can remain queued if sufficient sellers are unavailable.
What is lower circuit in the stock market?
Lower circuit is the common term for a security reaching its applicable lower price boundary. Sell orders may remain pending if sufficient buyers are unavailable. Reaching the lower boundary does not guarantee that a holder can exit.
How are upper circuit and lower circuit calculated?
In a simplified example, apply the applicable percentage above and below the relevant reference, commonly the previous close. At ₹100 with a 10% band, the indicative limits are ₹110 and ₹90. The exchange’s live figures govern after tick-size, rounding and current-rule adjustments.
Can I buy a stock at upper circuit?
You can place an eligible order at the permitted price, but execution is not guaranteed. The order needs a compatible seller and must reach priority under the exchange’s matching mechanism. A pending buy quantity is not a completed purchase.
Can I sell a stock at lower circuit?
You can place an eligible sell order at the permitted price, but it will execute only if a compatible buyer is available. A large seller queue can leave the order pending or partially filled.
Does upper circuit mean the stock will rise again tomorrow?
No. The next session can open higher, lower or unchanged within the applicable mechanism. News, valuation, liquidity, order flow and market conditions can change. A circuit status is not a forecast.
Does lower circuit mean a stock is cheap?
No. “Lower circuit” describes today’s permitted trading boundary, not fair value. A company can remain overvalued, financially weak or illiquid even after a sharp fall. Fundamentals and valuation require separate analysis.
What is the difference between a price band and a market-wide circuit breaker?
A price band applies to an individual security under the relevant rules. A market-wide circuit breaker responds to a 10%, 15% or 20% move in Nifty 50 or BSE Sensex, whichever breaches first, and can coordinate a broad trading halt.
Why do some stocks have no fixed 2%, 5%, 10% or 20% band?
NSE states that securities with derivative products do not have the ordinary fixed bands described for other securities, although operating or dynamic ranges apply to prevent non-genuine price orders. Always check the live security-specific treatment.
Can an upper or lower circuit change during the day?
The applicable boundary is governed by exchange rules. In dynamic-band securities, the operating range may flex under pre-determined criteria. In a fixed-band security, the stock can move away from a previously locked boundary when matching supply or demand appears, even though the day’s limit itself remains.
Are all queued orders executed when the circuit opens?
No. Orders execute only when compatible counter-orders are available and priority is reached. Some may fill completely, some partially and others not at all. Confirm the trade book or contract note before treating the order as completed.
Is repeatedly hitting upper circuit proof of a good company?
No. Repeated upper circuits can reflect genuine information, strong demand, low liquidity, rumours, speculation or several forces together. Verify filings, analyse the business, inspect liquidity and control position size. Price behaviour alone cannot certify company quality.
Upper circuit and lower circuit are useful market terms when read precisely. They describe trading boundaries and order conditions—not fair value, guaranteed execution or future return. Verify the official source, understand the applicable band, inspect both sides of the order book and define risk before acting.
For current operational rules, consult NSE’s official price bands, daily price-band review, market-wide circuit breakers and secondary-market FAQs. Exchange rules and security classifications can change; live official data should override any static example.