Promoter holding and pledged shares describe two different parts of a listed company’s ownership picture. Promoter holding shows the shares attributed to the promoter and promoter group in the disclosed shareholding pattern. Pledged or otherwise encumbered promoter shares show how much of that holding is subject to a pledge, lien, non-disposal undertaking or another disclosed restriction. Public shareholding shows ownership classified outside the promoter category under the applicable reporting framework; it does not mean retail investors alone.
These numbers attract attention because ownership can affect control, market liquidity and investor confidence. However, no single percentage is a verdict. High promoter holding does not automatically prove good governance. A fall in promoter percentage does not automatically mean promoters sold shares. A pledge is a risk factor, but it is not by itself proof of default or fraud. Even zero pledge cannot compensate for weak cash flow, excessive company debt, poor disclosures or an unreasonable valuation.
The correct approach is to compare consecutive official filings, use the correct denominator, identify the transaction behind the change and then connect ownership data with the company’s financial and business position. This lesson explains that process with exact calculations and a practical checklist.
This eighth lesson in the Market Terminology learning hub follows Stock Market Terminology: 50 Essential Terms, Face Value, Book Value and Market Value, Absolute Return vs CAGR vs XIRR, 52 Week High and Low, Upper Circuit and Lower Circuit, Bulk Deal vs Block Deal and FII vs DII. It owns the narrower search intent around quarterly ownership, promoter percentage, public classification and promoter encumbrance.
Promoter Holding and Pledged Shares: Quick Difference
Promoter holding answers who is classified as the promoter group and what percentage of the company it holds. Promoter pledge answers what portion of that promoter holding is encumbered. Public shareholding answers what portion is classified as public rather than promoter or another non-public category.
| Term | What it measures | Typical denominator | What it does not prove |
|---|---|---|---|
| Promoter holding | Shares held by the promoter and promoter group | Total relevant equity shares in the filing | Management quality, honesty or future returns |
| Public shareholding | Shares classified under public shareholders | Total relevant equity shares in the filing | Retail ownership alone |
| Pledged promoter shares | Promoter shares given as security under a pledge | Promoter holding or total equity, depending on the displayed ratio | Automatic default or automatic sale |
| Encumbered promoter shares | Wider category of restrictions including pledge and other covered arrangements | Promoter holding or total equity | That every encumbrance has identical risk |
| Change in promoter percentage | Movement in the promoter share of total equity | Current total equity | That promoters necessarily bought or sold |
Ownership, Control and Collateral Are Not the Same
A promoter may hold 60% of a company and have no pledged shares. Another promoter may hold 45% and pledge 10% of that promoter holding. A professionally managed company may have no identified promoter in the conventional sense. These structures cannot be ranked through one universal rule.
Promoter holding is an ownership classification. Control can also depend on voting arrangements, board influence, shareholder agreements and the distribution of other holdings. A pledge is a collateral arrangement affecting shares that the promoter holds. The lender does not automatically become the company’s promoter merely because shares are pledged; the risk changes materially if the pledge is invoked or shares are sold under the applicable arrangement.
Public Shareholding Does Not Mean Only Small Investors
The public category may include resident individuals, foreign portfolio investors, mutual funds, insurers, banks, alternative investment funds, bodies corporate and other disclosed categories, subject to the filing format. Therefore, a company with 40% public shareholding does not necessarily have 40% retail ownership.
Read FII vs DII for the difference between foreign portfolio and domestic institutional categories. Those institutional investors can appear within the public side of a shareholding pattern, but daily FII/DII trading data and quarterly shareholding percentages answer different questions.
One Number Must Never Replace the Full Filing
Financial portals often display a headline such as “Promoter holding: 58%; promoter pledge: 12%.” Before using it, confirm:
- the quarter-end date;
- whether the filing was revised;
- whether the pledge percentage uses promoter holding or total equity;
- whether the portal says pledged or encumbered;
- whether total shares changed;
- whether the company disclosed a corporate action or capital issue;
- whether the number is consolidated from the official exchange filing.
The NSE shareholding-pattern page separates promoter and promoter group, public shareholders, non-promoter non-public shareholders, significant beneficial owners and other detailed views. The source and the as-on date are more important than a screenshot circulating on social media.
How a Quarterly Shareholding Pattern Works
Regulation 31 of the current SEBI Listing Obligations and Disclosure Requirements Regulations governs the statement showing holding of securities and the shareholding pattern for listed entities. The filing is structured by category and security class, not as a casual list of a company’s best-known investors.
For an investor, the most useful habit is to open the company’s filing on the stock-exchange website and compare at least two consecutive quarter-end statements. The NSE shareholding-pattern filing FAQ also clarifies that a holder disclosed under promoter and promoter group should not be duplicated under the public category.
Start With the Summary, Then Open the Detailed Tables
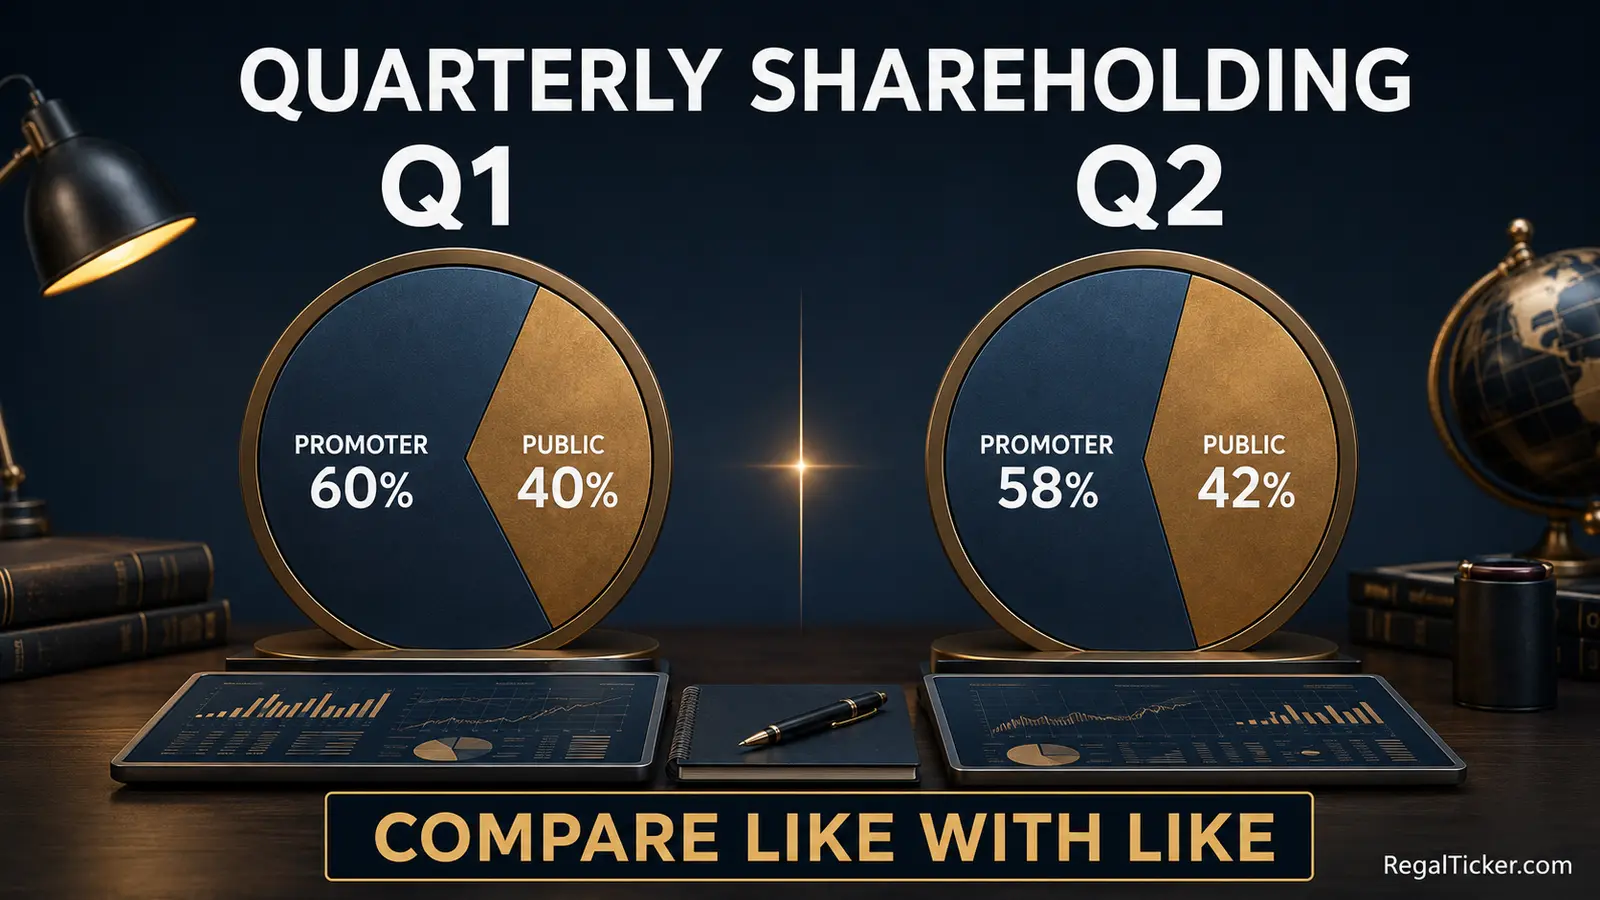
The summary shows the broad ownership split. The detailed tables show names and subcategories where disclosure is required. A disciplined reading sequence is:
- confirm the company, security class and as-on date;
- read promoter and promoter-group percentage;
- read public shareholding and its institutional and non-institutional breakdown;
- inspect non-promoter non-public categories where applicable;
- check pledged or otherwise encumbered promoter shares;
- compare the same fields with the previous quarter;
- read notes, corporate announcements and capital changes explaining the movement.
Do not compare the percentage from one quarter with the number of shares from another. A percentage and an absolute count can move differently when the total equity base changes.
Shareholding Pattern Is a Point-in-Time Statement
A quarter-end filing reports the position as of a stated date. It does not show every trade during the quarter. A promoter could buy and sell at different points and finish with the same quarter-end percentage. An institution could move in and out before the reporting date. Daily market activity, block or bulk disclosures and quarterly ownership therefore cannot be treated as interchangeable datasets.
Read Bulk Deal vs Block Deal to understand transaction disclosures for large trades. A disclosed deal may help explain an ownership change, but the categories, thresholds and time periods remain different.
Use Both Absolute Shares and Percentage
Suppose promoter shares remain at 6 crore, but total equity rises from 10 crore to 12 crore after a new issue. The absolute promoter holding is unchanged, yet the percentage falls from 60% to 50%.
If a portal displays only the percentage, an investor may wrongly conclude that the promoter sold 10 percentage points. The denominator changed. This is why the filing should be read alongside the company’s capital-raising announcements, allotment details and corporate-action record.
Minimum Public Shareholding Is a Regulatory Requirement, Not an Investment Signal
The general continuous-listing framework requires minimum public shareholding under Regulation 38 of the LODR Regulations read with the Securities Contracts (Regulation) Rules, subject to the applicable exceptions and timelines. SEBI also specifies permitted methods for achieving minimum public shareholding in its MPS circular.
Do not convert the general 25% reference into a rule that every company must always show exactly 75% or less promoter holding without checking its legal situation. Recently listed issuers, public-sector entities, restructuring cases and other specified circumstances can involve different transition provisions. The official filing and current rules control.
What Promoter Holding Means—and What It Does Not Mean
Promoter holding is the proportion of shares disclosed under promoter and promoter group. The promoter may be an individual, family, body corporate, government or another classified entity. “Promoter” is a legal and disclosure category; it is not always synonymous with founder, chief executive, largest shareholder or day-to-day manager.
Why Investors Watch Promoter Holding
Promoter ownership can matter for several reasons:
- economic alignment: promoters with meaningful ownership participate in gains and losses;
- control: voting power can influence board composition and strategic decisions;
- supply and liquidity: a tightly held company may have a smaller freely tradable public float;
- capital allocation: changes can accompany fund-raising, succession, restructuring or acquisitions;
- confidence: the market may interpret voluntary purchases or sales as signals, though the reason must be verified.
None of these points is conclusive alone. A promoter can own a large stake and still make poor decisions. A widely held company can have strong professional management and governance. The ownership structure must be judged with the business model, financial statements and disclosures.
Is Higher Promoter Holding Always Better?
No. Higher holding can strengthen alignment and control, but it can also reduce free float and concentrate decision-making. Governance quality depends on treatment of minority shareholders, related-party transactions, capital allocation, board independence, disclosure quality and compliance—not merely the percentage held.
Use How to Analyse a Company Fundamentally to place ownership beside revenue, profit, cash flow, debt, return ratios and valuation. Use the Risk-Reward Calculator for your own entry, downside and target assumptions; promoter ownership is not a stop-loss.
Is Lower Promoter Holding Always Bad?
No. A low or declining percentage may reflect:
- shares sold by promoters;
- a qualified institutional placement or preferential issue;
- employee stock options or another new issue;
- conversion of warrants or convertible securities;
- a rights issue in which participation differed;
- merger, demerger or restructuring;
- a buyback in which groups participated differently;
- promoter reclassification under the applicable framework;
- transmission, settlement or another disclosed ownership event.
The same percentage change can arise from very different causes. The investor’s job is to identify the cause, not attach a fixed emotional label.
Promoter Buying Is Not an Automatic Buy Signal
An increase in promoter holding may show confidence, but it can also result from a denominator change, reclassification or a corporate action rather than an open-market purchase. Even a genuine purchase does not tell you whether the current market price is attractive for your horizon.
Measure your own expected and realised outcome with the Stock Return Calculator. If purchases occur on multiple dates, record only executed quantities and prices in the Stock Average Calculator, then use the XIRR Calculator when dated cash flows matter. Do not enter a promoter’s percentage as if it were your investment return.
Public Shareholding, Free Float and Ownership Categories
Public shareholding is the portion classified as public under the applicable securities-law framework. It is a regulatory ownership category, not a description of investor sophistication, nationality or trade size.
Who Can Appear in the Public Category?
Depending on the company and filing, public shareholders can include:
- mutual funds and other domestic institutions;
- foreign portfolio investors;
- insurance companies;
- alternative investment funds;
- banks and financial institutions;
- bodies corporate;
- resident individuals;
- non-resident individuals;
- trusts and other permitted categories.
An investor should expand the detailed public-shareholder table instead of assuming the public portion is widely dispersed. A company can have 40% public shareholding but a large part may be concentrated among a few institutions or strategic-looking holders classified under the applicable rules.
Public Shareholding Is Not Identical to Free-Float Market Capitalisation
Public shareholding and free-float treatment are related but not identical ideas. Index providers apply their methodology to determine shares considered available for trading and investment. A broad public percentage from the company filing should not be copied directly into an index free-float calculation without reading the index methodology.
Read What Are NIFTY 50 and SENSEX? for index construction and free-float concepts. Market capitalisation, public shareholding and index weight are three different measurements.
Why Ownership Concentration Matters
When a small group controls a large share of public ownership, the effective market supply may be less diverse than the headline public percentage suggests. Concentration can affect liquidity and the impact of large orders. However, turnover and liquidity must be verified through actual trading data rather than inferred from shareholding alone.
Read Trading Volume in Stock Market and Bid Price, Ask Price, Spread and Order Book. Then estimate your own transaction costs with the Brokerage Calculator. A public-float percentage does not guarantee that your order will execute at the displayed price.
FII/DII Flow and Quarterly Holding Can Point in Different Directions
Daily FII/DII data normally summarises purchase and sale activity for a stated segment and period. Quarterly shareholding reports a point-in-time ownership position. An institution may trade repeatedly while its quarter-end holding changes only slightly. Derivatives activity may not appear as ownership of equity shares in the same way.
Therefore, “FPIs were net sellers this month” and “FPI ownership rose quarter over quarter” are not necessarily contradictory. The datasets may differ in scope, dates, security types and gross-versus-net treatment.
What Pledged and Encumbered Promoter Shares Mean
A pledge commonly means shares are provided as collateral for an obligation. The wider regulatory idea of encumbrance can include a pledge, lien, negative lien, non-disposal undertaking or another restriction or arrangement covered by the framework. SEBI’s encumbrance review explains that covered arrangements include restrictions creating a risk of promoter shares being appropriated or sold by a third party.
The promoter may pledge shares to obtain financing for the promoter, a group entity or another disclosed purpose. Investors should not invent the purpose. Read the specific disclosure, lender details where provided, security terms and the company’s explanation.
Why a Promoter Pledge Creates Additional Risk
The main risk is the link between a falling share price and collateral value. If the pledged shares lose value, the borrower may need to provide more collateral, repay part of the borrowing or face enforcement under the arrangement. If the encumbrance is invoked and a lender sells shares, the event can affect ownership, control, market supply and price.
SEBI requires disclosures relating to creation, invocation and release of promoter encumbrances under the takeover framework. The NSE pledged-data page displays both encumbered shares as a percentage of promoter shares and as a percentage of total shares—two figures that must not be confused.
Pledged Shares Are Not Automatically Sold Shares
Pledge creation does not itself mean the promoter has sold the shares. It creates security over them. Invocation or enforcement is a separate event. Likewise, release of pledge does not automatically mean a loan was repaid from strong business cash flow; the arrangement may have been refinanced, replaced or otherwise changed.
Use the disclosure sequence:
- creation of encumbrance;
- any modification or additional encumbrance;
- release, if the restriction ends;
- invocation, if the secured party enforces rights over the shares;
- any resulting sale or ownership change.
Do not collapse all five into the word “pledge.”
Zero Pledge Is Positive but Not a Complete Safety Test
Zero promoter pledge removes one specific collateral-related risk. It does not tell you whether the company itself has debt, whether cash flows are weak, whether promoters have given other guarantees, whether related-party transactions are sound or whether the share price is reasonable.
Read How to Read a Balance Sheet and How to Read a Cash Flow Statement. Company borrowing and promoter share encumbrance are different. One cannot be substituted for the other.
High Pledge Is a Red Flag for Investigation, Not a Standalone Verdict
A large or rising pledge deserves deeper review because it can increase vulnerability to market-price falls and lender action. But the investor still needs the reason, lender, trend, promoter’s financial capacity, company fundamentals and any release plan. A fixed rule such as “never invest above X% pledge” may be simple, but it can hide meaningful differences between cases.
SEBI’s circular on detailed reasons for encumbrance strengthened attention to significant promoter encumbrances. Use the current filing rather than a portal’s old pledge figure.
How to Calculate Promoter Holding and Promoter Pledge
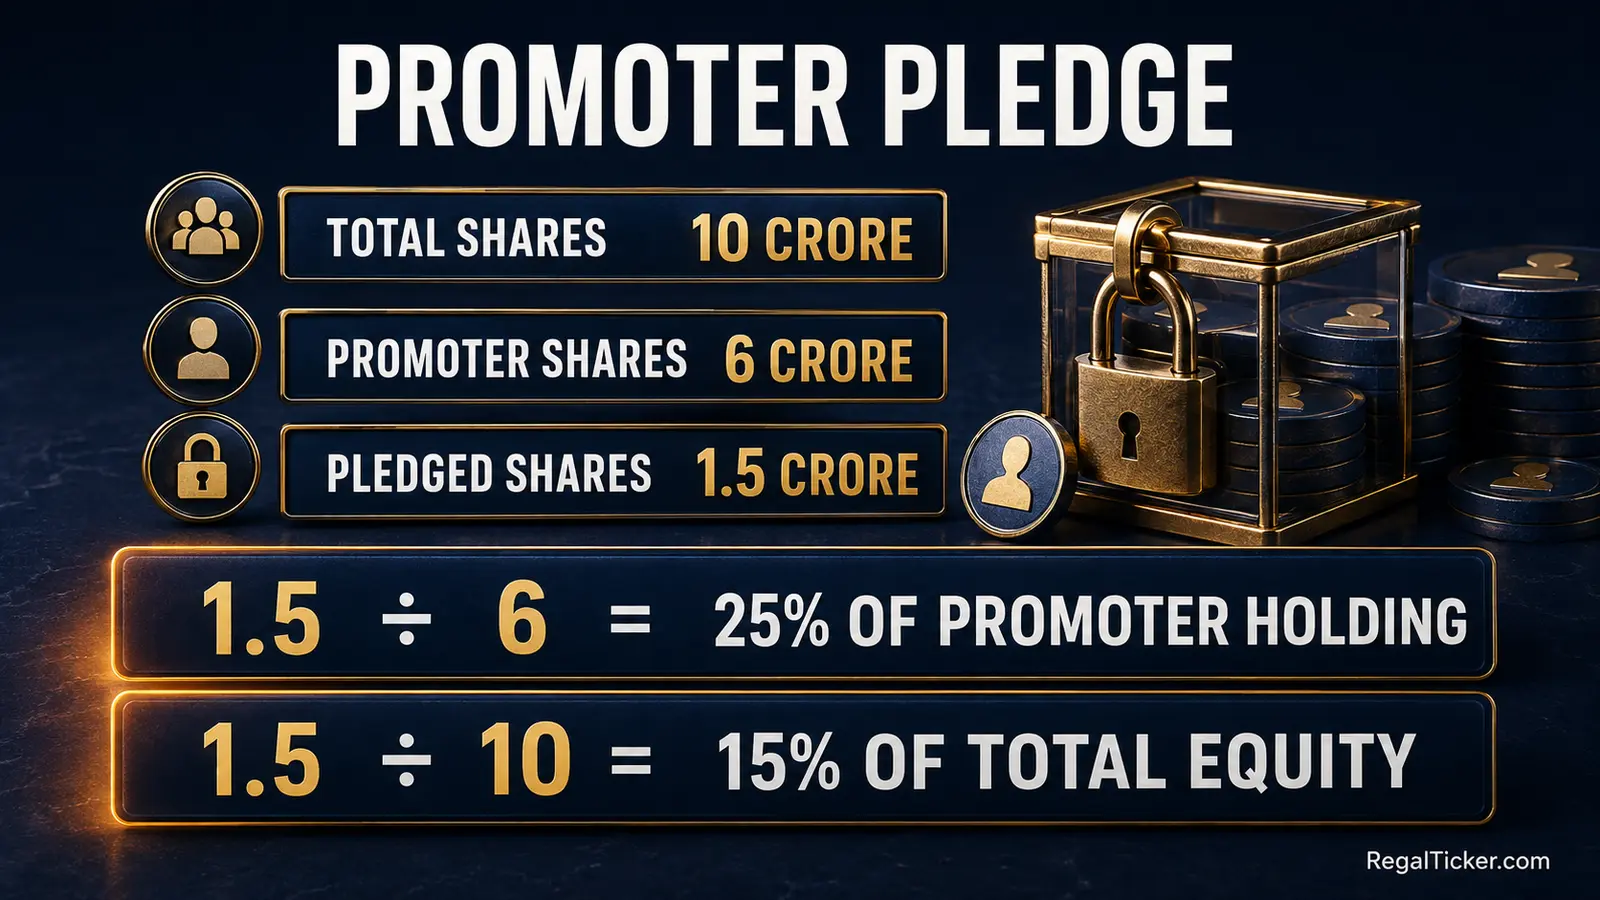
The arithmetic is simple only after the denominator is identified. Assume a company has 10 crore total equity shares. The promoter and promoter group hold 6 crore shares. Of those, 1.5 crore shares are pledged or otherwise encumbered.
Promoter Holding Percentage
Promoter holding % = Promoter shares ÷ Total relevant shares × 100
Promoter holding % = 6 crore ÷ 10 crore × 100 = 60%
Public shareholding in this simplified two-category example is 4 crore shares, or 40%. A real filing may contain additional categories and denominator details, so the official summary controls.
Pledge as a Percentage of Promoter Holding
Pledged promoter holding % = Encumbered promoter shares ÷ Total promoter shares × 100
Pledged promoter holding % = 1.5 crore ÷ 6 crore × 100 = 25%
This means one-quarter of the promoter group’s own holding is encumbered.
Pledge as a Percentage of Total Equity
Pledged shares as % of total equity = Encumbered promoter shares ÷ Total relevant shares × 100
Pledged shares as % of total equity = 1.5 crore ÷ 10 crore × 100 = 15%
The two ratios are both correct, but they answer different questions. Saying “the pledge is 25%” without naming the denominator is incomplete.
Worked Quarter-to-Quarter Pledge Example
| Metric | Quarter 1 | Quarter 2 | Interpretation |
|---|---|---|---|
| Total equity shares | 10 crore | 10 crore | Denominator unchanged |
| Promoter shares | 6 crore | 6 crore | Promoter ownership unchanged at 60% |
| Encumbered promoter shares | 1.5 crore | 0.9 crore | Absolute encumbrance fell |
| Encumbrance as % of promoter holding | 25% | 15% | Ten-percentage-point reduction |
| Encumbrance as % of total equity | 15% | 9% | Six-percentage-point reduction |
This is generally a favourable movement in the specific pledge metric, but it still does not explain why the encumbrance was released or prove that the company’s fundamentals improved. Read the corresponding release disclosure.
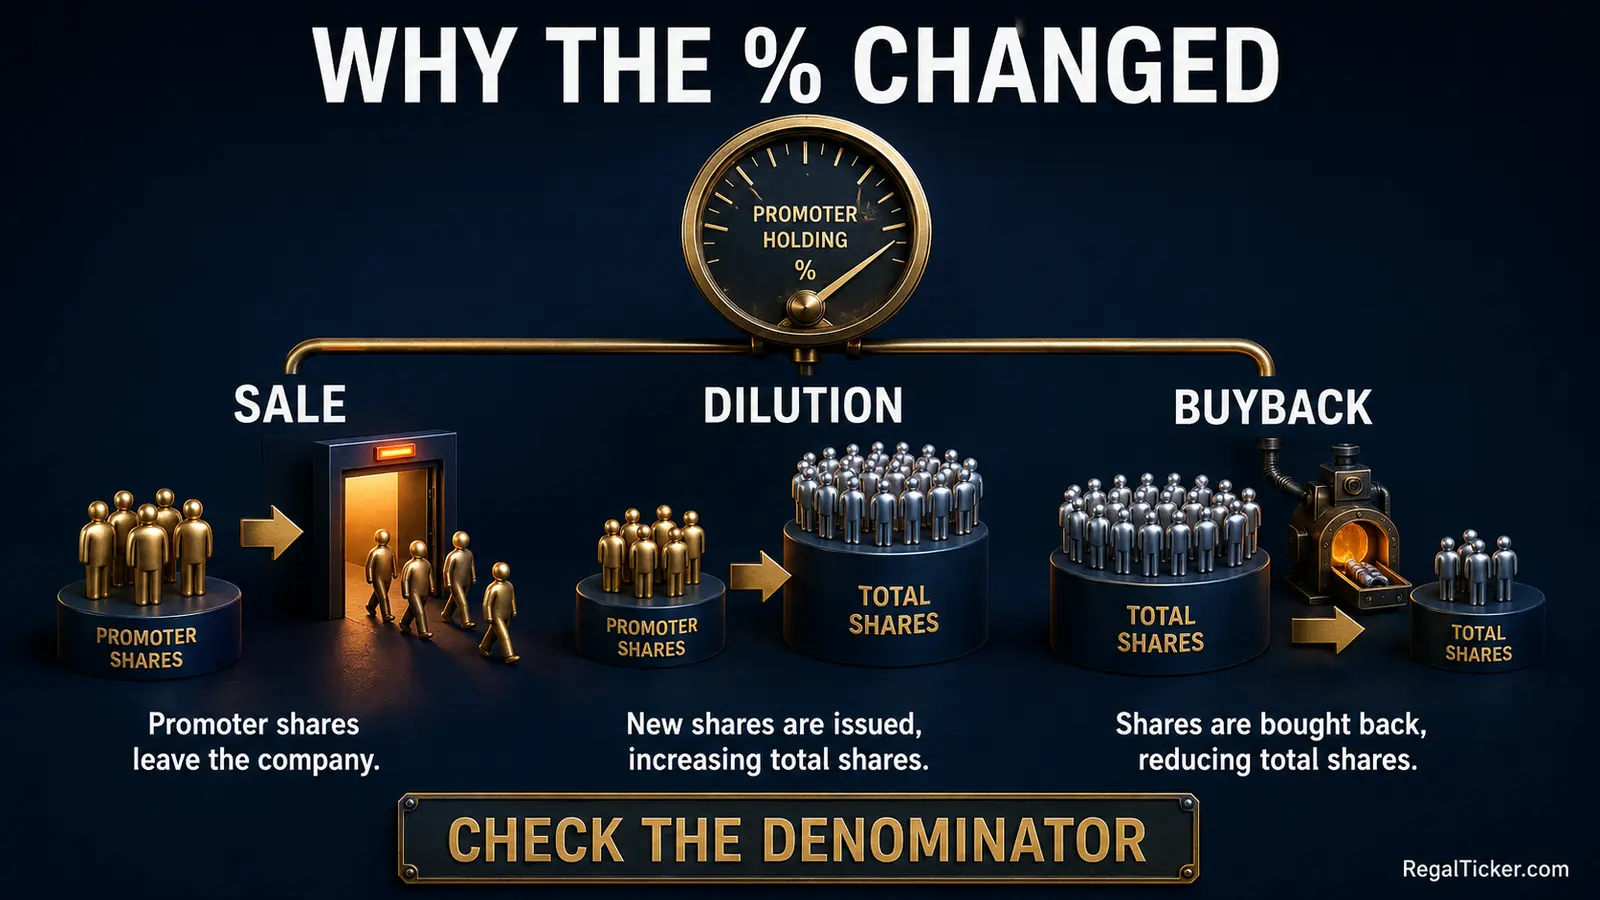
Why Promoter Percentage Can Fall Without a Sale
Suppose the company issues 2 crore new shares to public or institutional investors. Promoter shares stay at 6 crore, but total shares rise from 10 crore to 12 crore.
Promoter holding becomes 6 ÷ 12 × 100 = 50%.
The promoter percentage falls from 60% to 50% even though the promoter sold zero shares. The change came from dilution.
The Rights Issue Calculator can model entitlement and theoretical ex-rights price when a rights issue applies. It cannot decide whether the promoter subscribed; verify the allotment and post-issue filing. The Stock Average Calculator should contain your executed purchases, not the company’s expanded share count.
Why Promoter Percentage Can Rise Without a Purchase
Suppose total shares fall from 10 crore to 9 crore after a buyback while promoter shares remain 6 crore. The promoter percentage rises from 60% to 66.67% because the denominator fell. Actual outcome depends on participation and accepted quantities.
The Buyback Acceptance Ratio Calculator estimates tender outcomes for your assumptions. It does not predict the promoter group’s final percentage. Use the post-buyback shareholding pattern for that.
Bonus and Split Usually Change Quantity, Not Ownership Percentage
A proportionate bonus issue or stock split generally increases share quantities for all eligible holders without mechanically changing their ownership percentages. A 1:1 bonus can double promoter shares and total shares while leaving promoter percentage unchanged. A split changes the number and face value per share, not the underlying ownership fraction by itself.
Use the Bonus Share Calculator and Stock Split Calculator to adjust quantities. Use the Bonus & Split Adjusted Return Calculator for economic return across the event. Do not label a doubled promoter share count as promoter buying if a bonus caused it.
Nine Checks Before Interpreting a Shareholding Pattern
Check 1: Use the Official Filing and Correct Quarter
Open the exchange filing, confirm the company and read the as-on date, submission date and revision status. Do not mix a March quarter promoter figure with a June quarter pledge figure.
Check 2: Read Absolute Shares and Percentages Together
If the percentage changed, check whether promoter shares changed, total shares changed or both. This separates buying or selling from dilution, buyback and other denominator effects.
Check 3: Identify the Exact Corporate Event
Read allotment, rights, bonus, split, buyback, merger, demerger, ESOP, warrant-conversion and reclassification announcements. Use the Rights Issue Calculator, Bonus Share Calculator, Stock Split Calculator, Buyback Acceptance Ratio Calculator or Demerger Cost Basis Calculator only after the relevant official terms are known.
Check 4: Name the Pledge Denominator
Distinguish pledge as a percentage of promoter holding from pledge as a percentage of total equity. Write the numerator and denominator before comparing two sources.
Check 5: Read Creation, Release and Invocation Separately
Creation adds encumbrance. Release removes it. Invocation indicates enforcement. A portal’s current percentage can hide the event sequence, so open the underlying disclosures.
Check 6: Read the Reason and Trend
One quarter is a snapshot. Compare several periods, then ask whether the pledge is rising, falling or fluctuating; who the secured party is; what purpose is disclosed; and whether management explains repayment or refinancing.
Check 7: Examine Public-Ownership Concentration and Liquidity
Expand institutional and non-institutional categories. Compare actual volume, spreads and order-book depth. Estimate your transaction cost with the Brokerage Calculator; do not assume public shareholding guarantees liquidity.
Check 8: Connect Ownership With Fundamentals and Valuation
Review balance sheet, cash flow, company debt, contingent liabilities, related-party transactions, return ratios and valuation. Measure dividend income with the Dividend Calculator and your realised outcome with the Stock Return Calculator. Neither calculator converts promoter ownership into company quality.
Check 9: Make the Decision From Your Own Risk Plan
Define position size, entry, invalidation, loss tolerance, costs and tax. Test the planned downside and upside with the Risk-Reward Calculator, charges with the Brokerage Calculator, and potential capital-gains tax with the Capital Gains Tax Calculator. A promoter’s confidence cannot absorb your loss.

Use All 19 Regal Ticker Calculators With Shareholding Data
Calculators should solve your arithmetic, not grade promoters through a mechanical score. The most relevant tools for this lesson are stock average, return, brokerage, tax, risk-reward and the corporate-action calculators. The planning tools help prevent a quarterly ownership headline from disrupting a long-term cash-flow plan.
Trade, Return, Cost and Risk Calculators
| Your question | Calculator | Correct use with promoter/shareholding data |
|---|---|---|
| What is my weighted price after executed purchases? | Stock Average Calculator | Combine your quantities and prices; do not enter promoter percentages. |
| What total return did my holding produce? | Stock Return Calculator | Measure your entry, exit, quantity and income after verified adjustments. |
| What annual rate links one beginning value to one ending value? | CAGR Calculator | Annualise your multi-year lump-sum result, not quarterly promoter changes. |
| What return comes from irregular dated cash flows? | XIRR Calculator | Measure multiple purchases, sales and receipts on their actual dates. |
| What dividend income and yield apply to my shares? | Dividend Calculator | Add declared dividends to your holding analysis. |
| What is planned reward relative to downside? | Risk-Reward Calculator | Define your own price risk; promoter holding is not downside protection. |
| What charges may apply to my order? | Brokerage Calculator | Estimate costs and break-even from your order assumptions. |
| What may the capital-gains tax be? | Capital Gains Tax Calculator | Estimate tax using your gain and holding-period inputs after checking current rules. |
A sensible workflow is to research the ownership change first, define downside with the Risk-Reward Calculator, estimate transaction charges with the Brokerage Calculator, record completed purchases in the Stock Average Calculator, and measure the result through the Stock Return Calculator. Use the XIRR Calculator for irregular dated cash flows or the CAGR Calculator for one beginning and one ending value over multiple years.
Corporate-Action Calculators
| Ownership event | Calculator | Why it matters for shareholding analysis |
|---|---|---|
| Bonus issue | Bonus Share Calculator | Separates a proportionate quantity increase from promoter buying. |
| Stock split | Stock Split Calculator | Adjusts quantity and face value without treating the split as an ownership gain. |
| Rights issue | Rights Issue Calculator | Models entitlement and theoretical ex-rights price when participation can affect ownership. |
| Tender buyback | Buyback Acceptance Ratio Calculator | Models your tender result while the official post-buyback filing confirms ownership percentages. |
| Bonus/split return adjustment | Bonus & Split Adjusted Return Calculator | Preserves economic comparability across share-count changes. |
| Demerger | Demerger Cost Basis Calculator | Allocates original cost after one holding separates into multiple listed interests. |
Use official event ratios and dates. Start with the Bonus Share Calculator or Stock Split Calculator when the share count changed proportionately. Use the Rights Issue Calculator when new entitlement shares were offered. Use the Buyback Acceptance Ratio Calculator for a tender scenario and the Demerger Cost Basis Calculator only after the company publishes the cost-allocation information. Then measure adjusted performance with the Bonus & Split Adjusted Return Calculator where applicable.
Long-Term Planning Calculators
| Planning question | Calculator | Role beside quarterly ownership data |
|---|---|---|
| What may regular investing grow to? | SIP Calculator | Models periodic contributions instead of reacting to every ownership headline. |
| What contribution may target a future goal? | Goal SIP Calculator | Connects goal, horizon and assumed return. |
| What may a one-time investment grow to? | Lumpsum Calculator | Tests long-term compounding assumptions for a single investment. |
| How may regular withdrawals affect a corpus? | SWP Calculator | Models withdrawals without assuming promoter ownership guarantees liquidity or return. |
The SIP Calculator, Goal SIP Calculator, Lumpsum Calculator and SWP Calculator keep the user’s goal and cash flows at the centre. They do not predict promoter transactions or pledge invocation.
Explore the complete Regal Ticker Investor Tools hub whenever the arithmetic changes. Select a calculator by cash-flow pattern, corporate action, tax question or risk decision—not because a shareholding percentage appeared in a headline.
Frequently Asked Questions and Final Takeaway
What is promoter holding in simple words?
Promoter holding is the number and percentage of shares disclosed under the promoter and promoter-group category in a company’s shareholding pattern. It indicates ownership attributed to that category, but it does not by itself prove governance quality or future performance.
What is public shareholding?
Public shareholding is ownership classified under public shareholders rather than promoter or applicable non-public categories. It can include institutions, foreign portfolio investors, companies and individuals. It is not the same as retail shareholding alone.
What does pledged shares mean?
Pledged shares are shares provided as collateral for an obligation. If the relevant conditions are breached, the secured party may have rights to invoke or enforce the pledge according to the arrangement and applicable law.
What is the difference between pledged and encumbered shares?
Pledge is one form of encumbrance. The wider encumbrance concept can include pledge, lien, negative lien, non-disposal undertaking and other covered restrictions or arrangements. Read the exact exchange disclosure.
Is high promoter holding always good?
No. It can indicate meaningful economic ownership and control, but it can also concentrate power and reduce free float. Governance, financial quality, valuation and treatment of minority shareholders remain essential.
Is a decrease in promoter holding always bad?
No. It may come from a promoter sale, but it can also result from new-share issuance, ESOPs, conversion, rights participation, restructuring, reclassification or another denominator change. Compare absolute shares and total equity.
Can promoter holding rise without promoters buying shares?
Yes. If total shares fall after a buyback while promoter shares remain unchanged, the promoter percentage can rise. Reclassification or other capital changes can also alter the reported percentage.
Is any promoter pledge a sign of fraud?
No. A pledge is a financing and collateral arrangement, not proof of fraud. It adds risk and requires investigation of the reason, scale, trend, lender, terms and possibility of invocation.
Is zero promoter pledge enough to call a stock safe?
No. Zero pledge removes one risk factor. Company debt, cash flow, governance, business quality, valuation, liquidity and your own position size still matter.
How is promoter pledge percentage calculated?
Pledge as a percentage of promoter holding equals encumbered promoter shares divided by total promoter shares multiplied by 100. Pledge as a percentage of total equity uses total company shares as the denominator. Always name which ratio is being quoted.
Where can I check promoter holding and pledged shares?
Use the company’s official shareholding-pattern and encumbrance filings on the stock-exchange website. NSE provides dedicated shareholding-pattern and pledged-data pages.
How many quarters should an investor compare?
At minimum, compare the latest filing with the previous quarter. For a meaningful trend, several quarters are better. Also read the corporate announcements that explain capital or ownership changes between those dates.
Final Takeaway
Promoter holding and pledged shares should be read as connected but distinct data. First confirm the official quarter-end filing. Then compare absolute promoter shares, total equity, public categories and both pledge ratios. Identify whether a change came from buying, selling, dilution, buyback, corporate action, reclassification, release or invocation.
The strongest conclusion is rarely “high is good” or “low is bad.” The useful conclusion is specific: what changed, why it changed, how the denominator changed, what risk the encumbrance creates, and whether the company’s fundamentals and your own investment plan justify action.
Use the Risk-Reward Calculator, Brokerage Calculator, Stock Average Calculator, Stock Return Calculator and Capital Gains Tax Calculator for your own numbers. Use the official exchange filings for the company’s ownership numbers. Never reverse those roles.