
How to read a stock quote is not simply a matter of looking at the green or red number beside a share. A quote page combines several kinds of information: the latest completed trade, the session’s price range, the order book, trading activity, exchange controls, valuation ratios, ownership data and security identifiers. These fields describe different questions and often use different time periods.
A beginner may see a latest traded price of ₹256 and assume that ₹256 is the guaranteed buying price, that a positive daily change means the business improved, or that a low P/E ratio makes the share cheap. None of those conclusions follows from one displayed field. The quote must be read in layers.
This final lesson in the Market Terminology learning hub turns the vocabulary from Lessons 1–9 into one repeatable workflow. It does not replace the 50 Essential Stock Market Terms glossary. Instead, it shows where common terms appear, what each field can and cannot tell you, and which deeper Regal Ticker lesson or calculator to use next.
Key takeaways
- First verify the company, symbol, ISIN, exchange series, source and timestamp.
- LTP records the most recent completed trade; it is not a promised execution price.
- Previous close, open, high, low, close and percentage change describe different points in the session.
- Bid, ask, spread and market depth describe currently displayed orders, while volume and VWAP summarise completed trades.
- A 52-week range, price band or surveillance flag is not a valuation conclusion.
- Market capitalisation, P/E, EPS, debt-to-equity and promoter holding need the correct reporting period and denominator.
- A quote page is a starting screen for research, not a buy, sell or hold recommendation.
Source note: Exchange quote values, series, bands, surveillance status and order-book quantities can change during the session or through later circulars. This educational guide was last source-checked on 4 August 2026 against the NSE equity quote interface, NSE Equity Market Watch notes, NSE trading-system rules and SEBI’s investor education on shares. Always use the current official exchange page for a live security.
How to Read a Stock Quote: What It Shows at a Glance
A stock quote is a structured snapshot of market and company information for a listed security. The word “quote” may sound like one price, but a modern quote page can contain dozens of fields.
The easiest way to understand the page is to separate it into five layers.
| Layer | Main question | Typical fields |
|---|---|---|
| Identity and time | Am I reading the correct security and current data? | Company name, symbol, ISIN, series, exchange, status, timestamp |
| Price | What has traded during the session? | LTP, previous close, open, high, low, close, percentage change |
| Execution and activity | What orders and completed trading activity are visible? | Bid, ask, quantities, spread, market depth, volume, value, VWAP, tick size |
| Range and restrictions | What price boundaries or exchange controls matter? | 52-week high/low, upper/lower band, price band, volatility, ASM/GSM/T2T notices |
| Business and ownership | How does the quoted equity value relate to company data? | Market cap, P/E, EPS, debt/equity, promoter holding, industry |
Reading across layers prevents category mistakes. A bid quantity is not completed volume. A 52-week low is not intrinsic value. Market capitalisation is not the amount of cash inside the company. Promoter holding is not proof of management quality. A quote page places these figures together for convenience, but the reader must keep their meanings separate.
Stock quote, chart and financial statement are different tools
A quote page answers “what is displayed for this security now or for the latest session?” A chart arranges historical price and volume over time. A financial statement reports the company’s income, assets, liabilities and cash flows for a period or reporting date.
Use the quote for identity, price, execution conditions and a first valuation snapshot. Use How Are Share Prices Decided? for the exchange price-discovery mechanism. Use How to Analyse a Stock Technically for chart structure. Use the Fundamental Analysis hub for financial statements and business quality. Do not force one screen to answer all three jobs.
Live, delayed, provisional and historical data
Check how the platform labels its data. A broker terminal may receive live data under its arrangements. A public website may refresh differently. A closing figure may be provisional before final exchange files are processed. A historical series can also be adjusted for a split, bonus issue, rights issue or other event.
The timestamp is therefore part of the number. “₹256” without the security, source, exchange, series and time is incomplete evidence.
A disciplined 30-field reading sequence
This lesson covers the following 30 fields or checks:
- company or security name;
- trading symbol;
- ISIN;
- exchange and series;
- listing/trading status;
- quote timestamp;
- LTP;
- previous close;
- absolute and percentage change;
- open;
- intraday high;
- intraday low;
- official close;
- adjusted/base price where shown;
- best bid;
- best ask;
- bid–ask spread;
- market depth and quantities;
- traded volume;
- traded value;
- VWAP;
- tick size;
- 52-week high and low;
- upper and lower band;
- price-band or surveillance status;
- volatility;
- market capitalisation;
- P/E and EPS;
- debt-to-equity and reporting context; and
- promoter/public holding and pledge context.
The order matters. Identity comes before price; executable orders come before a trade decision; exchange restrictions come before position sizing; financial context comes before valuation conclusions.
Step 1: Verify Identity, Series, Source and Time
Before reading whether the share is up or down, confirm what security the page represents. Similar company names, renamed entities, multiple securities and different exchange series can create expensive mistakes.

1. Company or security name
Read the full listed name, not only the popular brand name. The listed entity may own several brands, and similarly named entities can be legally and financially different. If the page is for an ETF, REIT, InvIT, preference share, partly paid share or SME security, its behaviour and fields may differ from a normal listed equity share.
2. Trading symbol
The symbol is the exchange-facing short code used to identify the security in trading and market data. A symbol can differ across exchanges or change after a corporate action or name change. Never assume that a familiar abbreviation is permanently fixed.
3. ISIN
ISIN stands for International Securities Identification Number. It identifies a particular security issue. On an NSE quote page it commonly appears beside the listed name. The ISIN is especially useful when a company name or symbol has changed, because it helps distinguish the security being held or transferred.
Do not confuse a company with one security issued by that company. Different instruments can have different ISINs. Confirm the ISIN in the Demat holding, contract note and corporate-action communication when identity matters.
4. Exchange and series
The exchange identifies the trading venue. The series identifies the trading or settlement category on that venue. For example, Lesson 9 explains why the BE series on NSE is associated with trade-to-trade settlement and no netting. Read ASM, GSM and T2T Stocks before treating every familiar-looking order window as normal intraday trading.
Series is not a decorative code. It can affect settlement, permitted order behaviour, price bands or the assumptions a broker allows.
5. Listing status and trading status
“Listed” and “active” do not mean that a security is liquid, unrestricted or suitable. They indicate status within the exchange framework. Separately check suspensions, trading windows, surveillance lists, settlement category and order-book depth.
6. Timestamp and source
Record the observation time, time zone and source. A screenshot can be minutes, days or years old. Order-book quantities can change before an order reaches the exchange. Corporate filings and financial ratios may follow a different update cycle from live prices.
Use official exchange data to confirm current market fields and company filings to confirm corporate information. A broker display is convenient for placing orders, but a cropped social-media screenshot without source, date or symbol should not control an investment decision.
First identity checkpoint
Before moving to price, you should be able to state one complete sentence:
> “I am reading the equity security of the stated listed entity, identified by this symbol and ISIN, in this exchange series, from this source, as of this timestamp.”
If any part is missing, stop. The Brokerage Calculator can estimate transaction charges, but it cannot repair an order placed in the wrong security or series.
Step 2: Read Price Fields in the Correct Order
Quote pages place several price fields close together. The safest anchor is usually the previous close, followed by the day’s open, high, low and latest traded price.
7. LTP or latest traded price
LTP is the price of the most recent completed trade shown by the data source. It is backward-looking by at least one transaction. It does not guarantee that your next buy or sell will execute at that price.
If the LTP is ₹256 but the best available ask is ₹256.10, a market buy interacts with the sell orders available when it reaches the exchange. A larger order may fill across several prices. Read Bid Price, Ask Price, Spread and Order Book before using the LTP as an order price.
8. Previous close
The previous close is the reference closing value from the preceding relevant session, subject to exchange methodology and corporate-action adjustments. It commonly anchors the displayed daily change.
Previous close is not the same as yesterday’s last screenshot, and it is not necessarily the same as a raw historical close copied from another provider. On an ex-date, an adjusted or base price may be used for a meaningful comparison.
9. Absolute change and percentage change
The simplified daily calculations are:
Absolute change = Current displayed price − Previous close
Percentage change = (Current displayed price − Previous close) ÷ Previous close × 100
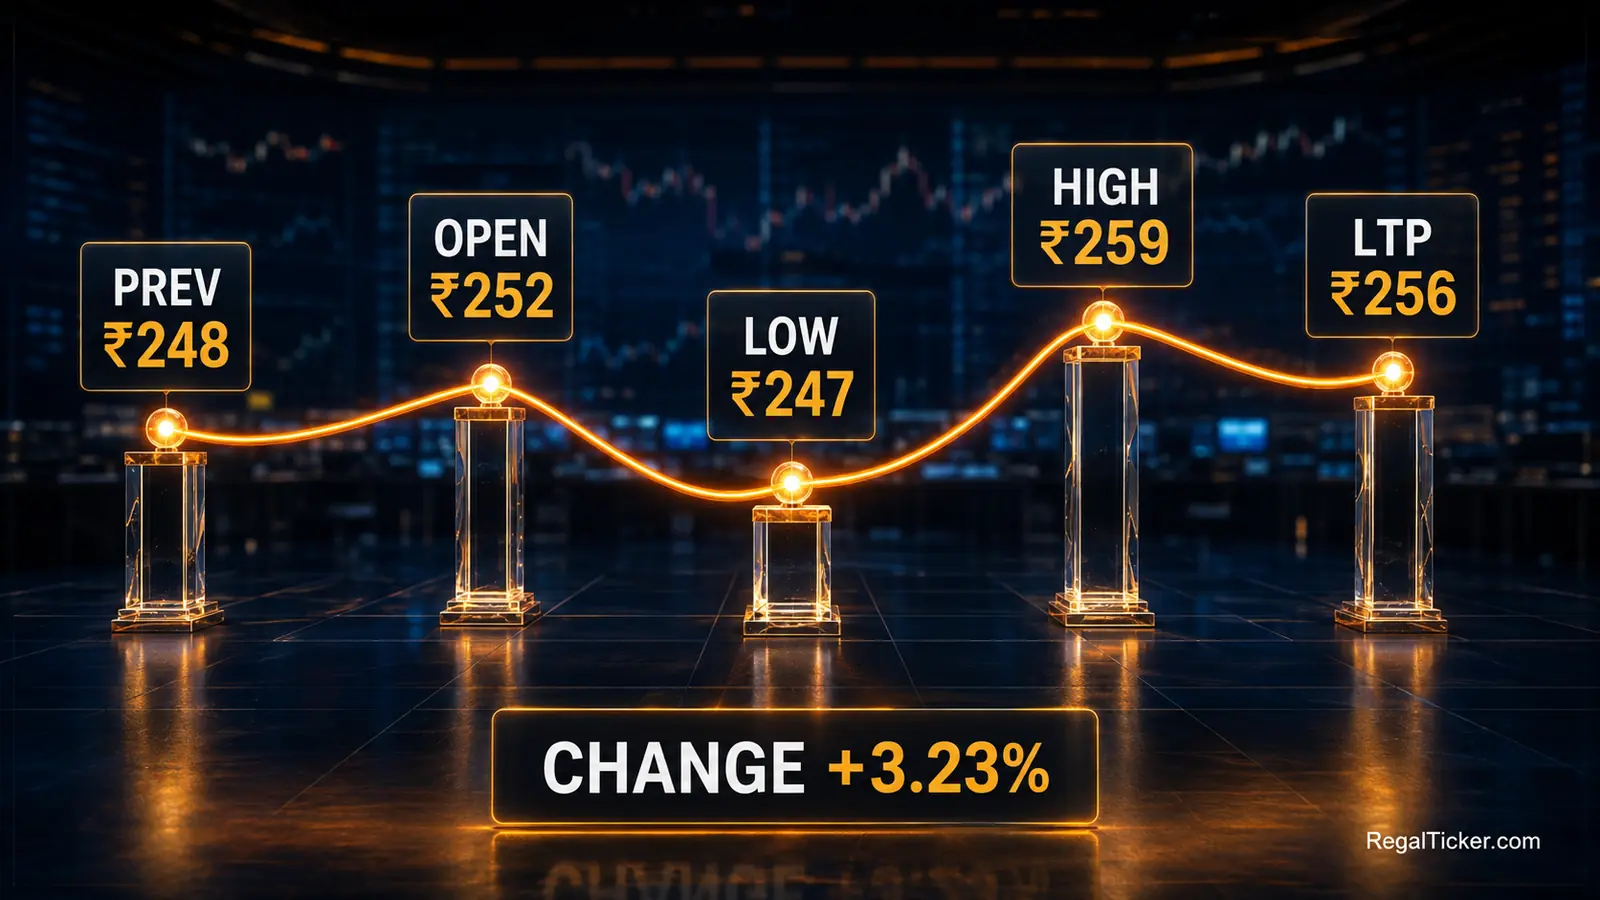
If the previous close is ₹248 and the LTP is ₹256:
Absolute change = ₹256 − ₹248 = ₹8
Percentage change = ₹8 ÷ ₹248 × 100 = 3.23% approximately
This 3.23% is a session comparison, not the return earned by every shareholder. Your personal result depends on purchase price, quantity, charges, dividends, taxes and cash-flow dates. Use the Stock Return Calculator for a completed holding and the Stock Average Calculator when purchases occurred at different prices.
10. Open
The open is the opening price established for the relevant session under the exchange process. It can differ from the previous close because information and orders accumulated while the normal market was closed.
A gap up or gap down describes that difference; it does not reveal what the price must do next. The opening process and continuous-market LTP answer different questions.
11 and 12. Intraday high and low
The high is the highest traded price recorded for the session in the stated dataset. The low is the lowest. They create the day’s traded range:
Intraday range = High − Low
If the high is ₹259 and the low is ₹247, the rupee range is ₹12. The current LTP can be anywhere inside that range. A wide range can reflect news, volatility or thin liquidity; it is not automatically an opportunity.
13. Close
The exchange’s closing price can be determined according to its closing methodology and may differ from the final visible LTP. Do not use “close,” “last trade” and “settlement price” as universal synonyms across every product or dataset.
For end-of-day return, chart and price-band work, use the relevant official close or adjusted reference specified by the source.
14. Adjusted price or base price
Corporate actions can change the number of shares, face value or economic reference price without creating the apparent gain or loss shown by an unadjusted comparison. NSE’s Equity Market Watch notes that percentage change and 52-week fields can be adjusted for specified corporate actions.
If a bonus issue or split occurs, use the Bonus Share Calculator or Stock Split Calculator to update quantity and theoretical reference. Then use the Bonus & Split Adjusted Return Calculator to compare economic performance across the event. Do not label an adjusted price drop a crash.
Price fields do not measure personal profit by themselves
Suppose a share rises 3.23% today, but you bought it at ₹290. Your holding can still be below cost. If you bought in several lots, calculate weighted average cost with the Stock Average Calculator. Add charges through the Brokerage Calculator. Measure the final result through the Stock Return Calculator, CAGR Calculator or XIRR Calculator according to the cash-flow pattern.
Step 3: Read Order Book, Volume and Execution Data
Price fields tell you what traded. Execution fields tell you what displayed orders are currently available and how the session’s completed trading accumulated.
15. Best bid
The best bid is the highest displayed price at which a buyer is currently willing to buy, with an associated quantity. It is an order, not a completed trade.
16. Best ask
The best ask is the lowest displayed price at which a seller is currently willing to sell, with an associated quantity. A market buy generally seeks available asks; a market sell seeks available bids, subject to order matching and rapid changes.
17. Bid–ask spread
Spread = Best ask − Best bid
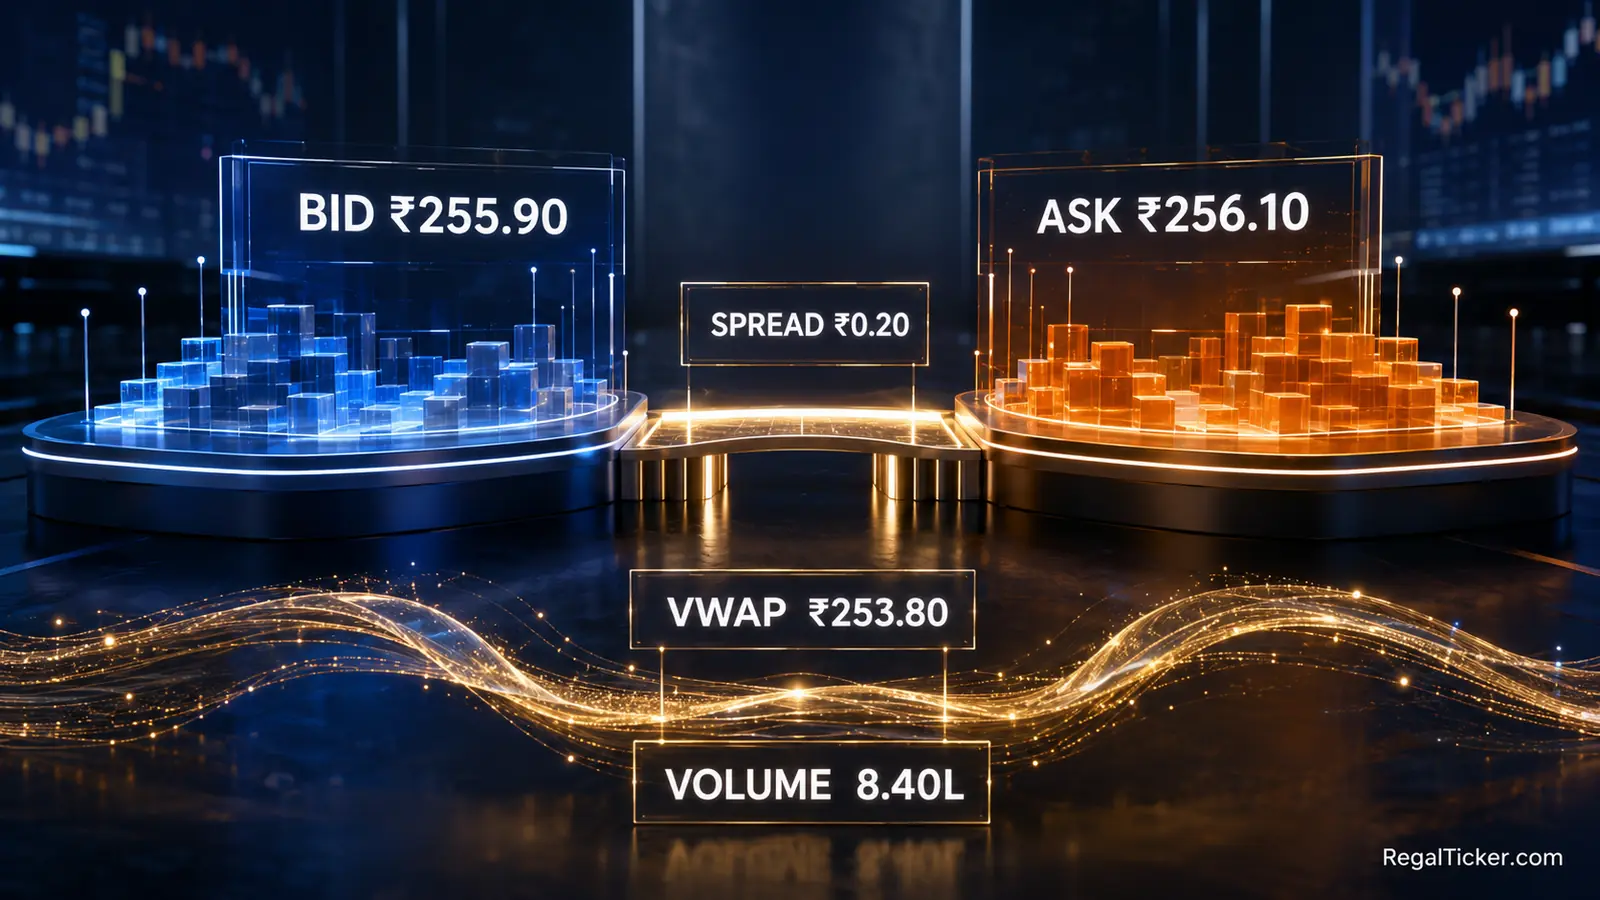
If the best bid is ₹255.90 and the best ask is ₹256.10, the displayed spread is ₹0.20. Relative to the midpoint near ₹256, that is about 0.078%.
A wider spread can increase the immediate cost of crossing the market. A narrow displayed spread can still widen or disappear. Estimate statutory and brokerage costs with the Brokerage Calculator, but remember that slippage depends on actual execution and is not fully captured by a static fee estimate.
18. Market depth and order quantities
Market depth shows several bid and ask levels with displayed quantities. It helps you see whether an order could consume more than one level and receive a weighted-average fill.
Depth is not a prediction. Orders can be added, modified, cancelled or matched. Large displayed buy quantity does not guarantee that the price will rise. Large sell quantity does not guarantee a fall. Lesson 5 explains the sharper version of this mistake at a circuit: an order queue does not guarantee execution.
19. Traded volume
Volume is the quantity traded during the stated period. It counts completed activity, not open orders. Compare like with like: today’s partial-session volume against a completed full day can mislead.
Volume does not tell you that there were “more buyers than sellers,” because every completed trade has both. It does not by itself distinguish accumulation from distribution. Read Trading Volume in the Stock Market for trend, delivery and confirmation limits.
20. Traded value
Traded value expresses completed activity in money terms. A simplified relationship is:
Traded value ≈ Sum of each executed quantity × its execution price
Two securities can show the same share volume but very different traded value because their prices differ. Do not compare raw volumes across companies without context.
21. VWAP
VWAP is the volume-weighted average price for the stated session or calculation window:
VWAP = Sum of price × volume for trades ÷ Total volume
VWAP is an average of completed trading, not the current executable price and not a forecast. A share can trade above or below VWAP. Check the data window before comparing values from different platforms.
22. Tick size
Tick size is the minimum permitted price increment for quoting the security in the relevant market. If the tick size is ₹0.05, an order price such as ₹256.03 may not be valid. Tick size affects order-entry granularity, not business value.
Use order type after reading liquidity
After checking bid, ask, spread and depth, choose the order instruction that fits the objective. The Market Order, Limit Order, Stop-Loss and Stop-Limit lesson explains the trade-off between execution priority and price control.
Before any planned trade, calculate downside and reward through the Risk-Reward Calculator, then estimate charges with the Brokerage Calculator. These tools improve arithmetic; neither guarantees a fill.
Step 4: Read Range, Price Bands and Surveillance Warnings
The next layer answers whether the security is near a historical extreme, constrained within a daily band or subject to an exchange surveillance or settlement measure.
23. 52-week high and low
The 52-week high and low show the highest and lowest prices in the provider’s rolling look-back dataset, subject to its adjustment methodology. They are reference points, not fair-value estimates.
Use 52 Week High and Low in the Stock Market to calculate percentage below the high and percentage above the low with the correct denominator. A stock near its high is not automatically expensive; a stock near its low is not automatically cheap.
24. Upper and lower band
Upper and lower bands show the permitted session range for a security when a price band applies. A share at the upper boundary may have buyers waiting without sellers. A share at the lower boundary may have sellers waiting without buyers.
Read Upper Circuit and Lower Circuit for the difference between a security-level price band and a market-wide circuit breaker. The existence of a band does not limit long-term loss and does not guarantee an exit.
25. Price-band and surveillance status
A quote page or broker warning can mention a series, surveillance measure, trade-to-trade status or special condition. Treat the label as a prompt to open the current exchange notice.
ASM, GSM and T2T Stocks explains why ASM and GSM are surveillance frameworks while T2T is a settlement category. A flag is not automatically a finding of fraud, and the absence of a flag is not a quality certificate.
26. Volatility
Volatility measures the variability of returns under the stated method and period. Daily and annualised volatility are not interchangeable. Historical volatility does not cap the next move, especially around results, corporate actions or unexpected news.
Use volatility as a risk input, not a direction signal. Test a planned entry, invalidation and target using the Risk-Reward Calculator. If the loss implied by a sensible invalidation is too large, reduce quantity or skip the trade; do not move the risk level merely to make the calculator look attractive.
Corporate actions can alter the screen
Before interpreting a discontinuity, check exchange announcements and the ex-date. Model the event using the relevant tool:
- Bonus Share Calculator for the new share quantity and theoretical ex-bonus reference;
- Stock Split Calculator for face value, quantity and theoretical adjusted price;
- Rights Issue Calculator for entitlement, subscription amount and theoretical ex-rights price;
- Buyback Acceptance Ratio Calculator for tender scenarios without predicting acceptance;
- Demerger Cost Basis Calculator after official cost-allocation guidance; and
- Bonus & Split Adjusted Return Calculator for comparable performance across quantity changes.
The quote shows the market result of the event and current trading. The corporate-action document defines entitlement and terms. Keep those sources separate.
Step 5: Read Market Cap, Ratios and Ownership Context
The lower part of a quote page can mix live market value with financial-statement and shareholding data. This is where timing and denominators become critical.
27. Market capitalisation
Market capitalisation = Current market price per equity share × Total outstanding equity shares
Market cap is the market value of the company’s equity at the quoted price. It is not revenue, profit, cash, enterprise value or the amount required to buy every share at one unchanged price.
If price changes while share count is constant, market cap changes. If the share count changes through an issue, buyback or corporate action, the denominator must also be updated.
28. P/E and EPS
EPS = Profit attributable to equity shareholders ÷ Weighted-average equity shares, subject to the reporting definition used.
P/E = Market price per share ÷ EPS
A quote page may show trailing, standalone, consolidated, adjusted or other provider-defined figures. A dash can mean that the ratio is unavailable or not meaningful, including when earnings are negative. It does not mean the share has “zero P/E.”
Read the reporting period before comparing companies. A live price can update every trade while EPS updates with financial results. The numerator and denominator therefore have different clocks.
29. Debt-to-equity and reporting context
Debt-to-equity compares specified debt with shareholder equity under the provider’s methodology. It is not a universal quality score. Banks and financial companies require sector-appropriate measures; capital-intensive and asset-light businesses also differ.
Confirm whether the data are consolidated or standalone, the period end, units, restatements and sector. A quote snapshot can direct you to the financial statement, but it should not replace it.
30. Promoter/public holding and pledge context
Promoter holding and public shareholding come from periodic shareholding disclosures, not live trading. The displayed percentage can change through promoter transactions, dilution, buybacks or reclassification.
Read Promoter Holding, Public Shareholding and Pledged Shares for the two pledge denominators: pledge as a percentage of promoter holding and pledged shares as a percentage of total equity. High promoter holding is not automatically good, and any pledge is not automatically fraud.
Institutional ownership is also different from daily institutional flow. FII vs DII explains why gross purchases minus gross sales produces net flow for a stated dataset, not the institution’s complete position or tomorrow’s market direction.
Dividend yield needs dividend and price context
If a quote page shows dividend yield, identify the dividend period and price used. A high yield can result from a large dividend, a falling price or both. Use the Dividend Calculator for expected cash income and yield from your cost or current price, but verify the declaration, record date and eligibility through official company information.
One ratio should lead to the source statement
Do not stop at the displayed P/E, debt ratio or promoter percentage. Open the underlying result, balance sheet, cash-flow statement and shareholding pattern. The quote is the index card; the filing is the evidence.
Worked Example: Read One Stock Quote from Top to Bottom
Consider a fictional equity security. The values below are educational and do not represent a real company, exchange quote or recommendation.
| Field | Fictional value |
|---|---|
| Previous close | ₹248.00 |
| Open | ₹252.00 |
| High | ₹259.00 |
| Low | ₹247.00 |
| LTP | ₹256.00 |
| Best bid / quantity | ₹255.90 / 1,200 shares |
| Best ask / quantity | ₹256.10 / 900 shares |
| VWAP | ₹253.80 |
| Traded volume | 8.40 lakh shares |
| 52-week high / low | ₹310 / ₹180 |
| Upper / lower band | ₹272.80 / ₹223.20 |
| EPS | ₹12.80 |
| Outstanding shares | 10 crore |
| Promoter holding | 54% |
Read identity and time first
Confirm the fictional page’s full security name, symbol, ISIN, exchange, series, status and timestamp. Because this example intentionally omits a real identity, it must never be used for an actual order.
Calculate the daily change
Change = ₹256 − ₹248 = ₹8
Percentage change = ₹8 ÷ ₹248 × 100 = 3.23% approximately
The share is up for the displayed session reference. This says nothing about an investor who bought at ₹280.
Read the intraday path
The open of ₹252 is ₹4 above the previous close. The price later traded as high as ₹259 and as low as ₹247. The ₹12 high–low range shows movement, not direction certainty. The LTP of ₹256 is below the high and above the VWAP.
Estimate the displayed spread
Spread = ₹256.10 − ₹255.90 = ₹0.20
A market buy of 100 shares may find enough displayed quantity at ₹256.10, but an order is never guaranteed from a static screenshot. A larger order can consume several ask levels.
Calculate market capitalisation
Market cap = ₹256 × 10 crore shares = ₹2,560 crore
This is equity market value. It is not the company’s cash balance or enterprise value.
Calculate the simplified P/E
P/E = ₹256 ÷ ₹12.80 = 20
Before comparing the 20× multiple, confirm whether the ₹12.80 EPS is trailing, consolidated, attributable and adjusted on a comparable share count.
Measure position within the 52-week range
Percentage below high = (₹310 − ₹256) ÷ ₹310 × 100 = 17.42%
Percentage above low = (₹256 − ₹180) ÷ ₹180 × 100 = 42.22%
The different bases explain why these two percentages do not sum to 100. Neither percentage determines fair value.
Convert the quote into personal arithmetic
Suppose an investor considers 100 shares at ₹256.10 with an invalidation at ₹242 and a hypothetical objective at ₹285.
- Planned capital before charges: ₹25,610.
- Downside per share: ₹14.10.
- Planned downside for 100 shares: ₹1,410 before costs and slippage.
- Potential price difference to objective: ₹28.90 per share.
- Potential price difference for 100 shares: ₹2,890 before costs and tax.
- Simplified reward-to-risk ratio: ₹2,890 ÷ ₹1,410 = 2.05 approximately.
Run the exact entry, stop and objective through the Risk-Reward Calculator. Add exchange and brokerage costs using the Brokerage Calculator. If purchases occur in several lots, use the Stock Average Calculator. After exit, use the Stock Return Calculator and Capital Gains Tax Calculator with the actual transaction and holding-period facts.
The quote supplies market inputs. The calculators organise personal arithmetic. Neither supplies a recommendation.
Use All 19 Regal Ticker Calculators After Reading the Quote
Heavy internal linking works only when each tool answers a real next question. Use this map after you identify what the quote cannot calculate for you.
Cost, risk, return and tax calculators
| Investor question | Calculator | Correct use after reading the quote |
|---|---|---|
| What is my weighted average purchase price? | Stock Average Calculator | Enter completed lots; do not average an unexecuted order queue. |
| What is my total price-and-income return? | Stock Return Calculator | Use actual buy/sell values, quantity, dividends and costs. |
| What annualised rate connects one start and one end value? | CAGR Calculator | Use for one lump-sum start/end path, not irregular deposits. |
| What return applies to dated irregular cash flows? | XIRR Calculator | Record dated buys, sells, dividends and other flows. |
| What dividend cash flow and yield may apply? | Dividend Calculator | Verify declared dividend and eligibility before calculation. |
| What is planned reward relative to downside? | Risk-Reward Calculator | Use the intended entry, invalidation and objective; separately assess liquidity. |
| What transaction charges and break-even may apply? | Brokerage Calculator | Use intended product and turnover; slippage remains execution-dependent. |
| What capital-gains tax may apply? | Capital Gains Tax Calculator | Use realised gain and correct holding-period inputs under current law. |
A strong workflow is: inspect bid, ask and depth; test downside in the Risk-Reward Calculator; estimate charges in the Brokerage Calculator; record fills in the Stock Average Calculator; and measure the completed result through the Stock Return Calculator. Use the XIRR Calculator for multiple dated flows and the CAGR Calculator only when one start/end structure fits.
Corporate-action calculators
| Quote-page event or adjustment | Calculator | Correct use |
|---|---|---|
| Bonus issue changes quantity and reference price | Bonus Share Calculator | Model the bonus ratio using official terms. |
| Split changes face value, quantity and theoretical price | Stock Split Calculator | Separate denomination change from economic return. |
| Rights issue changes entitlement and theoretical ex-rights price | Rights Issue Calculator | Use official ratio, issue price and pre-rights inputs. |
| Tender buyback creates an acceptance scenario | Buyback Acceptance Ratio Calculator | Model assumptions without predicting final acceptance. |
| Bonus/split creates an apparent chart discontinuity | Bonus & Split Adjusted Return Calculator | Compare value before and after quantity adjustment. |
| Demerger requires cost allocation | Demerger Cost Basis Calculator | Wait for official allocation guidance before entering percentages. |
Use the Bonus Share Calculator, Stock Split Calculator or Rights Issue Calculator before interpreting an ex-date screen. Use the Buyback Acceptance Ratio Calculator for scenario analysis and the Demerger Cost Basis Calculator only after official cost guidance. Finish with the Bonus & Split Adjusted Return Calculator when a raw chart no longer represents comparable per-share history.
Long-term planning calculators
| Planning question | Calculator | Why a live quote is insufficient |
|---|---|---|
| What may periodic investing grow to? | SIP Calculator | One stock’s current price does not define a diversified long-term return. |
| What monthly SIP may target a future goal? | Goal SIP Calculator | The required contribution depends on goal, time and assumed return. |
| What may one lump sum grow to? | Lumpsum Calculator | Compounding is a scenario, not a forecast from today’s LTP. |
| How may withdrawals affect a corpus? | SWP Calculator | A withdrawal plan needs corpus and return assumptions, not one quote. |
Use the SIP Calculator, Goal SIP Calculator, Lumpsum Calculator and SWP Calculator to keep financial goals separate from a single day’s market movement. None of these tools promises a return.
Explore the complete Regal Ticker Investor Tools hub whenever the question changes from “what does this quote field mean?” to “what do these numbers mean for my cost, return, tax, corporate action or goal?”
How to Read a Stock Quote FAQs and Final Checklist

What is a stock quote?
A stock quote is a structured snapshot for a listed security. It can include the latest traded price, previous close, open, high, low, order book, volume, VWAP, price bands, 52-week range, market capitalisation, ratios, ownership data, security identifiers and timestamp.
What does LTP mean in a stock quote?
LTP means latest or last traded price: the price of the most recent completed trade shown by the source. It is not a guarantee that the next order will execute at that price.
Is LTP the same as closing price?
Not necessarily. LTP is the most recent completed trade. The official closing price can be determined under an exchange closing methodology. Check the field label and source rather than using the terms interchangeably.
How is daily percentage change calculated?
The simplified calculation is `(current displayed price − previous close) ÷ previous close × 100`. On corporate-action dates, the exchange may use an adjusted or base reference. Use the official displayed reference.
What is the difference between volume and market depth?
Volume measures completed trading during the stated period. Market depth shows currently displayed bid and ask orders at several price levels. Orders can change or be cancelled; they are not completed volume.
What is VWAP in a stock quote?
VWAP is the volume-weighted average price over the stated session or window. It summarises completed trades by weighting prices by volume. It is not the current executable price and does not predict direction.
Does a narrow bid–ask spread guarantee a good fill?
No. It describes the displayed best prices at that instant. Quantities, deeper levels, latency and rapid order changes can affect the actual fill. Read both price and depth.
Is a stock near its 52-week low cheap?
No. The 52-week low is a historical price reference, not an estimate of intrinsic value. Investigate business performance, financial position, governance, dilution and the reason for the decline.
Does hitting an upper circuit mean my buy order will execute?
No. If buyers are queued at the upper boundary and sellers are absent, a buy order can remain unmatched. Price priority, time priority and available counterparties govern execution.
Why is P/E sometimes blank or shown as a dash?
The ratio may be unavailable or not meaningful, including when earnings are negative. Check the provider methodology, reporting period and underlying EPS instead of reading a dash as zero.
Can I use a stock quote to decide whether to buy?
A quote can confirm identity, price, liquidity, restrictions and a valuation snapshot. It cannot establish business quality, fair value, suitability or future return on its own. Read filings, risks and your own financial plan.
Which calculator should I use first after reading a quote?
For a proposed trade, begin with the Risk-Reward Calculator and Brokerage Calculator. For completed purchases, use the Stock Average Calculator. For a completed investment result, use the Stock Return Calculator, CAGR Calculator or XIRR Calculator according to the cash-flow pattern.
Final 15-check stock quote reading order
- Confirm the full security name.
- Match symbol and ISIN.
- Confirm exchange and series.
- Check listing, trading and surveillance status.
- Record the source and timestamp.
- Use previous close as the stated daily reference.
- Separate open, high, low, LTP and official close.
- Recalculate the percentage change when needed.
- Compare LTP with bid, ask and depth before choosing an order.
- Read volume, traded value and VWAP as completed activity, not prediction.
- Check tick size, price band and settlement restrictions.
- Treat the 52-week range as history, not fair value.
- Verify corporate-action adjustments before comparing prices.
- Check the reporting period and denominator behind market cap, EPS, P/E, debt and ownership figures.
- Move from market facts to personal arithmetic using the correct Regal Ticker calculator.
Final takeaway
To understand how to read a stock quote, follow one consistent order: identity and time first, price second, execution third, restrictions fourth, and business context fifth. Never begin with the green or red percentage and build a story around it.
The quote tells you what security and market data are displayed. The order book helps you understand possible execution. Exchange notices define restrictions. Company filings provide business evidence. The Regal Ticker Investor Tools hub converts relevant inputs into personal cost, return, tax, corporate-action and planning calculations.
This completes the ten-lesson Market Terminology learning hub. Use Stock Market Terminology: 50 Essential Terms when you need a definition, then return to this stock-quote workflow when you need to apply the language on a real market screen.