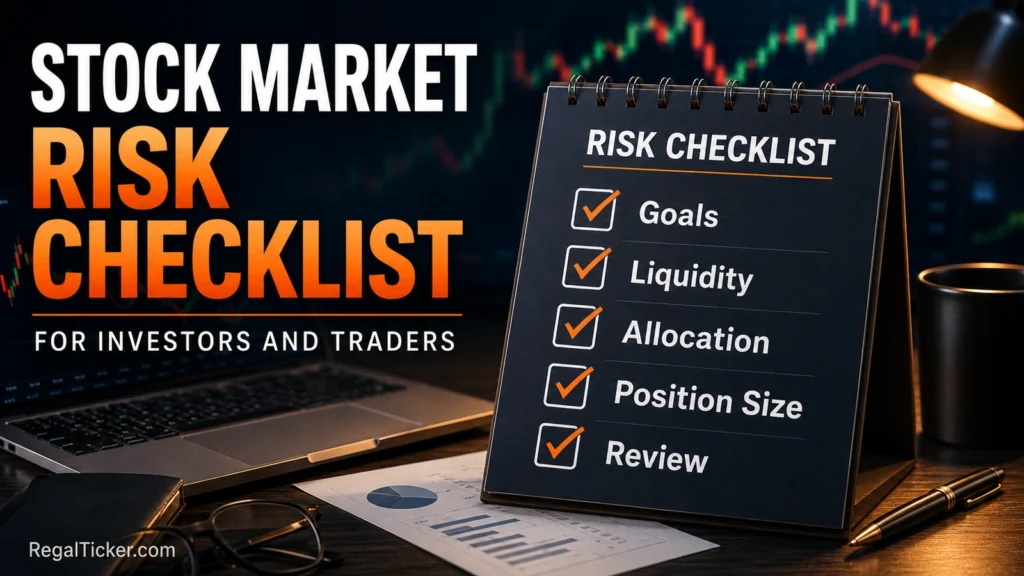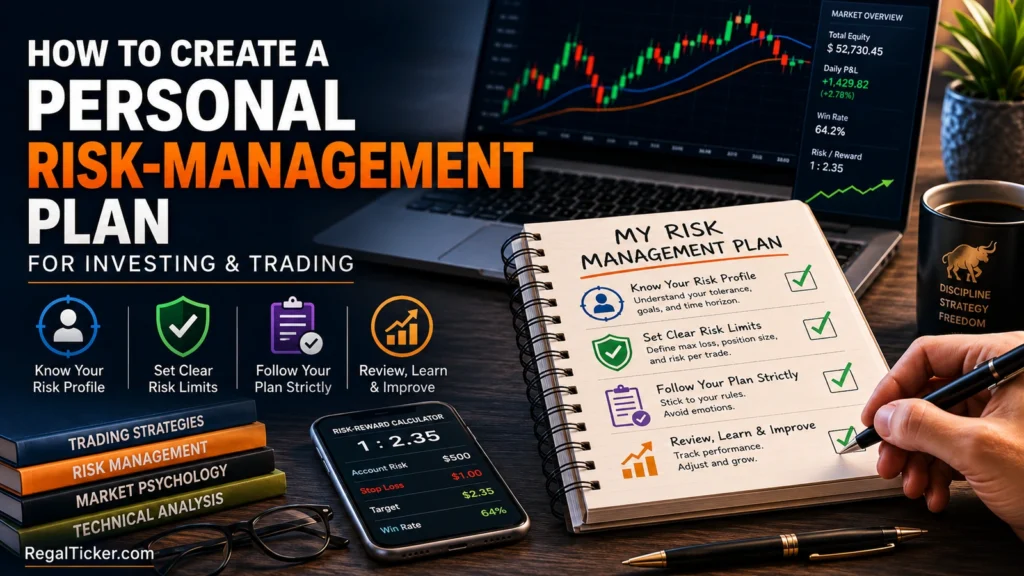

Risk management in stock market investing and trading is the process of deciding how much capital may be exposed, what could make the decision wrong, how losses will be controlled and when the position must be reviewed or exited. It does not eliminate risk, guarantee profits or predict the next market move. Its purpose is to prevent one mistake, one company, one market event or one emotional decision from causing unacceptable damage.
Beginners often focus almost entirely on finding the “right” stock or entry price. That is only one part of the decision. Even a strong company can be bought at an excessive valuation. A valid chart setup can fail. A liquid share can gap sharply after an unexpected announcement. A diversified portfolio can become concentrated without the investor noticing. A stop-loss can execute below its trigger during a fast move.
Good risk management starts before the order is placed. It asks:
- What is the purpose and time horizon of this position?
- Which specific risks are present?
- What evidence supports the investment thesis or trading setup?
- What event or price behaviour would invalidate it?
- How much money can be lost without disturbing the overall financial plan?
- How large should the position be?
- How does it change total portfolio exposure?
- Can the position be exited reasonably in normal and stressed conditions?
- How will the decision be recorded and reviewed?
This first lesson in the Risk Management learning hub provides the complete framework. Later lessons will examine position sizing, risk–reward ratio, stop-loss orders, diversification, drawdown and trading psychology in greater depth.
What Is Risk Management in Stock Market?
Risk is the possibility that the actual outcome will be worse than expected. In the stock market, that can mean losing capital, earning less than required for a financial goal, facing a loss larger than planned, being unable to exit at a reasonable price or making decisions under emotional pressure.
Risk management is therefore broader than placing a stop-loss. It combines:
- risk identification: recognising what can go wrong;
- risk measurement: estimating exposure and possible loss;
- risk control: limiting position and portfolio concentration;
- risk response: defining exits, reviews and contingency actions;
- risk monitoring: checking whether the original assumptions still hold.
SEBI’s investor guidance on securities-market risks tells investors to identify their goals, objectives and risk appetite before investing. This is the correct starting point because the same market position can be tolerable for one person and unsuitable for another.
Risk Management Is Not Risk Avoidance
Every market return requires accepting some uncertainty. Holding cash avoids short-term equity volatility but introduces inflation and opportunity risk. A diversified equity portfolio reduces company-specific exposure but remains vulnerable to market-wide falls. A stop-loss limits the planned tolerance for a trade but cannot guarantee the exact execution price.
The aim is not “zero risk.” The aim is deliberate risk:
- understand the source;
- decide whether it is necessary;
- size it appropriately;
- create a response if the adverse outcome occurs.
Investors and Traders Manage Risk Differently
The basic principles are shared, but the controls differ because the time horizon and decision basis differ.
| Area | Long-term investor | Short-term trader |
|---|---|---|
| Decision basis | Business quality, financials, valuation and long-term thesis | Price structure, setup, timeframe and execution |
| Main invalidation | Thesis deterioration, governance concern, excessive valuation or portfolio mismatch | Price or setup invalidation on the chosen timeframe |
| Position control | Allocation, diversification and rebalancing | Risk budget, stop distance and position size |
| Review frequency | Periodic and event-driven | Trade-by-trade and session-by-session |
| Major behavioural danger | Attachment to the company and averaging without evidence | Chasing, revenge trading and moving stops |
| Typical cost concern | Taxes, turnover and long holding-period opportunity cost | Brokerage, taxes, spread, slippage and frequent turnover |
First decide whether the position is an investment or a trade. Investing vs Trading in the Stock Market explains why silently changing the label after a loss destroys the original risk plan.
Risk and Volatility Are Related but Not Identical
Volatility measures the size and frequency of price changes. Risk depends on how those changes interact with the position, time horizon, leverage, liquidity and financial goal.
A volatile share held in a small, researched allocation may create less portfolio danger than a seemingly stable share representing 60% of total capital. Conversely, a long-term investor who needs the money next month may face high practical risk even in a diversified equity portfolio because the time horizon is unsuitable.
Identify the Risks Before You Invest or Trade
A useful risk plan names the risks instead of using the vague statement “the market can fall.” Different risks require different controls.
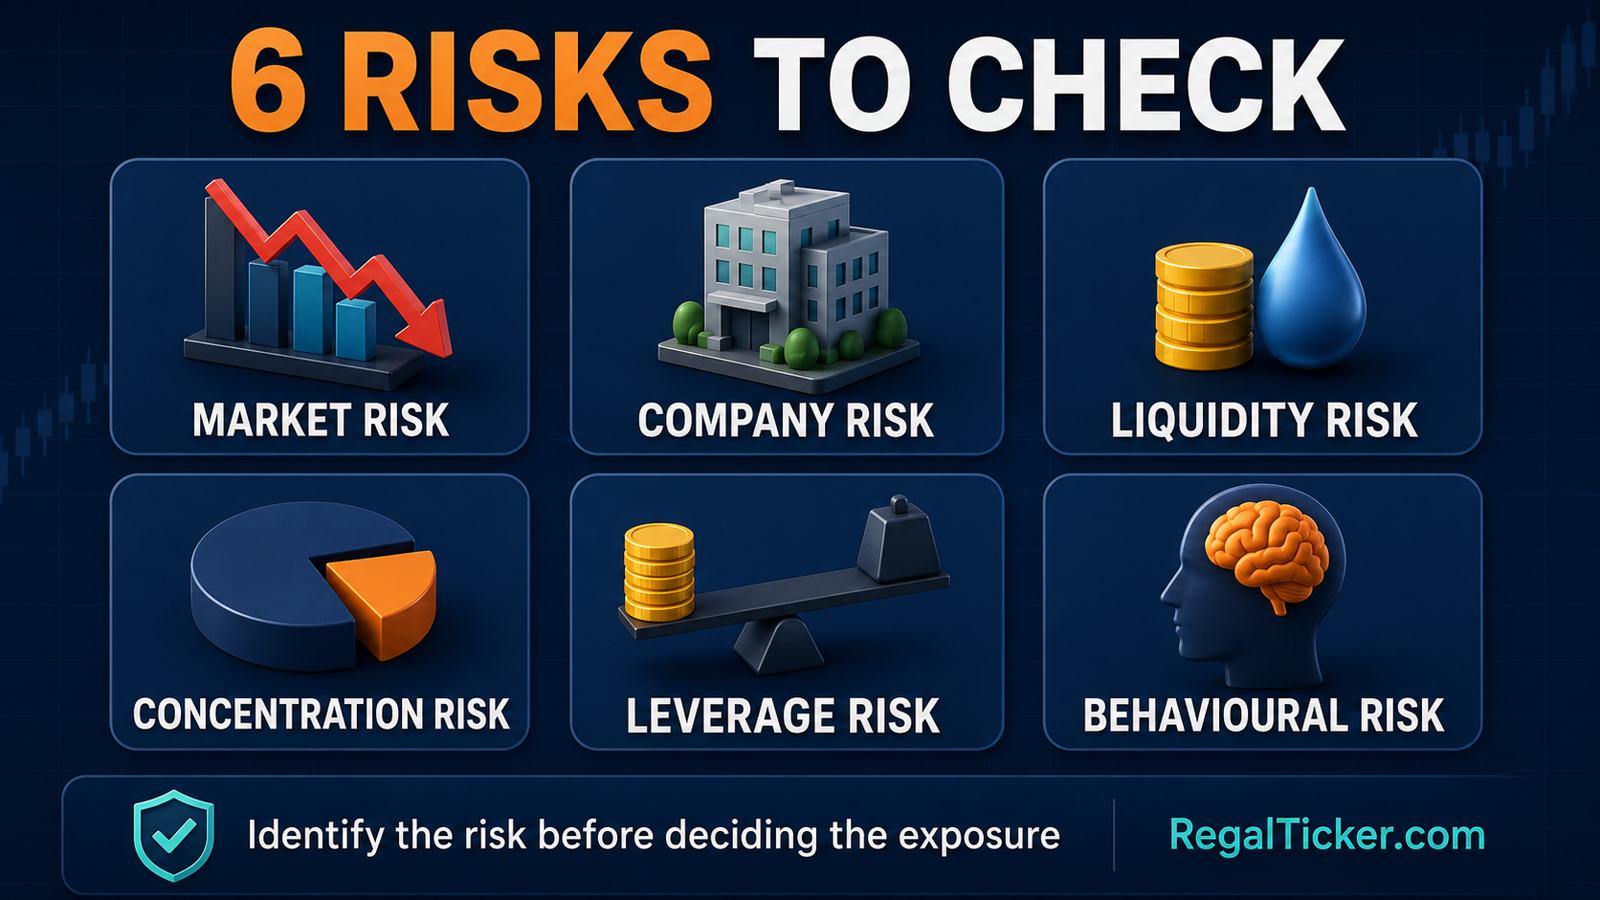
Six Risks Every Beginner Should Check
| Risk | What it means | Example | Possible control |
|---|---|---|---|
| Market risk | The broad market or economy affects many securities together | Index falls during a global shock | Suitable allocation, time horizon and liquidity reserve |
| Company risk | A company-specific event damages the thesis | Weak governance, debt stress or loss of a major customer | Research, diversification and thesis review |
| Liquidity risk | A position cannot be exited near the expected price | Wide spread or low trading volume | Smaller exposure, limit orders and liquidity screening |
| Concentration risk | Too much capital depends on one company, sector or factor | Several bank stocks dominate the portfolio | Exposure limits and genuine diversification |
| Leverage risk | Borrowed or derivative exposure magnifies losses | Margin requirement rises after an adverse move | Avoid or strictly limit leverage; maintain buffers |
| Behavioural risk | Emotion overrides the written plan | Chasing, panic selling or revenge trading | Predefined rules, journal, pause and review |
These categories can overlap. A small company may have weak liquidity, high price volatility and business concentration. A leveraged position in that share combines company, liquidity and leverage risk at the same time.
Systematic and Unsystematic Risk
Systematic risk affects much of the market. Interest-rate changes, recessions, geopolitical shocks and broad liquidity events can move many securities together. Diversification cannot fully remove this risk.
Unsystematic risk is more specific to a company, industry or security. Product failure, fraud, a factory disruption or a sector regulation may hurt one part of the portfolio more than the rest. This is the risk diversification can reduce more effectively.
SEBI’s guide to managing investment risks makes the same practical distinction: diversified, high-quality assets can help protect a portfolio from many risks, but market-wide price volatility cannot be diversified away.
Event and Gap Risk
Earnings, corporate actions, regulatory announcements, court decisions, management changes and unexpected macroeconomic news can cause price to open far away from the previous close.
Suppose a trade is entered at ₹250 with an intended exit at ₹242.50. If unexpected news causes the share to open at ₹230, the loss can exceed the planned ₹7.50 per share. The stop instruction may activate, but there may be no buyer at the trigger price.
Controls include:
- reducing size before a known high-impact event;
- avoiding a position when the possible gap is unacceptable;
- limiting portfolio exposure to one event;
- maintaining cash and margin buffers;
- understanding that a stop price is not a guaranteed fill price.
Time-Horizon Risk
Equities can be unsuitable for money needed soon. A sound company may still fall during the exact period when the investor needs cash. Matching the investment horizon to the financial goal is therefore a risk-control decision, not merely a return decision.
Do not use emergency funds, short-term obligations or borrowed money for exposure that may require time to recover. A market decline should not force the sale of an otherwise suitable investment because essential cash was committed to the wrong horizon.
Set Risk Boundaries Before Taking a Position
A risk boundary converts a general intention—“I do not want a big loss”—into a decision rule.
Separate Risk Appetite, Capacity and Tolerance
These terms are related but not interchangeable:
- Risk appetite is how much uncertainty a person is willing to accept.
- Risk capacity is how much loss the financial position can actually absorb.
- Risk tolerance is the emotional ability to remain consistent when prices move adversely.
A beginner may have a high appetite after seeing recent gains but a low capacity because the capital is needed for education, housing or emergency expenses. Capacity should place the harder limit.
Define the Purpose and Time Horizon
Before selecting a stock, write one sentence:
> This position is a long-term investment / swing trade / intraday trade intended for __, with a review horizon of __.
That sentence determines which evidence matters. A quarterly earnings miss may require a fundamental-thesis review but may not automatically end a five-year investment. A break below a predefined support level may invalidate a swing setup even if the company remains fundamentally strong.
Use the Fundamental Analysis hub for business and valuation research and the Technical Analysis hub for price, trend and setup analysis. Neither method removes the need for risk control.
Define Maximum Acceptable Exposure
Set boundaries at more than one level:
- maximum capital in one position;
- maximum capital in one company group;
- maximum exposure to one sector or theme;
- maximum planned loss on one trade;
- maximum total open risk across active trades;
- maximum portfolio drawdown that triggers a formal review;
- maximum leverage, preferably zero for an unprepared beginner.
There is no universal percentage that fits every person. A rule copied from social media may ignore income stability, dependants, liabilities, time horizon, liquidity and experience. Use percentages as deliberate policy choices, not market commandments.
Keep an Emergency and Opportunity Buffer
Cash has two risk-management roles:
- it prevents forced selling when essential expenses arise;
- it preserves flexibility when attractive opportunities appear.
This does not mean every investor needs the same cash allocation. It means the stock-market portfolio should not be responsible for tomorrow’s unavoidable bills.
Connect Risk Budget, Stop Distance and Position Size
Position size should come from the risk plan, not from the amount of cash available in the account.
The Capital–Risk Chain
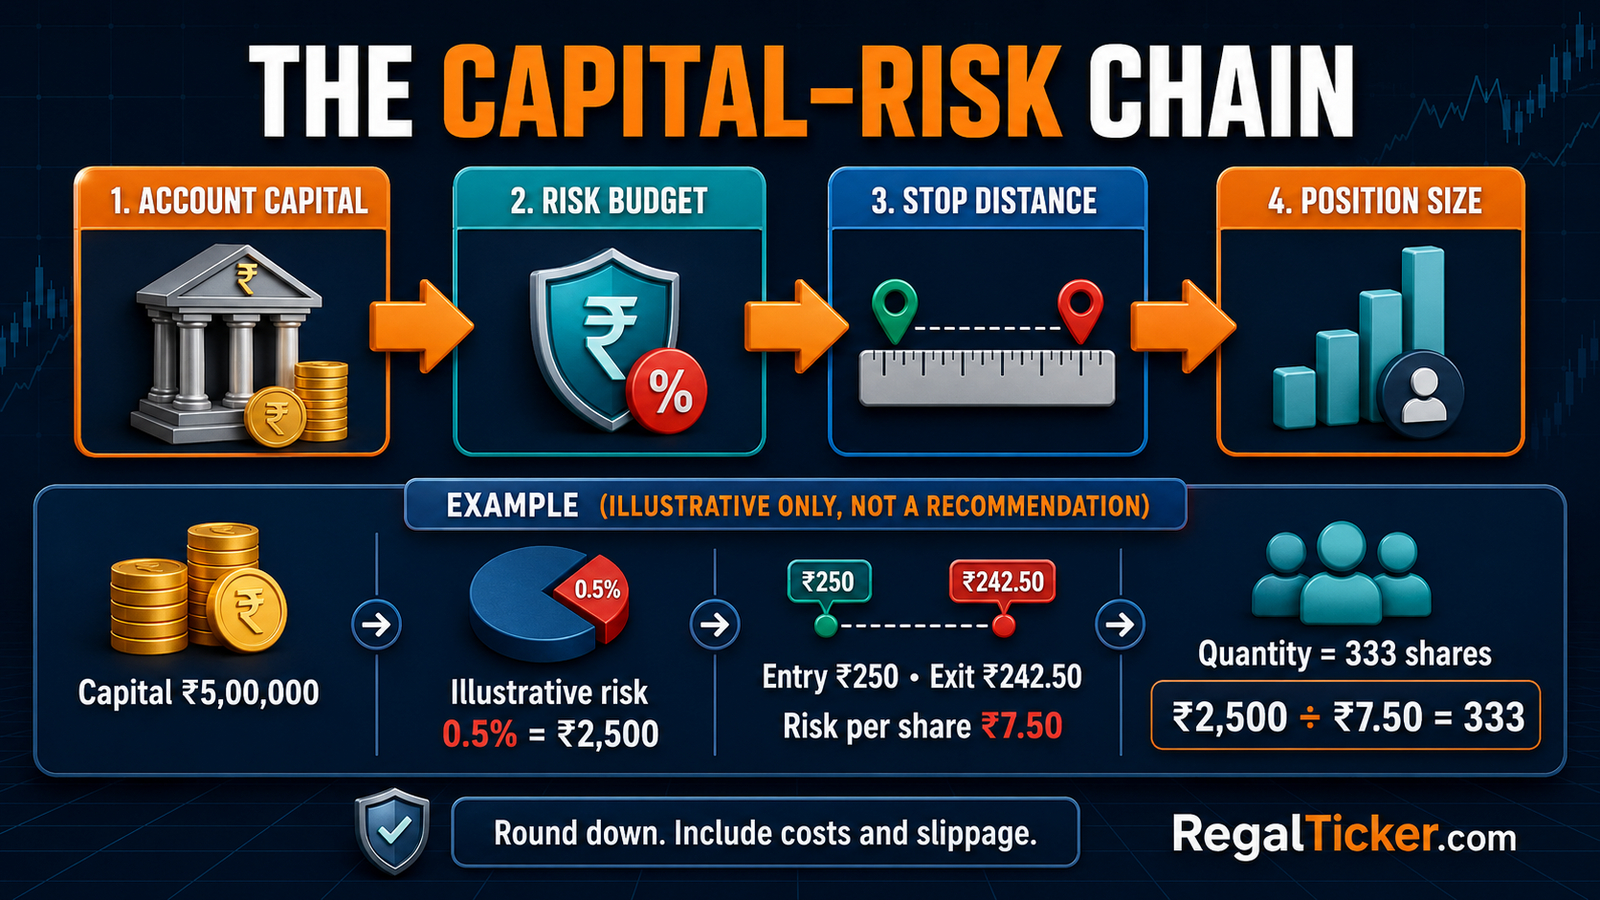
For a price-defined trade, the logical sequence is:
- determine total account capital;
- choose the maximum planned rupee loss for the trade;
- identify the setup’s invalidation level;
- calculate the risk per share;
- divide the risk budget by risk per share;
- round down and adjust for costs, slippage and portfolio limits.
The basic educational formula is:
Position quantity = Maximum planned rupee loss ÷ Risk per share
where:
Risk per share = Entry price − Planned exit price
for a long position, before costs and possible slippage.
Worked Example
Assume:
- account capital: ₹5,00,000;
- illustrative risk budget: 0.5% or ₹2,500;
- planned entry: ₹250;
- setup invalidation and intended exit: ₹242.50;
- risk per share: ₹7.50.
Then:
₹2,500 ÷ ₹7.50 = 333.33 shares
The quantity is rounded down to 333 shares. The approximate position value is ₹83,250, but the planned price risk is about ₹2,497.50 before costs and slippage.
This 0.5% figure is only an illustration. For the complete position-sizing method, formulas and worked examples, read Position Sizing in Stock Market: Formula, Methods and Examples. Use the Risk-Reward Calculator only after defining the capital at risk, entry price and invalidation level.
Why a Wider Stop Requires a Smaller Position
Suppose the same ₹2,500 risk budget is used:
| Risk per share | Maximum quantity before costs | Approximate planned price risk |
|---|---|---|
| ₹5 | 500 shares | ₹2,500 |
| ₹7.50 | 333 shares | ₹2,497.50 |
| ₹10 | 250 shares | ₹2,500 |
| ₹20 | 125 shares | ₹2,500 |
The wider the invalidation distance, the smaller the position must become if the risk budget remains unchanged. Increasing the quantity because the stop feels “too far” reverses the logic and increases the planned loss.
Position Size Is Not the Same as Portfolio Allocation
A long-term investor may not use a tight price stop. The risk decision can instead be expressed through portfolio allocation, thesis invalidation and rebalancing rules.
For example, an investor may limit a newly researched small company to a modest initial allocation, increase it only if evidence improves and cap total small-cap or sector exposure. The exact policy depends on the financial plan; the principle is that uncertainty should influence allocation.
Do Not Ignore Correlated Open Risk
Five trades risking ₹2,500 each do not necessarily represent five independent risks. If all five are in the same sector or depend on the same market event, the combined adverse move may reach ₹12,500 or more at once—especially if gaps and slippage occur.
Calculate both:
- risk on each position; and
- total risk if correlated positions fail together.
Control Risk Across the Whole Portfolio
Portfolio risk is not simply the average of individual-stock risk. Position weights and correlations matter.
Diversification Must Separate Risk Drivers
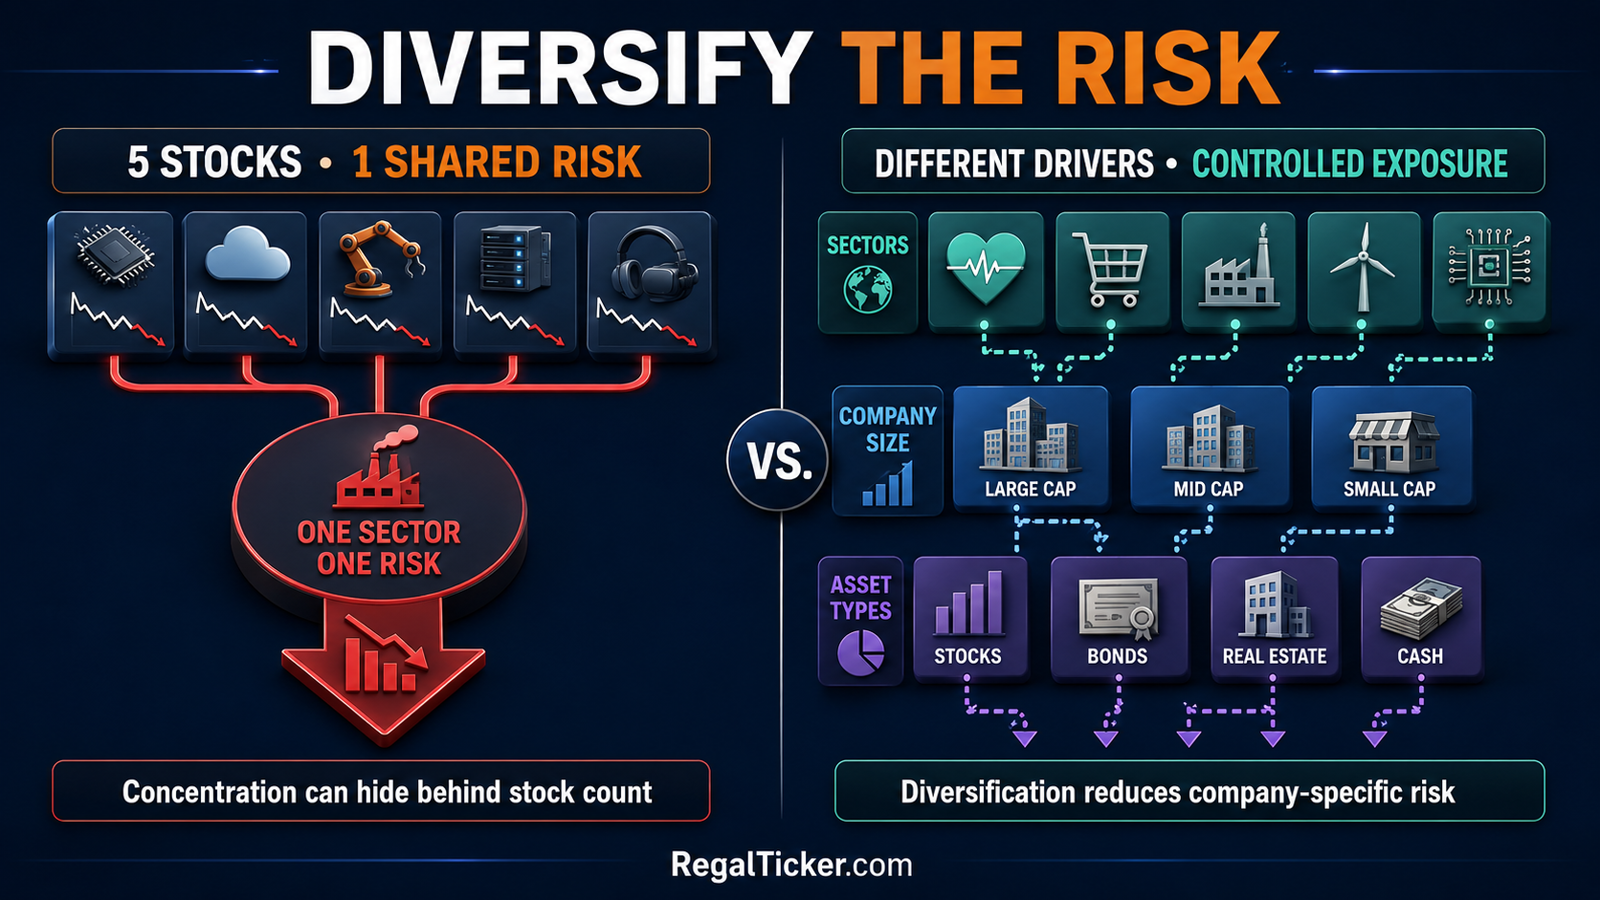
Owning five banks is not the same as owning five independent exposures. All may respond to credit conditions, interest rates, regulation and system liquidity. Likewise, holding several companies from one business group can create shared governance and financing risk.
Useful diversification can spread exposure across:
- companies and promoters;
- sectors and industries;
- business models and revenue drivers;
- company sizes;
- domestic and, where suitable and permitted, international markets;
- asset classes;
- investment styles and time horizons.
NSE’s explanation of index diversification notes that diversification reduces the effect of individual-stock fluctuations, while common market factors remain: NSE — FAQs About Indices. This is why diversification reduces company-specific risk but cannot guarantee against portfolio loss.
Watch Position Weights After Price Changes
A successful position can grow into an unintended concentration. If one stock rises much faster than the rest, its portfolio weight and influence increase.
Rebalancing is not automatically “selling a winner.” It is the process of comparing the current portfolio with the chosen risk policy. Possible responses include trimming, adding to other exposures, directing new savings elsewhere or consciously accepting the higher concentration after review.
Avoid False Diversification
Common forms include:
- many stocks from one sector;
- multiple mutual funds holding the same large companies;
- several positions linked to one commodity price;
- different companies under the same promoter group;
- a stock portfolio plus employment income from the same industry;
- multiple trading setups that all depend on the index moving in one direction.
Count independent risk drivers, not only security names.
Consider Liquidity at Portfolio Level
An investor may be able to exit one small position easily but not several illiquid positions during market stress. Large orders can consume available bids and receive progressively worse prices.
Before increasing exposure, inspect volume, spread and order-book depth. Bid Price, Ask Price, Spread and Order Book Explained shows how liquidity affects execution.
Plan Exits, Orders and Real-World Execution
An exit plan answers what will cause action. It should be written when reasoning is calm, not invented after the loss becomes uncomfortable.
Price Stop, Thesis Stop and Time Stop
Different decisions require different exits:
- Price stop: a predefined market level invalidates a technical setup.
- Thesis stop: evidence contradicts the investment case—for example, governance deterioration or a structural business change.
- Time stop: the expected development does not occur within the planned period, tying up capital without confirmation.
- Portfolio stop: the position breaches an allocation or concentration rule.
These can coexist. A trader may have a price stop and a time stop. An investor may use thesis and portfolio rules rather than a narrow daily-price trigger.
A Stop-Loss Is an Order, Not a Guarantee
A stop-loss order activates after its trigger condition is reached. The eventual execution depends on the order type and available market liquidity. During a gap or fast move, the fill can be worse than the trigger.
Review Market Order, Limit Order, Stop-Loss and Stop-Limit Order before relying on an order you do not fully understand.
Place Invalidation Before Calculating Quantity
Do not choose a position first and then move the stop merely to make the loss amount acceptable. The correct order is:
- identify where the setup or thesis becomes wrong;
- calculate the distance to that point;
- reduce quantity until the loss fits the risk budget.
If the required quantity is too small to be practical, skip the trade. If the distance creates excessive gap or slippage exposure, skip the trade. “No position” is a valid risk-management decision.
Include Costs and Slippage
Gross price risk is not total risk. Include:
- brokerage and statutory charges;
- bid–ask spread;
- market impact;
- slippage between trigger and execution;
- taxes;
- borrowing or funding costs where applicable.
Frequent trading can turn a marginal gross strategy into a losing net result. Costs also increase when liquidity is poor or the position is large relative to normal volume.
Manage Drawdowns, Leverage and Behaviour
A drawdown is the decline from a portfolio’s previous peak to a later trough.
Understand Recovery Mathematics
Loss and recovery percentages are asymmetric because the recovery starts from a smaller capital base.
| Drawdown | Capital remaining from ₹1,00,000 | Gain required to return to ₹1,00,000 |
|---|---|---|
| 10% | ₹90,000 | 11.1% |
| 20% | ₹80,000 | 25% |
| 30% | ₹70,000 | 42.9% |
| 50% | ₹50,000 | 100% |
This is why capital protection matters. Avoiding an extreme drawdown can be more important than finding the next high-return idea.
Set a Drawdown Response
A drawdown rule should trigger diagnosis, not panic. A structured review can ask:
- Did the losses come from normal strategy variation or broken rules?
- Are several positions driven by the same factor?
- Did leverage or position size increase?
- Have costs and slippage exceeded assumptions?
- Has market behaviour changed?
- Is decision quality deteriorating under stress?
Possible responses include reducing new exposure, cutting correlated positions, pausing a trading strategy, returning to simulation or reviewing the portfolio allocation. The correct action depends on the source of the drawdown.
Treat Leverage as a Multiplier of Error
Leverage magnifies both gains and losses. It can also create margin calls, forced liquidation and decisions made under time pressure.
SEBI reported that seven out of ten individual intraday traders in the equity cash segment made losses. Its later FY25 derivatives analysis reported that about 91% of individual equity-derivatives traders incurred net losses, with aggregate net losses of ₹1,05,603 crore after transaction costs in the study sample: SEBI — Comparative Study of Equity Derivatives and Cash Market.
These results do not prove that every individual will lose, but they show why beginners should not treat intraday activity, leverage or derivatives as easy income.
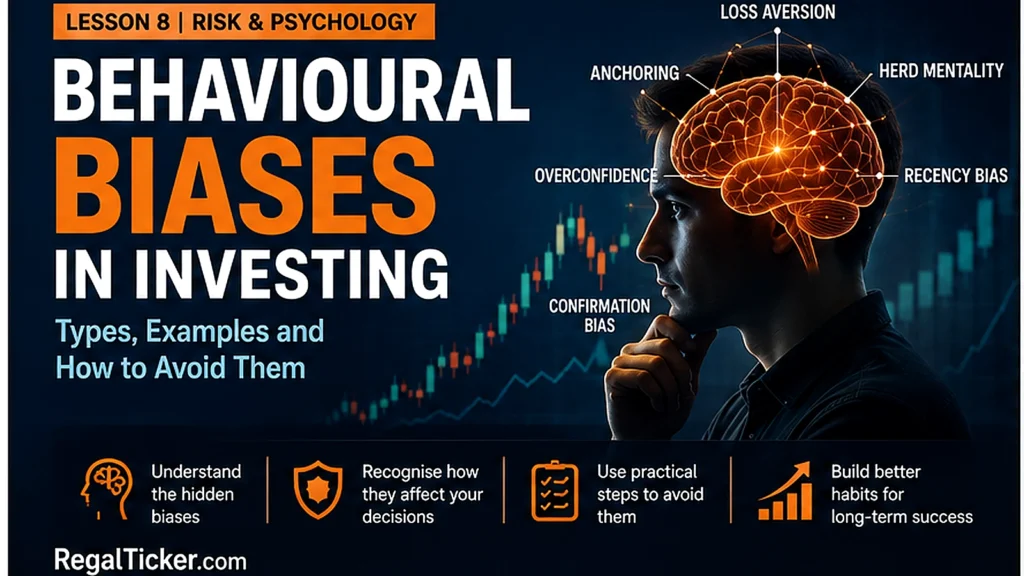
Manage Behavioural Risk
Many risk failures begin as emotional exceptions:
- “I will add once more because it must rebound.”
- “I cannot exit now because the loss will become real.”
- “The last trade lost, so I need a larger trade to recover.”
- “Everyone is buying, so I will enter before missing out.”
- “My stop was hit twice, so I will trade without one.”
Useful controls include:
- a written checklist;
- a fixed cooling-off period after rule-breaking;
- a maximum number of new decisions per session;
- alerts instead of constant screen-watching;
- a journal recording planned and actual behaviour;
- smaller size during learning and after a drawdown.
Discipline is not the absence of emotion. It is following a tested process while emotion is present.
Follow a Repeatable Risk-Management Process
A consistent process makes risk visible before capital is committed.
Step 1: Define the Decision
Write the instrument, purpose, time horizon and evidence. A valid statement is specific:
> Swing trade based on an established uptrend and pullback to support, reviewed on the daily timeframe.
“The stock looks strong” is not specific enough to define risk.
Step 2: List What Can Go Wrong
Include market, company, liquidity, event, concentration, leverage and behavioural risks. Mark which ones are independent and which can occur together.
Step 3: Define Invalidation
For a trade, identify the price structure that invalidates the setup. For an investment, identify the fundamental, valuation, governance or portfolio conditions that require review or exit.
Step 4: Calculate Position and Portfolio Exposure
Check:
- planned rupee loss;
- position value;
- sector and factor exposure;
- total correlated open risk;
- liquidity relative to quantity;
- cash or margin buffer.
Step 5: Choose the Order and Contingency
Decide how the position will be entered and exited, what slippage is acceptable and what happens if price gaps beyond the planned level.
Step 6: Record the Plan Before Entry
A simple record can contain:
| Field | Written decision |
|---|---|
| Purpose and horizon | Investment, swing or intraday; expected review period |
| Thesis or setup | Evidence supporting the decision |
| Invalidation | Evidence or price behaviour that makes it wrong |
| Maximum planned loss | Rupee amount and percentage, if used |
| Position and portfolio exposure | Quantity, value, sector and correlated risk |
| Execution plan | Order type, liquidity and slippage assumption |
| Review trigger | Date, event, price or drawdown threshold |
Step 7: Review Process, Not Only Profit
A profitable trade can contain bad risk management if the rules were broken and luck rescued the outcome. A controlled loss can represent good process if the setup was valid, size was appropriate and the exit followed the plan.
Review:
- Was the decision made from valid evidence?
- Was the position sized as planned?
- Was the order appropriate for liquidity?
- Were rules changed after entry?
- Did the actual loss match the estimated loss?
- What should be repeated or corrected?
SEBI’s do’s and don’ts for securities-market investors also emphasise matching products to investment objectives and risk appetite, reading documents carefully and monitoring the demat portfolio.
Final Beginner Checklist
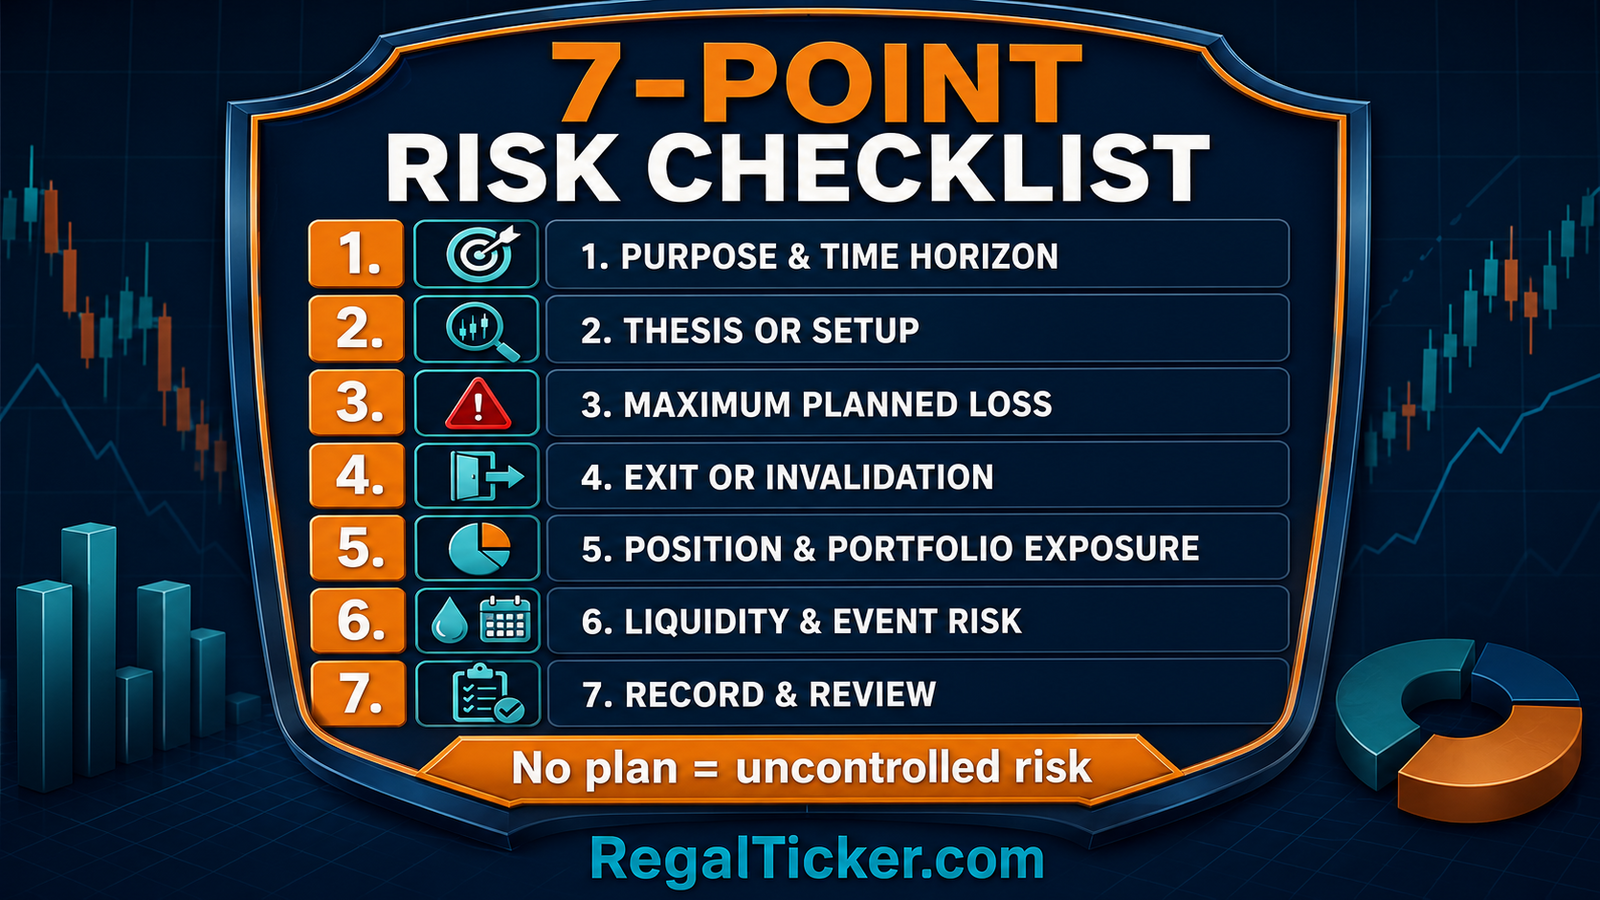
Before every investment or trade, confirm:
- I know whether this is an investment or a trade.
- The time horizon matches the money’s purpose.
- I can explain the thesis or setup in one paragraph.
- I have identified market, company, liquidity and event risks.
- I know what invalidates the decision.
- The position fits the maximum loss or allocation policy.
- Correlated positions do not create hidden concentration.
- I understand the order type, costs and possible slippage.
- I have recorded when and how the decision will be reviewed.
If one of these answers is unclear, delay the order. More analysis or a smaller position is usually cheaper than learning the missing rule through an uncontrolled loss.
Frequently Asked Questions
What is the first rule of risk management in stock market investing?
Define how much capital can be exposed before focusing on potential return. The exact control may be a maximum planned loss for a trade or a portfolio-allocation limit for an investment.
Is a 1% or 2% risk rule compulsory?
No. These are common educational conventions, not universal rules. A suitable limit depends on risk capacity, strategy, stop distance, portfolio structure, liquidity, costs and personal circumstances. A beginner should use conservative exposure and test the process before increasing size.
Can diversification prevent all losses?
No. Diversification can reduce company-specific and concentration risk, but it cannot remove market-wide risk. Poorly chosen holdings can also be highly correlated even when many stock names are present.
Does a stop-loss guarantee the maximum loss?
No. A trigger can activate an exit order, but the execution price depends on liquidity and market conditions. Gaps and fast markets can cause a worse fill. Position size and portfolio limits remain necessary.
Should long-term investors use stop-loss orders?
Some do, but a narrow price stop may conflict with a long-term fundamental process. Investors can instead use allocation limits, thesis invalidation, valuation discipline and periodic rebalancing. The method should match the stated strategy.
What is the difference between position risk and portfolio risk?
Position risk concerns one holding or trade. Portfolio risk includes the combined weight, correlation, sector exposure, liquidity and drawdown effect of all positions. Several individually small positions can create large portfolio risk when they share the same driver.
How often should a risk plan be reviewed?
Review it after material life changes, large portfolio changes, unusual drawdowns, repeated rule violations or changes in strategy. Individual positions should also be reviewed at the predefined price, event or time triggers.
Can risk management make an unprofitable strategy profitable?
Risk management can control damage and improve consistency, but it cannot create an edge where none exists. Analysis quality, execution, costs and behavioural discipline still matter.
Risk management in stock market decisions is not a final step added after selecting a stock. It is the structure around the entire decision. Define the purpose, identify the risk, control the exposure, plan the invalidation and review the process. The goal is not to avoid every loss; it is to prevent normal uncertainty from becoming unacceptable damage.