
Why these two numbers matter
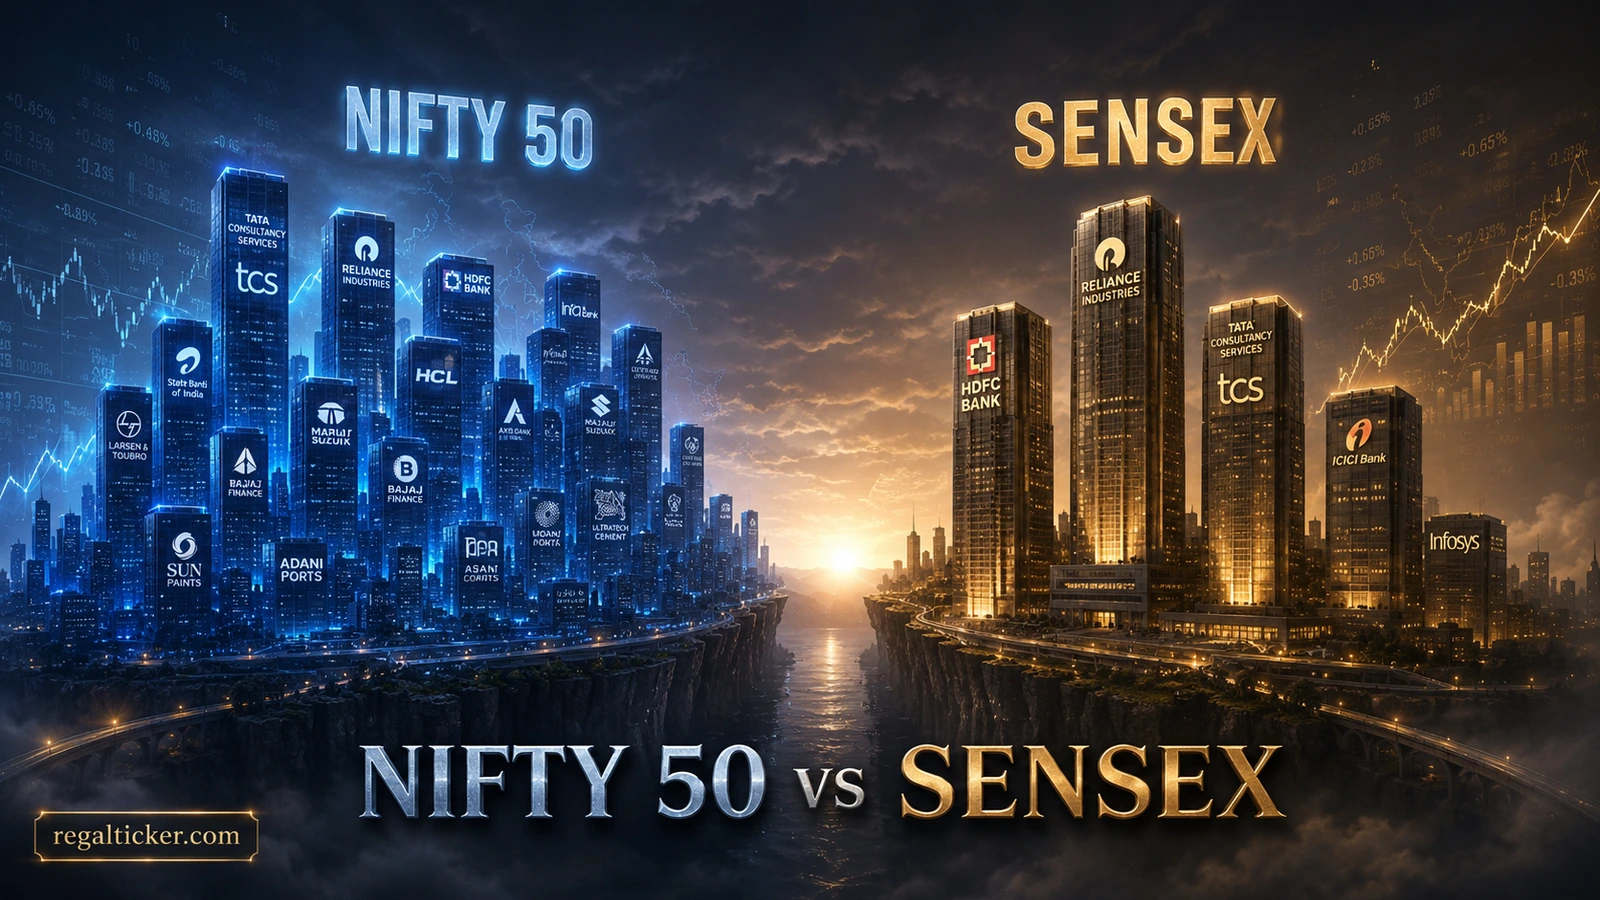
When financial news says “the market rose” or “the market fell,” the headline usually points to NIFTY 50, SENSEX or both. These two numbers appear on trading apps, television tickers, newspapers and investment reports because they offer a quick view of how a selected group of large Indian companies is performing.
But an index is not the entire stock market, and a higher index number does not mean a better market. Understanding what NIFTY 50 and SENSEX actually measure helps beginners read market commentary without confusing exchanges, share prices, index points or investment returns.
⚡ Quick answer
NIFTY 50 and SENSEX are market benchmarks
NIFTY 50 and SENSEX are stock market indices used to track selected large Indian companies. NIFTY 50 contains 50 eligible NSE-listed stocks, while SENSEX contains 30 selected BSE-listed stocks. Both use free-float market-capitalisation weighting, so larger constituents normally influence the index more than smaller ones. Their raw point levels should not be compared directly because the indices have different base periods and base values. For investors, the more useful questions are what the index represents, how much each company weighs, how the index changed in percentage terms and whether the benchmark is appropriate for the investment being evaluated.
Key takeaways
Core meaning
NIFTY 50 and SENSEX are benchmark indices, not stock exchanges and not the whole Indian market.
Composition
NIFTY 50 tracks 50 selected NSE-listed companies; SENSEX tracks 30 selected BSE-listed companies.
Weighting
Both use free-float market capitalisation, so every constituent does not move the index equally.
Points vs returns
Compare percentage change rather than raw point changes or absolute index levels.
Investor use
Indices help measure market direction, compare investment performance and support index-linked products.
NIFTY 50 and SENSEX in Simple Words
Imagine trying to judge the performance of a very large class. Reading every student’s score one by one would be slow, so you might first look at a representative group or an average.
A stock market index plays a similar role. Instead of checking every listed company separately, investors use an index to understand the direction of a defined basket of securities.
- NIFTY 50 is the flagship large-company benchmark associated with the National Stock Exchange (NSE) and contains 50 stocks.
- SENSEX is the widely followed benchmark associated with BSE and contains 30 stocks.
If the most influential companies in an index rise, the index generally rises. If they fall, the index generally falls. The important point is that the companies do not all have equal influence.
📖 Definition
What is a stock market index?
A stock market index is a numerical measure designed to track the performance of a defined group of securities according to a stated methodology. The methodology decides which companies can enter the index, how much weight they receive, when the basket is reviewed and how events such as constituent changes or corporate actions are adjusted.
Different indices are built for different purposes. A broad large-cap index may represent leading companies from several industries, while a sector index may focus only on banking, information technology, pharmaceuticals or another part of the economy.
NIFTY 50 and SENSEX are commonly used as benchmarks for Indian large-cap equities. They are highly visible indicators, but neither one includes every company listed in India.
What Is NIFTY 50?
NIFTY 50 is a diversified 50-stock benchmark made up of eligible companies listed on the National Stock Exchange. Its constituents span important sectors of the Indian economy.
NSE Indices identifies 3 November 1995 as the NIFTY 50 base date and 1,000 as its base value. The index uses the free-float market-capitalisation-weighted method.
The phrase may sound technical, but the principle is simple: a company with a larger value of shares available for public trading normally gets a larger weight in the index.
What does NIFTY 50 represent?
NIFTY 50 represents the weighted performance of 50 selected companies. Its constituents and their weights can change over time as the index methodology is applied.
It should therefore be read as a weighted snapshot of a major part of India’s large-cap market—not as 50 companies casting 50 equal votes.
Is NIFTY 50 the same as NSE?
No.
- NSE is the stock exchange where securities are listed and traded.
- NIFTY 50 is an index calculated from 50 selected NSE-listed stocks.
The exchange is the marketplace; the index is a measurement tool.
Highlight
Exchange and index are different layers
If the difference between an exchange and an index is still unclear, read NSE vs BSE. NSE and BSE provide the trading marketplaces, while NIFTY 50 and SENSEX are benchmark measures built from selected securities.
What Is SENSEX?
The S&P BSE SENSEX, commonly called SENSEX, is BSE’s widely followed benchmark index. It tracks 30 large and established companies from important sectors of the Indian economy.
SENSEX uses a base period of 1978–79 and a base value of 100. It was first published in 1986, which makes it older than NIFTY 50.
Like NIFTY 50, SENSEX uses free-float market-capitalisation weighting.
What does SENSEX represent?
SENSEX represents the weighted movement of 30 selected BSE-listed companies. Because the basket contains fewer stocks than NIFTY 50, it is more concentrated, although it still covers several major industries.
A rising SENSEX does not mean all 30 constituents rose. It means the combined weighted effect of the constituents pushed the index higher.
Is SENSEX the same as BSE?
No.
- BSE is the stock exchange.
- SENSEX is a benchmark index made from 30 selected BSE-listed stocks.
BSE also publishes other indices, just as NSE has many indices beyond NIFTY 50.
NIFTY 50 vs SENSEX: Key Differences
| Feature | NIFTY 50 | SENSEX |
|---|---|---|
| Associated exchange | National Stock Exchange (NSE) | BSE |
| Number of constituents | 50 | 30 |
| Main role | Large-company market benchmark | Large-company market benchmark |
| Base date / period | 3 November 1995 | 1978–79 |
| Base value | 1,000 | 100 |
| Weighting method | Free-float market capitalisation | Free-float market capitalisation |
| Relative coverage | Broader basket of 50 stocks | More concentrated basket of 30 stocks |
| First introduced | 1996 | 1986 |
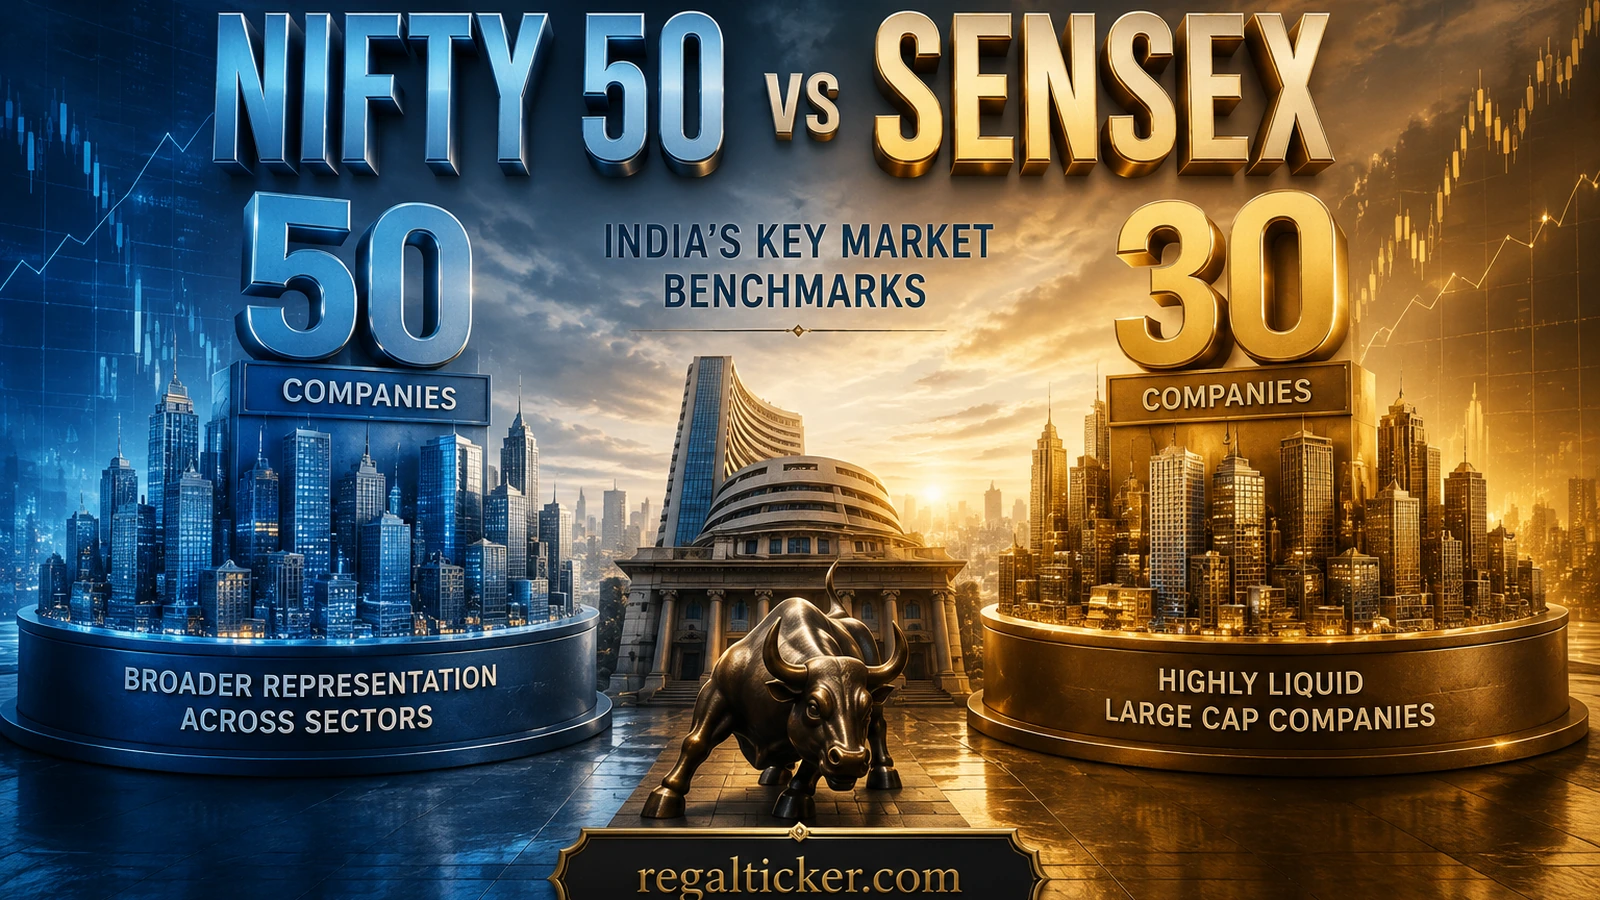
The key structural differences are the associated exchange, constituent count, base reference and index history. Because several large Indian companies can appear in both indices, NIFTY 50 and SENSEX frequently move in the same general direction even though their daily percentage changes may differ.
How Are NIFTY 50 and SENSEX Calculated?
Both indices use free-float market-capitalisation weighting.
To understand that method, separate it into three ideas.
1. Market capitalisation
Market capitalisation is the market value of a company’s outstanding equity shares.
🧮 Simple calculation
Basic market-cap calculation
Market capitalisation = Current share price × Total outstanding shares
If a company has 100 crore outstanding shares and the market price is ₹200 per share:
100 crore × ₹200 = ₹20,000 crore market capitalisation
To understand this concept in greater depth, read What Is Market Capitalisation?.
2. Free-float shares
Not every outstanding share is treated as freely available for regular public trading. Promoter holdings, strategic holdings, government holdings or other restricted categories may be excluded according to the index methodology.
The portion considered available for public trading is broadly referred to as the free float.
🧮 Simple calculation
From market cap to free-float market cap
Suppose the same company has a total market capitalisation of ₹20,000 crore and a free-float factor of 40%.
₹20,000 crore × 40% = ₹8,000 crore free-float market capitalisation
3. Index weight
A constituent’s weight depends largely on its free-float market capitalisation relative to the combined free-float market capitalisation of the index basket.
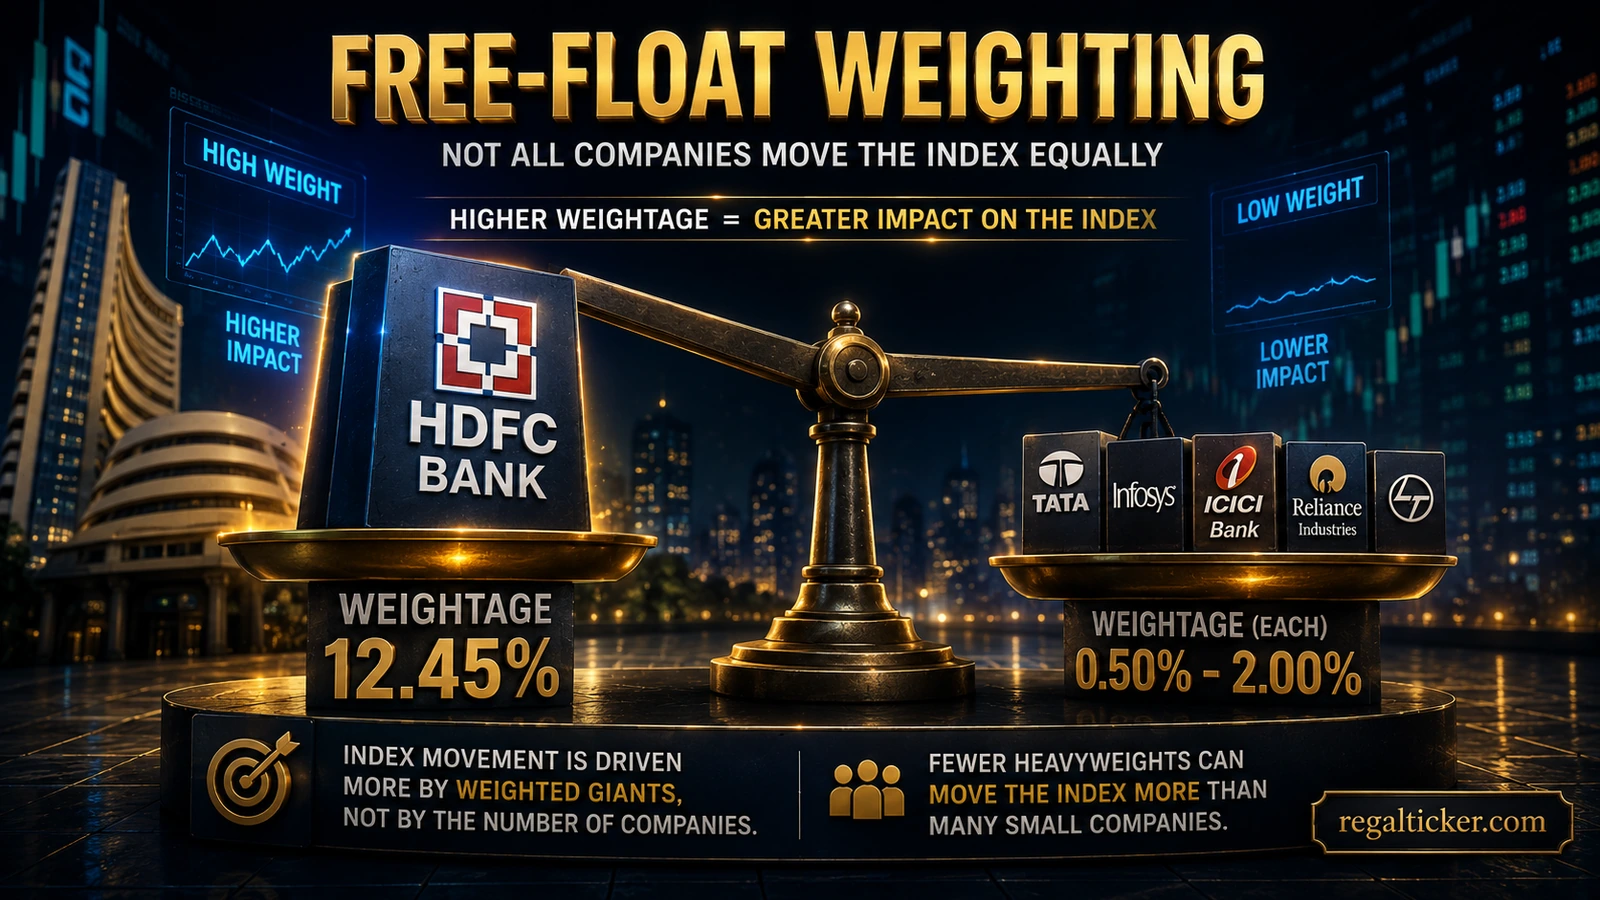
This means a larger-weight company can move the index more than a smaller constituent even when both shares move by the same percentage.
At a simplified level:
Index value = (Current free-float market value ÷ Base market value) × Base index value
Actual index providers maintain a divisor and make adjustments when constituents change or when events such as corporate actions would otherwise create an artificial jump.
Corporate events such as stock splits, bonus issues and rights issues can change prices or share counts without representing a true change in economic value. Learn the underlying events in the Corporate Actions academy.
A Simple Example of Index Weight
💡 Real example
Why one stock can matter more than another
Consider a simplified three-company index:
| Company | Free-float market capitalisation | Approximate weight | | — | —: | —: | | Company A | ₹60,000 crore | 60% | | Company B | ₹30,000 crore | 30% | | Company C | ₹10,000 crore | 10% |
If Company A rises by 2%, its effect on the index is much larger than Company C rising by the same 2%.
This is why an index can finish higher even when several constituents decline: gains in a few heavily weighted companies can outweigh weakness elsewhere.
What Do NIFTY and SENSEX Points Mean?
Index points are not rupees and they are not a simple average of constituent share prices. An index level is the output of the index methodology relative to its chosen base.
🧮 Simple calculation
Compare percentage change, not point change
If NIFTY 50 rises from 20,000 to 20,200:
200 ÷ 20,000 × 100 = 1%
If SENSEX rises from 70,000 to 70,700:
700 ÷ 70,000 × 100 = 1%
The point gains look different, but the percentage performance is the same.
Highlight
Points are a scale, percentage is the comparison
A larger point move does not automatically mean stronger performance. When comparing NIFTY 50 with SENSEX, percentage change is far more meaningful than the raw number of points gained or lost.
If index points, percentage change, market capitalisation and benchmark terminology are unfamiliar, continue with the Market Terminology learning hub.
Why Is SENSEX Higher Than NIFTY 50?
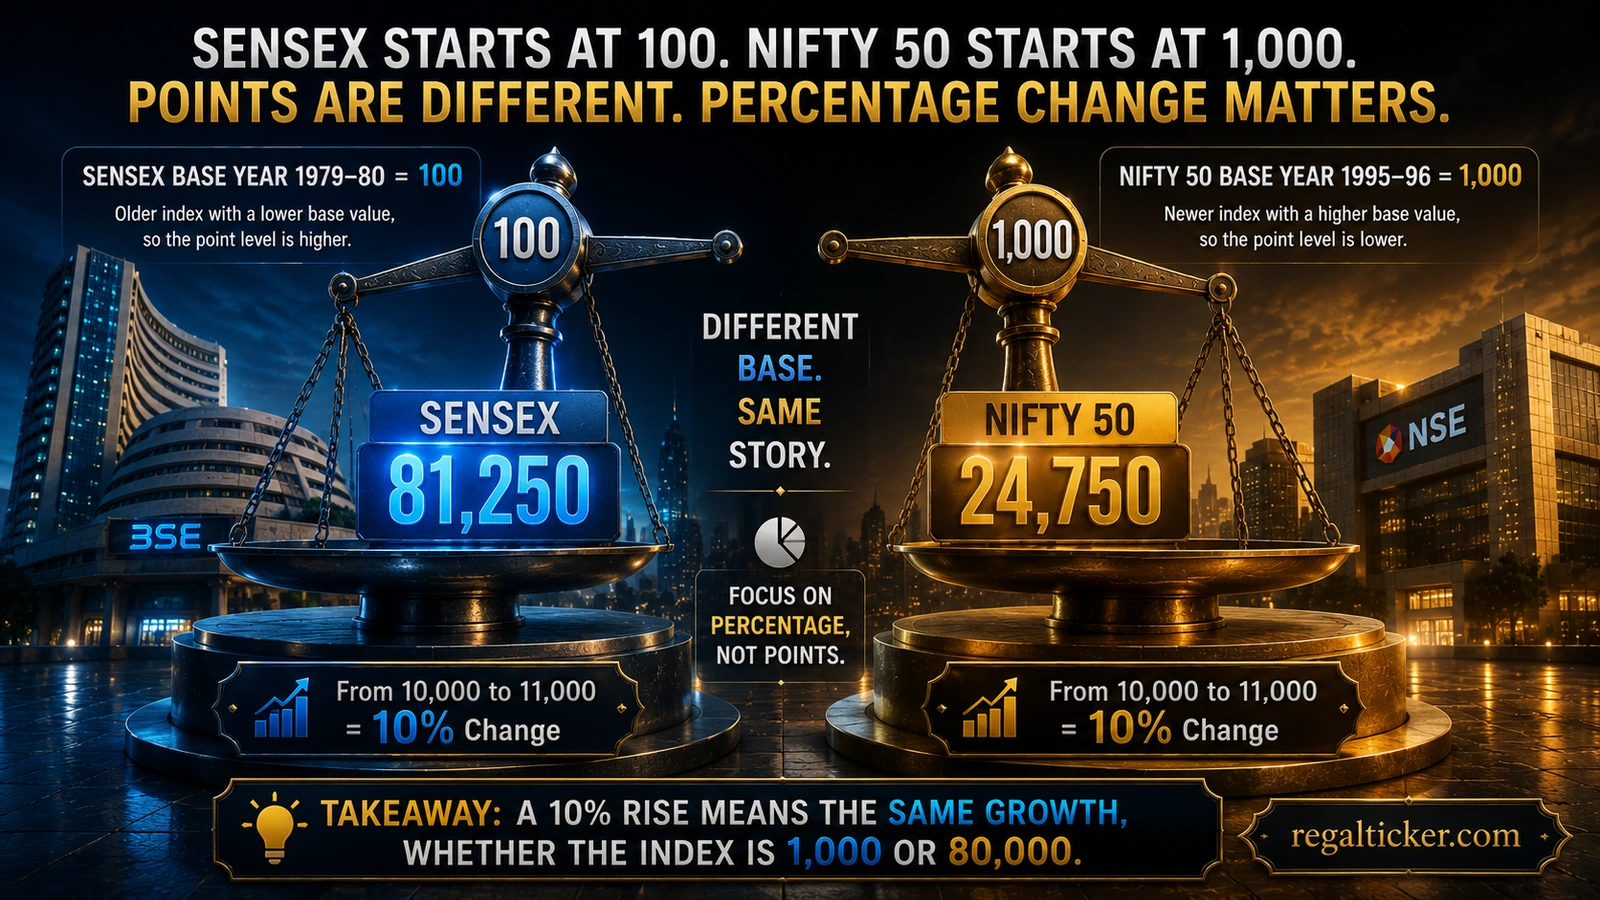
SENSEX normally displays a much larger numerical level than NIFTY 50 because the two indices started from different base periods, base values and calculation histories.
A higher displayed number does not mean SENSEX is more expensive, more profitable or inherently better.
For example, an 800-point rise from 80,000 is 1%, while a 250-point rise from 25,000 is also 1%. The raw point changes differ because the measuring scales are different.
Think of NIFTY 50 and SENSEX as two rulers that began with different reference marks. Compare their percentage movement, not the size of the number printed on the ruler.
Why Do NIFTY 50 and SENSEX Often Move Together?
The two indices often move in a similar direction because:
- both focus heavily on large and liquid Indian companies;
- several major businesses can be constituents of both;
- both are affected by many of the same economic, corporate and global developments; and
- both use free-float market-capitalisation weighting.
Their movements are not identical because the baskets have different constituent counts, different compositions and potentially different weights for overlapping companies.
What Makes NIFTY 50 and SENSEX Rise or Fall?
Share prices of the constituents drive the index. Those share prices may respond to:
- company earnings and business outlook;
- interest-rate and inflation expectations;
- government policy and the Union Budget;
- domestic institutional and foreign portfolio investment flows;
- crude-oil prices and currency movements;
- global markets and geopolitical events;
- industry-specific developments; and
- investor sentiment.
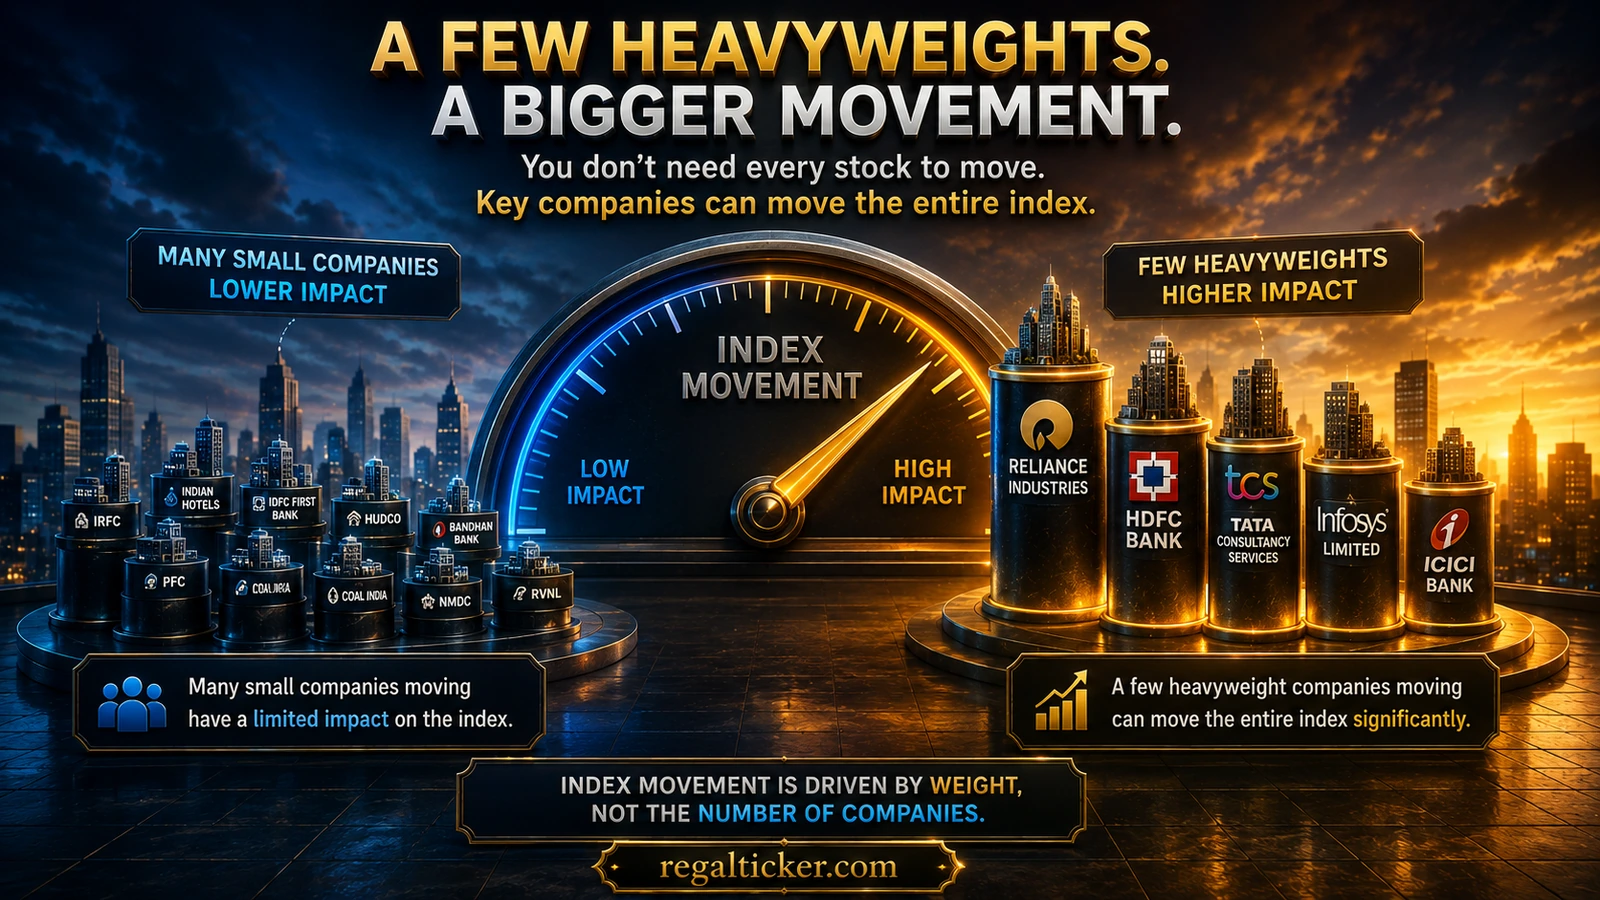
The impact of any move depends on which companies moved and how much weight they carry.
Caution
A strong headline index can hide weak market breadth
NIFTY 50 or SENSEX can rise sharply because a small group of heavyweight stocks performed well even when many other shares were flat or falling. For broader context, investors may also examine advancing versus declining stocks, sector indices and wider market-cap indices.
Do NIFTY 50 and SENSEX Show the Entire Indian Stock Market?
No.
NIFTY 50 tracks 50 selected companies and SENSEX tracks 30. India has many more listed companies across large-cap, mid-cap, small-cap and micro-cap segments.
Therefore:
- a rising NIFTY 50 does not mean every Indian share is rising;
- a falling SENSEX does not mean every listed company is losing value; and
- strength in large-cap stocks can exist alongside weakness in smaller companies, or vice versa.
Highlight
An index is a snapshot, not the whole market
Use NIFTY 50 and SENSEX as large-cap benchmarks. If your question concerns a different market segment, compare it with an index designed for that segment rather than treating one headline benchmark as a verdict on every listed company.
Price Return Index vs Total Return Index
The headline index values commonly discussed in financial media generally focus on price movement.
A Total Return Index (TRI) also reflects dividends from constituents according to its methodology, normally assuming reinvestment.
Important terms
Terms used in this section
- Price Return Index — Measures index performance mainly through constituent price changes.
- Total Return Index (TRI) — Includes price movement plus the effect of dividends according to the index methodology.
- Tracking difference — The gap between an investment product’s return and the benchmark it aims to follow.
How Do Investors Use NIFTY 50 and SENSEX?
1. Reading broad market direction
The indices provide a quick summary of how major large-cap stocks performed during a session or over a longer period.
2. Comparing investment performance
An investor or fund can compare returns with a relevant benchmark. The benchmark should match the portfolio being evaluated; a small-cap portfolio, for example, should not automatically be judged only against NIFTY 50.
3. Investing through index products
An investor cannot buy an index number directly. Exposure can be obtained through products such as index mutual funds and exchange-traded funds that aim to track a chosen index, subject to costs and tracking difference.
Investors who want to understand index mutual funds, ETFs, fund costs and tracking concepts can continue with the Mutual Funds learning hub.
4. Understanding concentration
Index weights show that headline movements can be driven by a relatively small group of large constituents. This prevents the mistaken assumption that all stocks participated equally.
5. Studying long-term market behaviour
Historical index data can help investors examine market cycles, volatility and long-term returns. Past performance does not guarantee future returns.
Market indices help describe broad movement, but they do not remove investment risk. Use the Risk Management learning hub to understand diversification, drawdowns, position sizing and capital-protection principles.
Use the calculator
Measure Long-Term Index Growth
If you are comparing a benchmark level across several years, the CAGR Calculator can convert a starting value, ending value and holding period into an annualised growth rate. Remember that a price index does not include dividends, so total-return performance can differ.
Which Is Better: NIFTY 50 or SENSEX?
Neither index is universally better.
NIFTY 50 contains 50 constituents and therefore represents a somewhat broader large-cap basket. SENSEX contains 30 and is more concentrated. Both are established benchmarks with substantial overlap among major Indian companies.
Highlight
Choose the benchmark for the purpose
For following large-cap market direction, either index can be useful. For evaluating a mutual fund or ETF, use the benchmark relevant to that product. For choosing between index products, compare costs, tracking difference, liquidity where relevant, taxation, investment objective and your own risk tolerance—not simply which index has the higher point level.
Common Beginner Mistakes
Mistake 1: Treating the index as the whole market
NIFTY 50 and SENSEX represent selected large companies, not every listed share.
Mistake 2: Comparing point gains
A 700-point SENSEX gain is not automatically stronger than a 200-point NIFTY 50 gain. Compare percentage changes.
Mistake 3: Assuming every constituent has equal weight
Both indices use free-float market-capitalisation weighting. Larger constituents can influence the index much more.
Mistake 4: Believing a high index level means the market is expensive
The index number by itself does not reveal valuation. Evaluating whether the market or a company appears expensive requires earnings, valuation ratios, cash flows, business quality and other analysis. Learn these concepts in the Fundamental Analysis learning hub.
Mistake 5: Using the wrong benchmark
A benchmark should match the portfolio’s market segment and strategy. Comparing a sector fund or small-cap portfolio only with NIFTY 50 may give a misleading picture.
Final takeaway
Read the index as a weighted snapshot
NIFTY 50 and SENSEX help investors track selected large Indian companies, but they are not the whole market and they do not move on an equal-weight basis. NIFTY 50 contains 50 selected NSE-listed stocks, while SENSEX contains 30 selected BSE-listed stocks, and both use free-float market-capitalisation weighting.
The practical habit is simple: focus on percentage movement, constituent weights, market breadth and the relevance of the benchmark rather than being impressed by a large point number.
The next lesson explains the mechanism beneath every index move: How Are Share Prices Decided?.
Frequently asked questions
What are NIFTY 50 and SENSEX in simple words?
They are benchmark baskets of selected large-company shares used to measure market performance. NIFTY 50 contains 50 selected NSE-listed stocks, while SENSEX contains 30 selected BSE-listed stocks.
What is the main difference between NIFTY 50 and SENSEX?
They differ mainly in their associated exchanges, number of constituents, base references and composition. NIFTY 50 has 50 selected stocks associated with NSE, while SENSEX has 30 selected stocks associated with BSE.
Is NIFTY 50 the same as NSE?
No. NSE is a stock exchange. NIFTY 50 is an index calculated from 50 selected NSE-listed companies.
Is SENSEX the same as BSE?
No. BSE is a stock exchange. SENSEX is a benchmark index made from 30 selected BSE-listed companies.
Why is the SENSEX number higher than NIFTY 50?
The indices use different base periods, base values and calculation histories. Their absolute point levels are therefore not directly comparable. Percentage change is more meaningful.
Do all NIFTY 50 companies have equal weight?
No. NIFTY 50 uses free-float market-capitalisation weighting, so companies with larger free-float market values normally have a greater influence on index movement.
Can I invest directly in NIFTY 50 or SENSEX?
You cannot buy an index number itself. Investors can obtain index-linked exposure through products such as index mutual funds and exchange-traded funds that aim to track the chosen benchmark.
Does a rising NIFTY 50 mean every stock is rising?
No. Gains in heavily weighted constituents can outweigh declines in other companies, and stocks outside the index can move differently.
Which is better for beginners, NIFTY 50 or SENSEX?
Neither is automatically better. Both are established large-cap benchmarks. If choosing an index-linked investment product, compare suitability, cost, tracking difference, liquidity where relevant and risk rather than choosing only by the index name.
Verify through official sources
Official references
- SEBI Investor — Market Index — Investor-education overview of market indices.
- NSE Indices — NIFTY 50 — Official NIFTY 50 index information and methodology references.
- BSE Indices — S&P BSE SENSEX — Official BSE index information.
Educational disclaimer: Educational disclaimer: This article is for investor education and informational purposes only. It is not investment advice, a recommendation to buy or sell any security or financial product, or an assurance of returns. Verify current methodology and product information through official sources before making a financial decision.