

⚡ Quick answer
Portfolio drawdown is the percentage decline from a portfolio’s previous highest value to a later lower value. Maximum drawdown is the deepest such decline measured during a selected period. Capital protection means structuring finances and investments so that a market decline does not force destructive selling, excessive leverage, missed essential goals or permanent loss of capital. It does not mean avoiding every temporary fall or guaranteeing that the portfolio will never lose value.
Investor note
Key Takeaways
Drawdown is measured from the previous portfolio peak, not simply from the original investment amount. A portfolio remains in drawdown until it fully regains the former peak. A 50% loss needs a 100% gain to recover because gains are calculated from a smaller base. Capital protection begins before a downturn through liquidity, sensible allocation, diversification and controlled position size. Emergency money and near-term goal money should not depend on volatile assets. Deeper drawdowns can damage both mathematics and investor behaviour. Rebalancing should follow a written policy rather than daily market emotion. Brokerage, taxes and slippage matter when reducing or rebuilding positions. Calculators support transparent arithmetic but do not predict market recovery.
Portfolio drawdown and capital protection are closely connected, but they are not the same concept.
Drawdown measures what has already happened to portfolio value. Capital protection describes the system used to prevent a normal market decline from becoming a financial crisis.
An investor may accept temporary volatility in a long-term equity portfolio while protecting:
money needed within the next few years; an emergency reserve; retirement withdrawals; insurance obligations; the ability to remain invested; the capacity to rebalance during weak markets.
This lesson follows Risk Management in Stock Market, Position Sizing in Stock Market, Risk-Reward Ratio in Stock Market, Stop-Loss Orders in Stock Market and Diversification and Asset Allocation Explained.
Those lessons control risk at the trade, position and allocation levels. This lesson brings them together around one central question:
How much portfolio decline can the investor survive financially and emotionally without abandoning the plan?
SEBI’s investor guidance explains that investment risk cannot be completely removed, but its negative impact can be managed through research, diversification and investments suited to the investor’s time horizon and risk tolerance.
What Is Portfolio Drawdown?
Portfolio drawdown is the decline from the portfolio’s previous highest value to a later lower value.
The basic formula is:
Drawdown % = (Current portfolio value − Previous peak value) ÷ Previous peak value × 100
Because the current value is below the peak, the result is negative.
Suppose a portfolio reaches ₹12,00,000 and later falls to ₹9,60,000.
Drawdown:
(₹9,60,000 − ₹12,00,000) ÷ ₹12,00,000 × 100
= −20%
The portfolio is in a 20% drawdown.
Drawdown Is Measured from the Peak
Assume the investor originally contributed ₹8,00,000. The portfolio later rises to ₹12,00,000 and then falls to ₹9,60,000.
The investor may still be above the original contribution by ₹1,60,000. However, the portfolio has declined 20% from its latest peak.
Both facts are true:
- return from original capital: positive;
- drawdown from peak: negative.
Drawdown measures the decline from the best portfolio value already achieved.
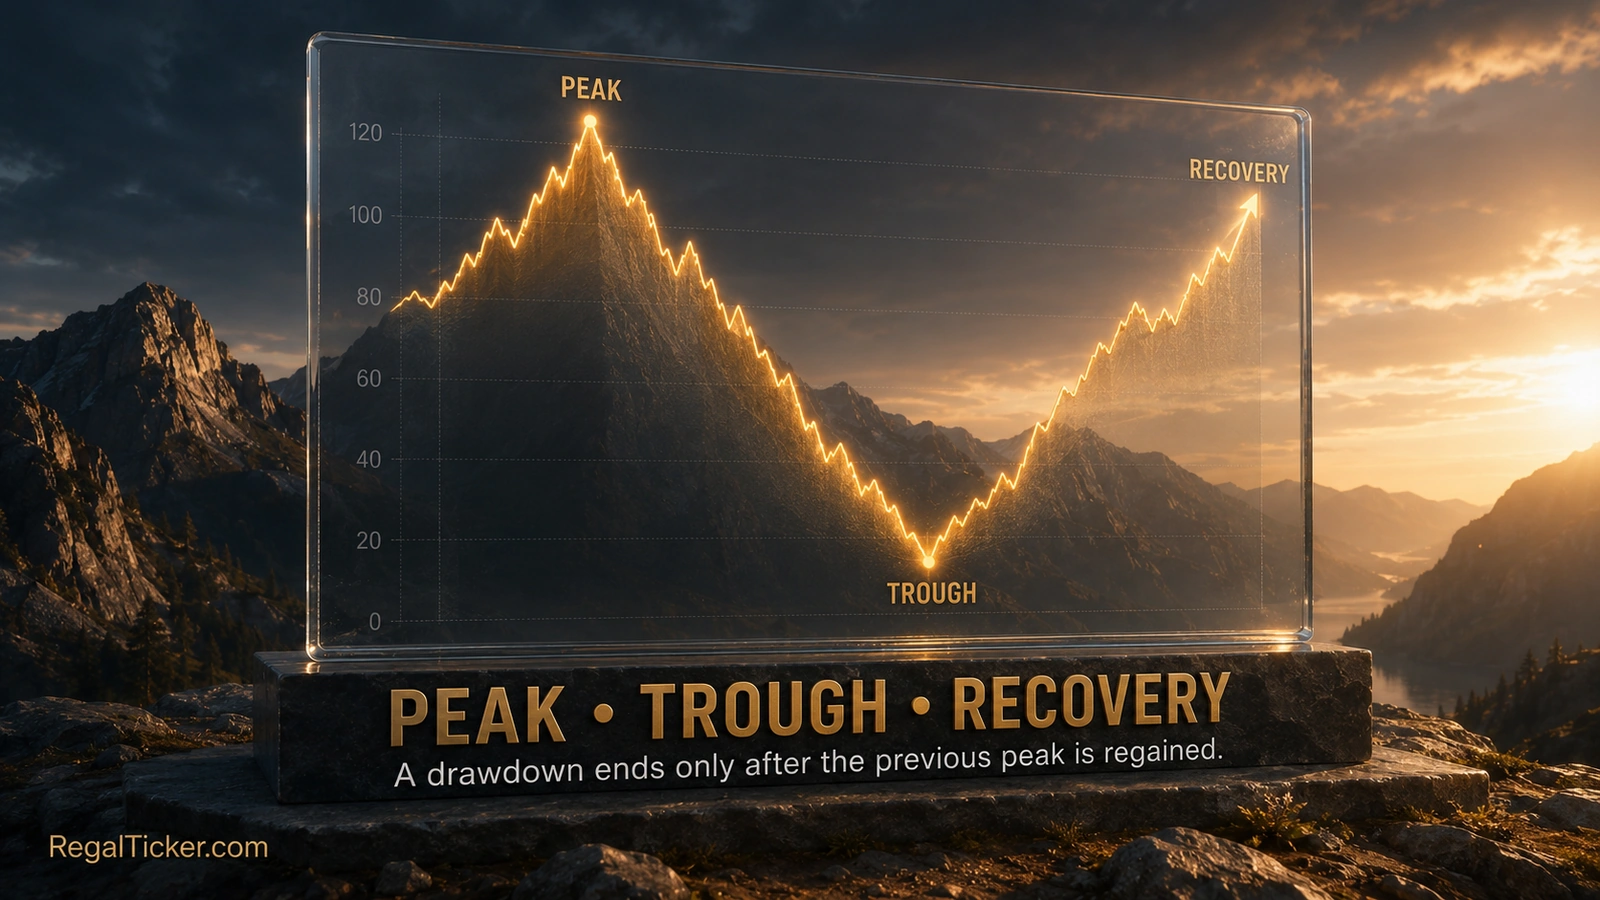
A Drawdown Ends Only after Full Recovery
Suppose the portfolio falls from ₹12,00,000 to ₹9,60,000 and later rises to ₹11,50,000.
The portfolio has recovered substantially, but it remains below the previous ₹12,00,000 peak. Therefore, it is still in drawdown.
The drawdown period ends when the portfolio reaches or exceeds ₹12,00,000.
Drawdown vs Daily Loss
A daily loss measures the change from one trading day to the next.
Drawdown measures the cumulative decline from a previous high.
A portfolio can experience several small daily losses that combine into a large drawdown. It can also rise on a particular day while remaining far below its earlier peak.
Drawdown vs Volatility
Volatility describes the size and frequency of price movements in both directions.
Drawdown focuses specifically on the decline from a peak.
A highly volatile portfolio can recover quickly and record a moderate maximum drawdown. A slowly declining portfolio can have low daily volatility but remain underwater for a long time.
Drawdown vs Permanent Loss
A drawdown is not automatically permanent. A diversified portfolio may fall during a market decline and later recover.
Permanent capital loss occurs when value is impaired and does not return, perhaps because:
- a business fails;
- excessive debt destroys equity value;
- fraud or governance failure emerges;
- an asset was purchased at an unsustainable price;
- leverage forces liquidation;
- the investor sells at a severe loss and never rebuilds;
- the investment cannot be accessed or sold.
Capital protection is especially concerned with preventing temporary drawdowns from turning into permanent financial damage.
Maximum Drawdown and Time Under Water
Maximum drawdown is the deepest peak-to-trough decline during a selected measurement period.
Suppose portfolio values move through the following sequence:
| Stage | Portfolio value |
|---|---|
| Starting value | ₹10,00,000 |
| First peak | ₹12,00,000 |
| First trough | ₹10,80,000 |
| New peak | ₹13,00,000 |
| Deep trough | ₹8,45,000 |
| Later recovery | ₹12,20,000 |
The first drawdown is:
(₹10,80,000 − ₹12,00,000) ÷ ₹12,00,000 = −10%
The second drawdown is:
(₹8,45,000 − ₹13,00,000) ÷ ₹13,00,000 = −35%
The maximum drawdown in this sequence is 35%.
Why Maximum Drawdown Matters
Maximum drawdown can reveal risks that an average return hides.
Two portfolios may both produce an average annual return near 12%, but their journeys may be very different:
- Portfolio A experiences a maximum drawdown of 18%.
- Portfolio B experiences a maximum drawdown of 52%.
An investor who needs money during Portfolio B’s decline may be forced to sell at an unfavourable time. Another investor may panic and abandon the strategy.
Return alone does not show whether the path was survivable.
Measurement Period Changes the Result
Maximum drawdown depends on the selected period.
A one-year chart may exclude an older market crash. A ten-year chart may include several cycles. A newly launched fund or strategy may not yet have faced a severe stress period.
When comparing drawdowns, use:
- the same measurement period;
- comparable asset classes;
- the same data frequency;
- returns after similar fees where possible;
- realistic treatment of withdrawals and contributions.
Contributions Can Distort a Simple Portfolio Chart
Regular investments add money to the portfolio. Withdrawals remove money. A simple account-value chart may therefore rise or fall because of cash flows rather than investment performance.
For irregular cash flows, use the XIRR Calculator to calculate a cash-flow-adjusted annualised return. XIRR does not calculate drawdown directly, but it helps separate investment performance from the timing of deposits and withdrawals.
Time Under Water
Time under water is the length of time the portfolio remains below its previous peak.
A 15% drawdown lasting three years may be harder for an investor than a 25% drawdown that recovers within six months.
Track both:
- drawdown depth;
- drawdown duration.
The psychological burden of waiting can lead investors to switch strategies near the worst possible time.
Why Recovery Becomes Harder after a Deep Loss
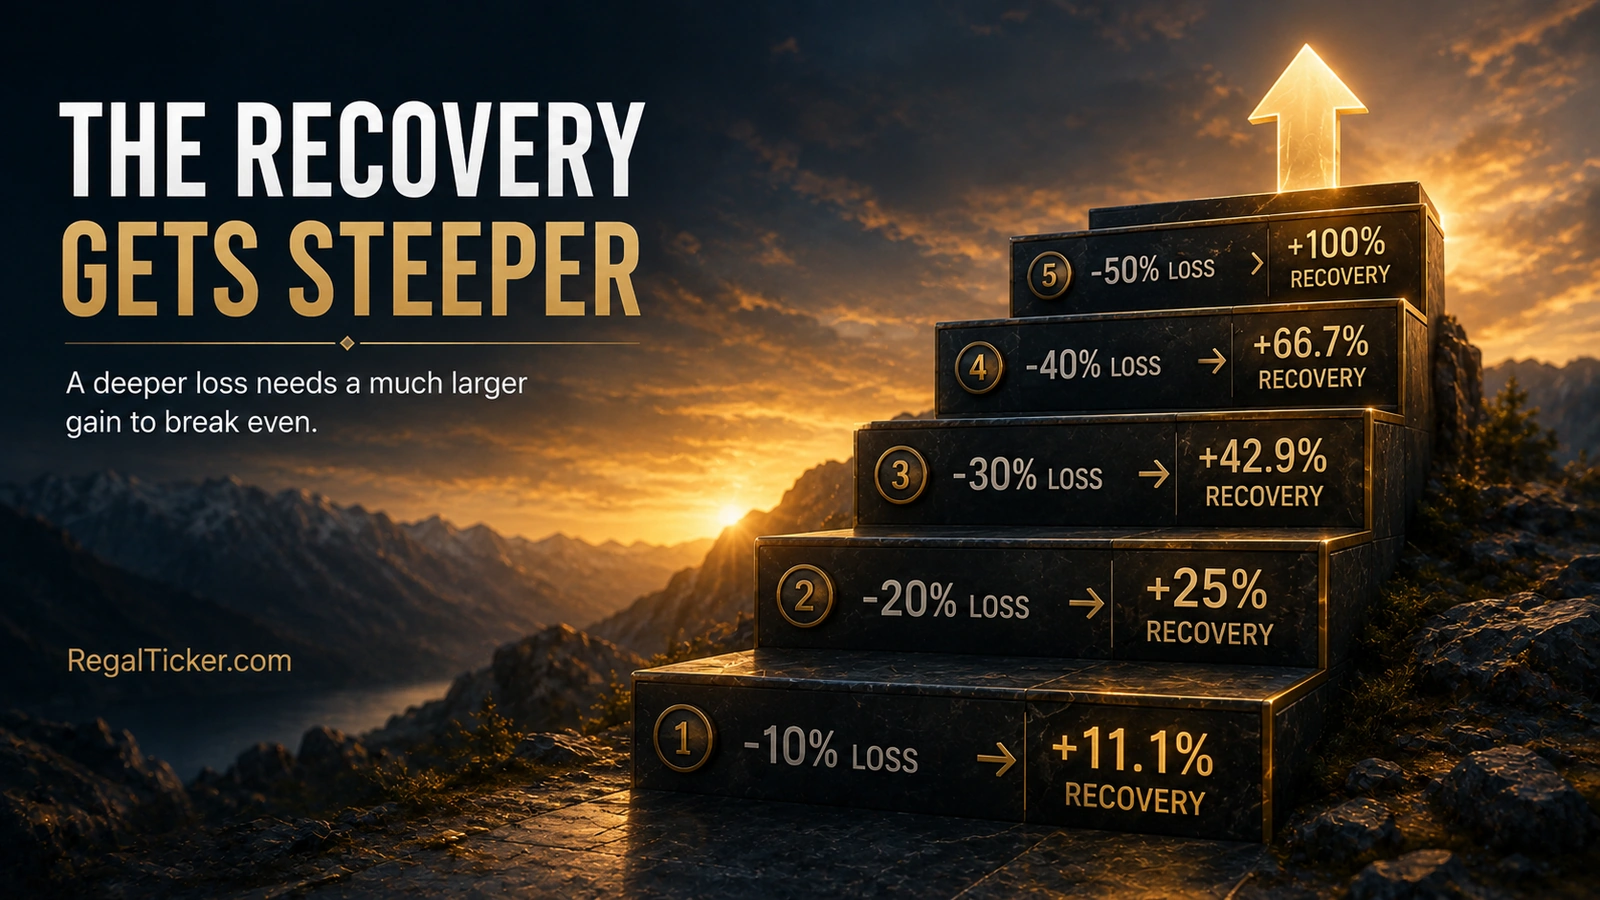
A loss and the gain required to recover are not equal percentages because the recovery begins from a smaller capital base.
Required recovery % = Loss % ÷ (1 − Loss %) × 100
Use the loss as a decimal in the formula.
Recovery Table
| Portfolio loss | Value remaining from ₹10 lakh | Gain required to recover |
|---|---|---|
| 5% | ₹9,50,000 | 5.26% |
| 10% | ₹9,00,000 | 11.11% |
| 20% | ₹8,00,000 | 25.00% |
| 30% | ₹7,00,000 | 42.86% |
| 40% | ₹6,00,000 | 66.67% |
| 50% | ₹5,00,000 | 100.00% |
| 60% | ₹4,00,000 | 150.00% |
| 70% | ₹3,00,000 | 233.33% |
Worked Example: 30% Drawdown
A ₹10,00,000 portfolio falls 30%:
₹10,00,000 × 70% = ₹7,00,000
To recover the ₹3,00,000 loss from a ₹7,00,000 base:
₹3,00,000 ÷ ₹7,00,000 × 100 = 42.86%
The portfolio needs a 42.86% gain—not 30%—to return to ₹10,00,000.
Worked Example: 50% Drawdown
A ₹10,00,000 portfolio falls to ₹5,00,000.
A 50% gain on ₹5,00,000 adds only ₹2,50,000, taking the portfolio to ₹7,50,000.
The portfolio needs a 100% gain to return from ₹5,00,000 to ₹10,00,000.
Capital Preservation Does Not Mean Zero Risk
Avoiding all volatility may create another risk: failing to grow purchasing power after inflation and taxes.
Capital protection should therefore distinguish between:
- money that must remain stable and liquid;
- money that can tolerate moderate fluctuation;
- long-term growth capital that can accept larger temporary declines.
SEBI describes safety, return and liquidity as three important investment considerations. The correct balance depends on goals, time horizon, risk tolerance and overall financial circumstances.
What Capital Protection Really Means
Capital protection is a financial system designed to keep losses within a survivable range and preserve the investor’s ability to meet goals.
It is not a promise that the portfolio will never decline.
Protecting Essential Capital
Money needed for essential expenses or near-term goals should not rely on a favourable stock-market price on the exact date it is required.
Examples include:
- emergency expenses;
- house down payment due soon;
- education fees;
- medical needs;
- tax payments;
- retirement spending for the next few years;
- debt repayment.
The investment horizon should match the risk and liquidity of the asset.
Protecting Risk Capacity
Risk capacity is the financial ability to absorb a loss.
An investor may be emotionally willing to take risk but financially unable to do so because:
- income is unstable;
- dependants rely on the portfolio;
- debt obligations are high;
- the investment horizon is short;
- emergency reserves are inadequate;
- withdrawals have already begun.
Capital protection begins with financial capacity, not market prediction.
Protecting Behaviour
A portfolio can be mathematically reasonable and still fail if the investor cannot tolerate its decline.
A written policy should define:
- acceptable allocation ranges;
- maximum concentration;
- review frequency;
- conditions for rebalancing;
- conditions for reducing risk;
- how new contributions are used;
- what will not be changed during panic.
The goal is to make important decisions before fear and greed become intense.
Protecting Opportunity
Capital protection also preserves the ability to act.
An investor with adequate liquidity and controlled leverage may be able to rebalance into undervalued assets during a decline.
An investor who is fully leveraged may be forced to sell instead.
Five Layers of Capital Protection
Capital protection is strongest when several layers work together.
Layer 1: Liquidity Reserve
Maintain a separate reserve for emergencies and near-term obligations.
This reduces the chance that investments must be sold during a market decline.
The reserve amount depends on personal circumstances, including income stability, dependants, insurance and predictable expenses.
Layer 2: Asset Allocation
Asset allocation divides capital among categories such as equity, debt, gold and cash.
A portfolio with 100% equity exposure will usually behave differently from one that includes less volatile and more liquid assets.
Review Diversification and Asset Allocation Explained before choosing percentages.
Layer 3: Diversification
Diversification reduces dependence on one:
- company;
- sector;
- theme;
- geography;
- investment style;
- asset class;
- economic outcome.
Diversification cannot eliminate market-wide losses, but it can reduce the impact of a single failure.
Layer 4: Position Sizing and Concentration Limits
A weak position can damage the portfolio when its size is excessive.
Position sizing defines how much capital is allocated and how much loss is acceptable.
Read Position Sizing in Stock Market and use the Risk-Reward Calculator before adding a concentrated trading position.
Layer 5: Review and Exit Rules
An exit rule may be:
- price-based;
- thesis-based;
- valuation-based;
- time-based;
- allocation-based;
- linked to a change in financial goals.
Traders may use stop-loss orders. Long-term investors may exit when the original business thesis fails.
Review Stop-Loss Orders in Stock Market for execution risks, trigger prices and the difference between planning and guaranteed fills.

Building a Drawdown Budget
A drawdown budget is the maximum portfolio decline that the investor’s plan is designed to tolerate.
It is not a guarantee that the portfolio cannot fall farther.
Step 1: Separate Capital by Time Horizon
Create broad buckets:
| Capital purpose | Typical priority |
|---|---|
| Emergency and immediate expenses | Stability and liquidity |
| Near-term goals | Capital preservation |
| Medium-term goals | Balanced risk |
| Long-term wealth creation | Growth with controlled drawdown |
| Speculative capital | Strict loss limit |
The exact instruments depend on personal circumstances and professional advice where required.
Step 2: Estimate Portfolio-Level Decline
Do not simply add the worst loss of every holding. Correlations change during stress, and several assets can decline together.
Use conservative scenarios such as:
- normal correction;
- severe bear market;
- company-specific failure;
- sector decline;
- interest-rate shock;
- liquidity freeze;
- loss of income combined with a market decline.
Step 3: Convert the Drawdown into Rupees
For a ₹25,00,000 portfolio:
- 10% drawdown = ₹2,50,000;
- 20% drawdown = ₹5,00,000;
- 30% drawdown = ₹7,50,000;
- 40% drawdown = ₹10,00,000.
The rupee amount often communicates risk more clearly than a percentage.
Step 4: Test the Emotional Response
Ask:
- Would I stop investing after this decline?
- Would I sell because of fear?
- Would essential goals be affected?
- Would family members pressure me to exit?
- Would I borrow money to cover expenses?
- Would I abandon the strategy?
If a realistic drawdown would destroy the plan, the allocation may be too aggressive.
Step 5: Define an Action Threshold
An action threshold is not necessarily a sell signal.
It may trigger:
- a portfolio review;
- concentration analysis;
- liquidity check;
- thesis review;
- rebalancing;
- reduction of leverage;
- consultation with a qualified adviser.
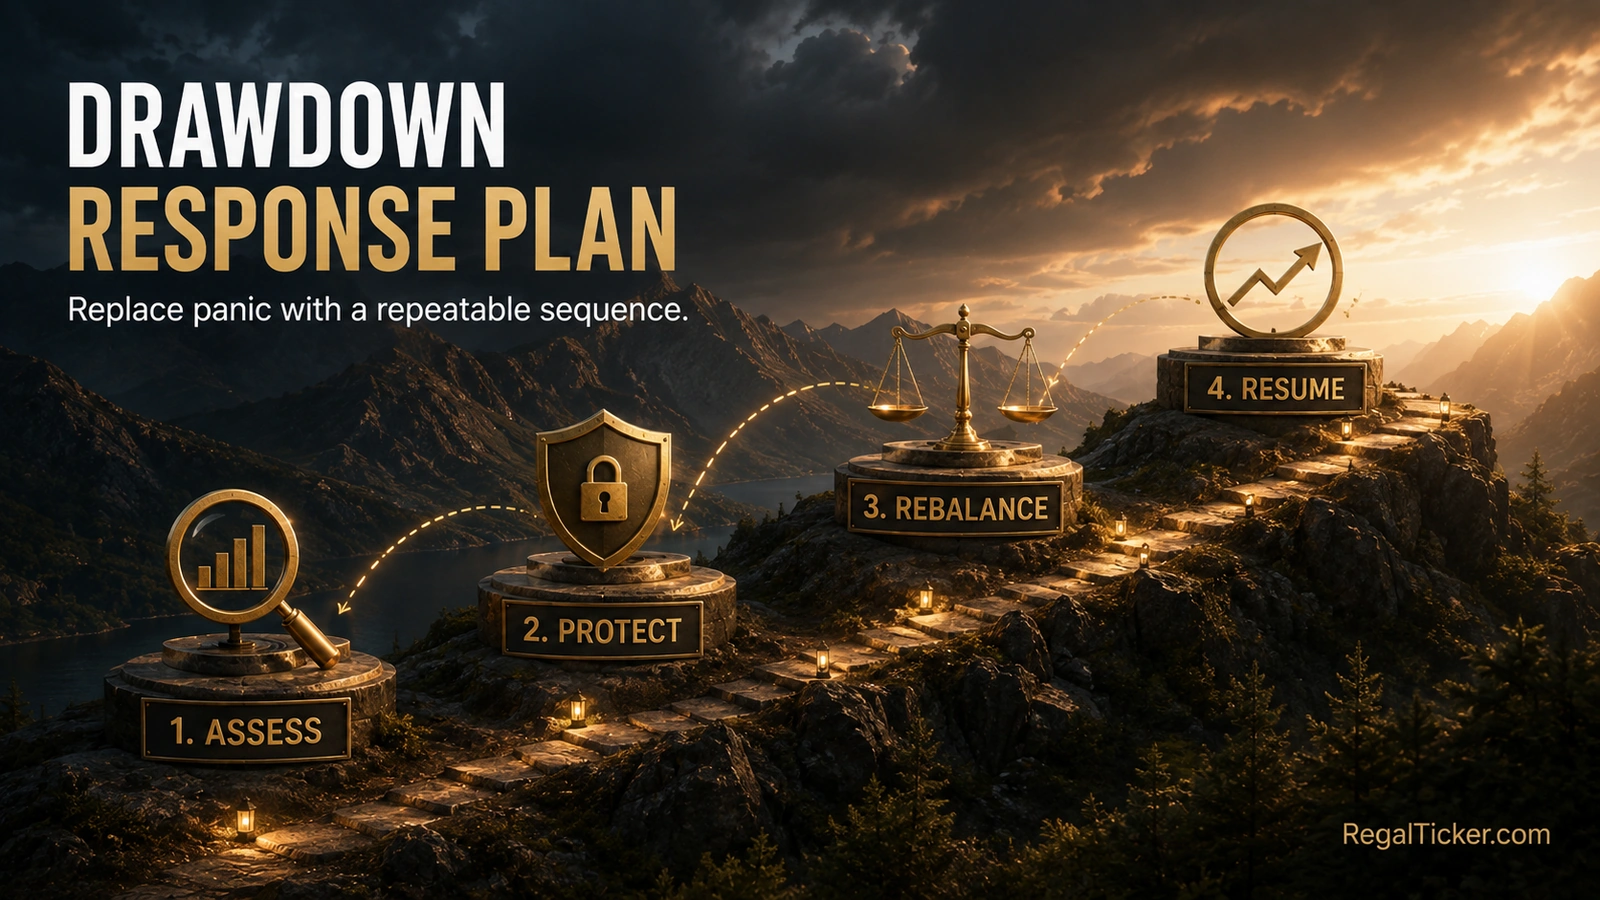
A Practical Drawdown Response Plan
The worst time to invent a risk process is during a sharp fall.
Use a written sequence.
1. Assess What Changed
Determine whether the decline is caused by:
- broad market movement;
- a sector event;
- company-specific information;
- valuation compression;
- liquidity stress;
- portfolio withdrawals;
- a failed investment thesis.
A market-wide fall and a company-specific collapse require different responses.
2. Protect Liquidity
Confirm that essential expenses and near-term goals remain funded.
Avoid using volatile investments as an emergency account.
If withdrawals are planned, use the SWP Calculator to test how different withdrawal amounts and return assumptions affect the projected balance. The calculator is an illustration, not a guarantee of future returns.
3. Check Concentration and Leverage
Review:
- largest single holding;
- sector concentration;
- small-cap or illiquid exposure;
- leveraged positions;
- margin obligations;
- correlated trades.
A drawdown often reveals hidden concentration.
4. Revisit the Original Thesis
For each material holding, ask:
- Has the business changed?
- Has debt increased dangerously?
- Has governance deteriorated?
- Has the competitive advantage weakened?
- Was the original valuation assumption unrealistic?
- Is the expected holding period still appropriate?
Do not keep a failed investment only because selling would confirm a loss.
5. Rebalance Deliberately
When one asset class falls, its portfolio weight may move below the target.
Rebalancing can be performed by:
- directing new contributions to the underweight asset;
- using dividends or interest;
- selling part of an overweight asset;
- combining several methods.
Before selling, estimate transaction costs with the Brokerage Calculator and review possible tax consequences with the Capital Gains Tax Calculator.
6. Resume the Long-Term Process
A drawdown plan should explain how normal investing resumes.
For regular investing, use the SIP Calculator to understand how contribution amount, assumed return and duration interact. The output is a projection based on entered assumptions.
7. Record the Decision
Document:
- current drawdown;
- cause of decline;
- portfolio allocation;
- changes made;
- reasons for the changes;
- conditions for the next review.
Written records reduce hindsight bias.
Worked Portfolio Drawdown Examples
Example 1: Growth Portfolio with No Near-Term Need
An investor has:
- portfolio value at peak: ₹30,00,000;
- current value: ₹24,00,000;
- drawdown: 20%;
- stable income;
- emergency reserve outside the portfolio;
- goal horizon: 15 years;
- diversified allocation.
The investor may decide that the drawdown is within the planned risk range and rebalance gradually rather than sell in panic.
The required gain to recover from a 20% loss is 25%.
Example 2: Same Drawdown, Different Financial Position
Another investor has the same ₹30,00,000 peak and ₹24,00,000 current value, but:
- a house payment is due within one year;
- the portfolio is the only source of that payment;
- most assets are volatile equities;
- there is no separate reserve.
The market loss is identical, but the financial risk is much greater because the time horizon and asset selection do not match the goal.
Example 3: Concentrated Stock Portfolio
A ₹20,00,000 portfolio contains ₹9,00,000 in one company.
The company falls 45%, while the rest of the portfolio remains unchanged.
Loss from the concentrated holding:
₹9,00,000 × 45% = ₹4,05,000
Portfolio drawdown caused by that holding alone:
₹4,05,000 ÷ ₹20,00,000 = 20.25%
One position created a portfolio-level drawdown above 20%.
Example 4: Drawdown with Regular Contributions
An investor contributes ₹25,000 monthly during a weak market.
The account value may recover partly because of new cash, so the raw balance does not show the investment return clearly.
Use the XIRR Calculator to measure annualised performance across irregular or periodic cash flows.
Example 5: Withdrawal during a Decline
A retirement portfolio peaks at ₹60,00,000 and falls to ₹48,00,000, a 20% drawdown.
If the investor withdraws ₹6,00,000 during the decline, only ₹42,00,000 remains before any recovery.
The portfolio now needs:
(₹60,00,000 − ₹42,00,000) ÷ ₹42,00,000 × 100 = 42.86%
to return to the former ₹60,00,000 level.
Withdrawals during weak markets can deepen the recovery challenge.
Using RegalTicker Calculators in the Drawdown Workflow
Calculators make assumptions visible. They do not forecast the market.
Stock Return Calculator
Use the Stock Return Calculator to calculate total profit or loss and annualised return for a holding, including dividends.
It is useful for comparing the current outcome with the original purchase value, while drawdown separately compares current value with the previous peak.
CAGR Calculator
Use the CAGR Calculator to estimate the annualised growth rate between a starting and ending value over a chosen period.
CAGR can show that a portfolio with a strong long-term growth rate may still have experienced difficult drawdowns along the way.
XIRR Calculator
Use the XIRR Calculator when deposits and withdrawals occur on different dates.
This is important when account-value changes are affected by cash flows.
Risk-Reward Calculator
Use the Risk-Reward Calculator before adding a new trading position during a drawdown.
A lower market price is not automatically a low-risk entry. Entry, invalidation, target and quantity still need analysis.
Stock Average Calculator
Use the Stock Average Calculator when purchases are made in several tranches.
A lower average price does not guarantee lower total risk because the quantity and capital exposure have increased.
Brokerage Calculator
Use the Brokerage Calculator before frequent rebalancing or partial exits.
Zero brokerage does not mean zero cost; statutory and exchange charges can still apply.
Capital Gains Tax Calculator
Use the Capital Gains Tax Calculator to estimate the tax effect of a realised listed-equity gain under the entered assumptions.
Tax should not prevent necessary risk control, but it should be included in the decision.
SIP and SWP Calculators
The SIP Calculator illustrates contribution-based accumulation.
The SWP Calculator illustrates how withdrawals interact with assumed portfolio returns.
Together, they help investors think about cash moving into and out of the portfolio.
Investor Tools Hub
The RegalTicker Investor Tools Hub contains the complete calculator collection.
Common Capital-Protection Mistakes
Mistake 1: Treating Every Decline as a Permanent Loss
Market-wide declines can be temporary. Selling everything without analysis may lock in a loss.
Mistake 2: Treating Every Decline as Temporary
A failed company or broken thesis may never recover. “It will come back” is not analysis.
Mistake 3: Measuring from the Purchase Price Only
Drawdown is measured from the previous peak. Purchase-price return answers a different question.
Mistake 4: Ignoring Recovery Mathematics
A 50% decline requires a 100% gain to recover.
Mistake 5: Using Emergency Money in Volatile Assets
A forced withdrawal during a drawdown can convert temporary volatility into permanent loss.
Mistake 6: Averaging Down Automatically
Buying more increases exposure. Recheck the thesis, concentration, liquidity and total risk first.
Mistake 7: Taking More Risk to Recover Faster
After a loss, investors may use leverage or oversized positions to “win it back.” This can deepen the drawdown.
Mistake 8: Holding Too Much Cash Forever
Permanent defensiveness may protect nominal capital but fail to meet long-term goals after inflation.
Mistake 9: Rebalancing Too Frequently
Excessive trading creates charges, taxes and behavioural noise.
Mistake 10: Changing the Strategy at the Bottom
Switching from a growth strategy to a defensive strategy only after a major decline can sell low and buy safety after it has become expensive.
Mistake 11: Comparing Incompatible Portfolios
A small-cap portfolio and a conservative hybrid portfolio should not be expected to have the same drawdown behaviour.
Mistake 12: Assuming Diversification Always Works Immediately
Correlations can rise during market stress. Several assets may fall together.
Mistake 13: Ignoring Currency, Credit and Liquidity Risk
A portfolio may appear diversified by name but depend on the same underlying risk.
Mistake 14: Following Guaranteed-Return Claims
No legitimate market investment can remove all risk. Be cautious of assured-return or low-risk high-return promises.
Portfolio Drawdown Checklist
Before a downturn:
- Separate emergency and near-term goal money.
- Define target asset allocation.
- Set concentration limits.
- Avoid unsuitable leverage.
- Understand the liquidity of each holding.
- Estimate a realistic drawdown range.
- Write rebalancing rules.
- Review insurance and debt obligations.
- Keep calculator assumptions documented.
- Know which conditions would invalidate an investment thesis.
During a downturn:
- Measure decline from the previous peak.
- Check whether cash flows caused part of the account-value change.
- Protect essential liquidity.
- Review concentration and leverage.
- Distinguish market-wide decline from company-specific failure.
- Rebalance only according to the written plan.
- Estimate charges and tax before large transactions.
- Avoid revenge trading.
- Record every material decision.
- Seek qualified advice when the portfolio affects essential goals.
After recovery:
- Review the maximum drawdown.
- Review time under water.
- Compare expected and actual behaviour.
- Identify hidden concentration.
- Update allocation or risk limits where justified.
- Do not increase risk simply because the market recovered.
- Preserve the lessons in the written investment policy.
Frequently Asked Questions
Portfolio drawdown is the percentage decline from the portfolio’s previous highest value to a later lower value.
What is maximum drawdown?
Maximum drawdown is the deepest peak-to-trough decline recorded during a chosen period.
How is drawdown calculated?
Drawdown % = (Current value − Previous peak value) ÷ Previous peak value × 100.
Is a 20% drawdown a 20% loss from my original investment?
Not necessarily. The portfolio may still be above the original investment amount. Drawdown is measured from the previous peak.
How much gain is required after a 20% loss?
A 25% gain is required because the recovery starts from 80% of the original value.
Why does a 50% loss require a 100% gain?
After a 50% loss, only half the capital remains. Doubling that remaining capital is required to return to the starting amount.
Does capital protection mean keeping all money in cash?
No. It means matching capital to goals, liquidity needs, risk capacity and time horizon. Long-term money may require growth assets, while near-term money generally needs greater stability.
Can diversification prevent drawdowns?
Diversification can reduce company-specific or asset-specific risk, but it cannot eliminate broad market risk.
Should I sell during a drawdown?
The answer depends on why the portfolio fell, whether the investment thesis changed, the investor’s financial needs, allocation, tax position and risk plan. A calculator cannot make this decision.
Is averaging down a capital-protection strategy?
Not by itself. Averaging reduces the average purchase price but increases quantity and total exposure.
How often should a portfolio be rebalanced?
Common approaches include calendar-based reviews and tolerance-band reviews. The appropriate method depends on costs, taxes, portfolio size and strategy.
Which calculator is most useful during a drawdown?
Use several tools for different questions: Stock Return for actual holding performance, XIRR for cash-flow-adjusted performance, Brokerage and Tax calculators for transactions, and Risk-Reward for new trading positions.
Can a stop-loss guarantee capital protection?
No. Stop orders can execute at worse prices during gaps or poor liquidity, and long-term portfolio risk involves more than one exit order.
What is a reasonable maximum drawdown?
There is no universal percentage. A reasonable level depends on asset mix, time horizon, income stability, liquidity needs, financial goals and behavioural tolerance.
Final Takeaway
Portfolio drawdown is not merely a red percentage on a screen.
It measures how far the portfolio has fallen from its previous best value and how difficult the path back may become.
Capital protection means preparing before that decline occurs:
- keep essential liquidity separate;
- match assets with time horizon;
- diversify across meaningful risk sources;
- control position size and concentration;
- avoid unsuitable leverage;
- define review and rebalancing rules;
- understand transaction costs and taxes;
- measure both drawdown depth and duration;
- protect behaviour through a written plan.
A portfolio does not need to avoid every fall. It needs to survive difficult periods without forcing the investor to sacrifice essential goals or abandon a sound long-term process.
Use the Stock Return Calculator, CAGR Calculator, XIRR Calculator, Risk-Reward Calculator, Brokerage Calculator and complete Investor Tools Hub to make the arithmetic visible.
Continue Learning on RegalTicker
- Risk Management in Stock Market
- Position Sizing in Stock Market
- Risk-Reward Ratio in Stock Market
- Stop-Loss Orders in Stock Market
- Diversification and Asset Allocation Explained
- Risk Management Learning Hub
- All Investor Tools
Official References
- SEBI Investor — How to Manage Investment Risks
- SEBI Investor — Factors to Consider Before Investing
- SEBI Investor — Key Risks in Investing
- SEBI Investor — Do’s and Don’ts
- SEBI Investor — Understanding the Riskometer
- NSE India — Advisory for Investors
Educational disclaimer: This article is for general investor education only. It is not personalised financial advice, investment advice, tax advice, a research recommendation, a solicitation or a guarantee of returns. Market investments involve risk, portfolio values can fall, and actual losses may exceed planned amounts. Rules, taxes, charges and market conditions can change. Verify current information through official sources and seek advice from appropriately qualified professionals where necessary.