

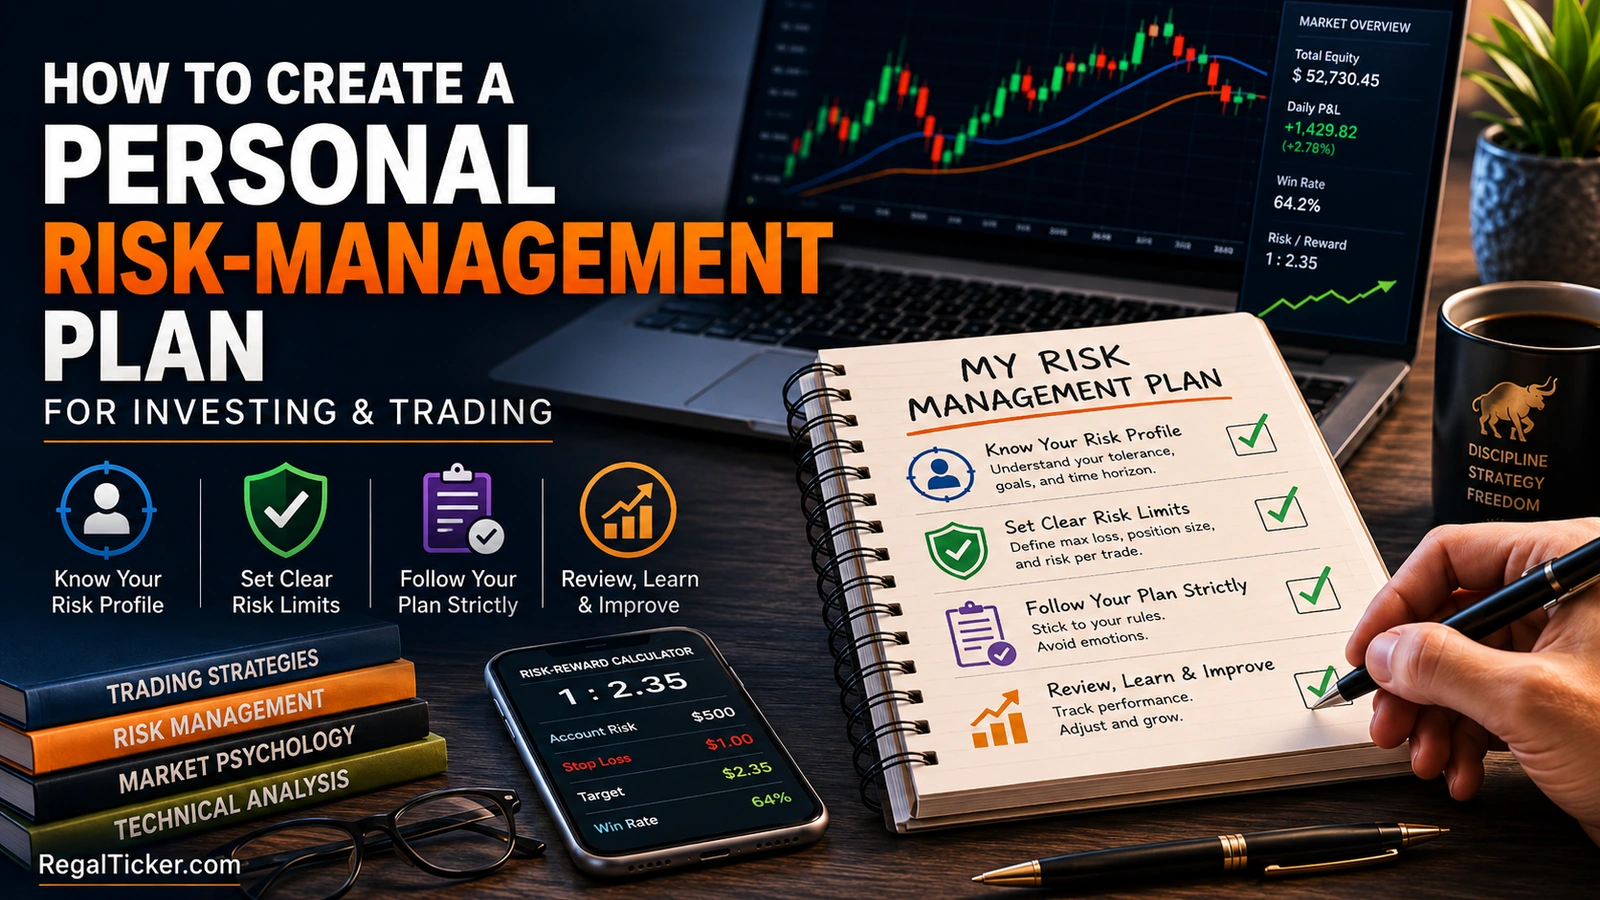
⚡ Quick answer
A personal risk-management plan is a written set of financial and behavioural rules that defines how much capital may be exposed, how investments are allocated, how individual positions are sized, when losses trigger a pause or review, and how decisions are evaluated. It connects financial goals with practical limits. The plan should be created before a market decline or emotional trading sequence—not during one.
Investor note
Key Takeaways
Start with financial goals, essential liquidity and investment horizon—not expected returns. Separate emergency and near-term money from long-term risk capital. Risk appetite and risk capacity are different. Define portfolio-level, position-level and activity-level limits. Use a maximum loss in rupees as well as a percentage. A stop-loss does not replace position sizing or diversification. Include brokerage, taxes and slippage in the plan. Create separate rules for investing, trading and speculative capital. Write the conditions that require a pause, review, rebalance or exit. Use calculators to verify numbers, but keep assumptions realistic. Review the plan periodically and after material life changes. Do not change the plan simply because the latest trade won or lost.
A personal risk-management plan is where the earlier Risk & Psychology lessons become one usable system.
The previous lessons explained:
risk management in the stock market; position sizing; risk-reward ratio; stop-loss orders; diversification and asset allocation; portfolio drawdown and capital protection; trading psychology; behavioural biases in investing.
This lesson combines them.
The aim is not to predict every market event. The aim is to decide in advance:
what money may be exposed; what level of loss is survivable; how exposure is divided; how quantity is calculated; what actions are prohibited; when activity must stop; how the plan is reviewed.
SEBI’s investor guidance emphasises understanding goals, risk appetite, investment horizon, diversification, asset allocation, liquidity and periodic review. A personal risk-management plan translates those principles into rules that can be followed consistently.
What a Personal Risk-Management Plan Must Do
A useful plan should answer six questions.
- What is the money for?
- When may the money be needed?
- How much temporary decline can be tolerated financially?
- How much decline can be tolerated behaviourally?
- How will exposure be limited before investing or trading?
- What will trigger a review or pause?
Risk Appetite vs Risk Capacity
Risk appetite describes willingness to accept uncertainty.
Risk capacity describes the financial ability to absorb a loss.
A person may enjoy taking risk but have low capacity because:
- income is unstable;
- debt obligations are high;
- dependants rely on the capital;
- emergency savings are insufficient;
- a major goal is approaching;
- portfolio withdrawals have begun.
The plan should follow the lower practical limit.
Investment Risk vs Trading Risk
Long-term investment risk may include:
- business deterioration;
- valuation risk;
- sector concentration;
- market-wide decline;
- liquidity risk;
- asset-allocation mismatch;
- failure to meet a financial goal.
Trading risk may include:
- entry slippage;
- stop-loss gap;
- excessive quantity;
- overtrading;
- leverage;
- revenge trading;
- repeated transaction costs.
One plan can cover both, but the rules should not be identical.
Written Rules Beat Memory
A remembered rule changes easily under pressure.
A written rule can be compared with actual behaviour.
The plan does not need complicated language. It needs enough precision to make the next action clear.
Build the Financial and Portfolio Foundation
Step 1: Define Financial Goals and Time Horizons
Risk management begins with the purpose of the money.
Separate Goals by Time
A practical structure is:
| Goal bucket | Typical priority |
|---|---|
| Emergency money | Liquidity and stability |
| Near-term goal | Capital preservation |
| Medium-term goal | Balanced risk and growth |
| Long-term wealth | Growth with controlled volatility |
| Trading capital | Strict loss limits |
| Speculative capital | Small, predefined maximum loss |
The exact period depends on personal circumstances. The important point is that money needed soon should not depend on a favourable market price at the exact withdrawal date.
Write Each Goal Clearly
For every major goal, record:
- target amount;
- current amount;
- expected date;
- required monthly contribution;
- acceptable volatility;
- liquidity requirement;
- consequence of delay.
Use the SIP Calculator to test how contribution amount, expected return and duration affect a long-term accumulation goal.
Use the CAGR Calculator to compare the annual growth rate required between the current value and the target value.
The calculator result is an assumption-based projection. It is not a guaranteed return.
Match the Asset to the Horizon
A mismatch occurs when:
- short-term goal money is placed in highly volatile assets;
- long-term capital remains permanently idle from fear;
- illiquid investments are used for uncertain near-term needs;
- retirement withdrawals depend entirely on current equity prices.
SEBI notes that investors should consider safety, return and liquidity, and choose investments appropriate for goals, risk tolerance and time horizon.

Step 2: Protect Essential Liquidity
Liquidity protects the investor from forced selling.
Emergency Reserve
The plan should specify:
- target reserve amount;
- where it is held;
- what qualifies as an emergency;
- when the reserve is replenished;
- whether insurance covers major risks.
A reserve is not judged primarily by return. Its purpose is availability.
Near-Term Goal Reserve
Money required within a short period may need a separate stability-focused bucket.
Examples include:
- tax payment;
- education fee;
- home down payment;
- medical expense;
- business requirement;
- retirement spending.
Withdrawal Planning
For portfolios funding regular withdrawals, use the SWP Calculator to test how withdrawal amount, assumed return and duration affect the projected balance.
Run conservative assumptions as well as optimistic assumptions.
A withdrawal plan that works only under a high return assumption is fragile.
Step 3: Define Portfolio-Level Risk Limits
Portfolio-level limits protect the complete financial plan.
Maximum Acceptable Drawdown
Write the portfolio decline that triggers:
- review;
- rebalancing;
- reduction of risk;
- consultation with a qualified adviser;
- temporary pause in new speculative exposure.
💡 Real example
Simple example
| Portfolio drawdown | Planned response | |—:|—| | 5% | No automatic action; monitor | | 10% | Review allocation and concentration | | 15% | Review liquidity and thesis quality | | 20% | Formal risk review and rebalance decision | | Above 25% | Suspend new speculative risk and reassess plan |
These are examples, not universal limits.
Review Portfolio Drawdown and Capital Protection before choosing the thresholds.
Concentration Limits
The plan may define maximum exposure to:
- one company;
- one sector;
- one theme;
- one small-cap segment;
- one employer’s shares;
- illiquid investments;
- leveraged products.
💡 Real example
Maximum single-stock exposure: 8% Maximum sector exposure: 25% Maximum speculative bucket: 5% Maximum illiquid exposure: 10%
The correct limits depend on the investor’s circumstances and strategy.
Asset-Allocation Ranges
Instead of one fixed percentage, use ranges.
💡 Real example
| Asset category | Target | Allowed range | |—|—:|—:| | Equity | 60% | 55%–65% | | Debt | 25% | 20%–30% | | Gold | 10% | 5%–15% | | Cash | 5% | 3%–10% |
A range reduces unnecessary rebalancing.
Read Diversification and Asset Allocation Explained before selecting a structure.
Scenario Test
Convert percentages into rupees.
For a ₹20,00,000 portfolio:
- 10% decline = ₹2,00,000;
- 20% decline = ₹4,00,000;
- 30% decline = ₹6,00,000.
Ask whether that rupee loss would:
- affect essential goals;
- change sleep or behaviour;
- cause panic selling;
- require borrowing;
- create family pressure.
The plan should be realistic at the rupee level.
Set Position and Activity Risk Limits
Step 4: Set Position-Level Risk Rules
Portfolio limits are not enough when one position is oversized.
Maximum Risk per Position
A position rule may be defined as:
- maximum capital allocation;
- maximum planned loss;
- maximum portfolio contribution to risk;
- maximum correlation with existing positions.
For a trade:
Position size = Maximum acceptable loss ÷ Risk per share
Suppose:
- account capital: ₹10,00,000;
- maximum risk per trade: 0.75%;
- entry: ₹500;
- stop: ₹485.
Maximum acceptable loss:
₹10,00,000 × 0.75% = ₹7,500
Risk per share:
₹500 − ₹485 = ₹15
Quantity:
₹7,500 ÷ ₹15 = 500 shares
Use the Risk-Reward Calculator to compare entry, stop, target, quantity and maximum planned loss.
Maximum Open Risk
Several positions can be individually acceptable but dangerous together.
💡 Real example
Five open trades Each risks 1% Total open risk = 5%
If the positions are strongly correlated, several stops may be hit together.
The plan may set:
maximum total open risk; maximum same-sector risk; maximum event exposure; maximum overnight risk.
Investing Position Limit
Long-term holdings may not use a fixed price stop, but they still need limits.
Possible controls include:
- maximum initial allocation;
- maximum allocation after price appreciation;
- thesis-failure conditions;
- debt or governance triggers;
- valuation limit for additional buying;
- review date.
Averaging Rules
The plan should state whether averaging down is allowed.
Example rule:
Averaging is permitted only when:
- the investment thesis remains valid;
- new evidence supports the addition;
- total exposure stays inside the concentration limit;
- liquidity remains sufficient;
- the purchase is not intended only to recover the original entry price.
Use the Stock Average Calculator to calculate the new weighted average and total quantity.
A lower average price does not automatically mean lower total risk.
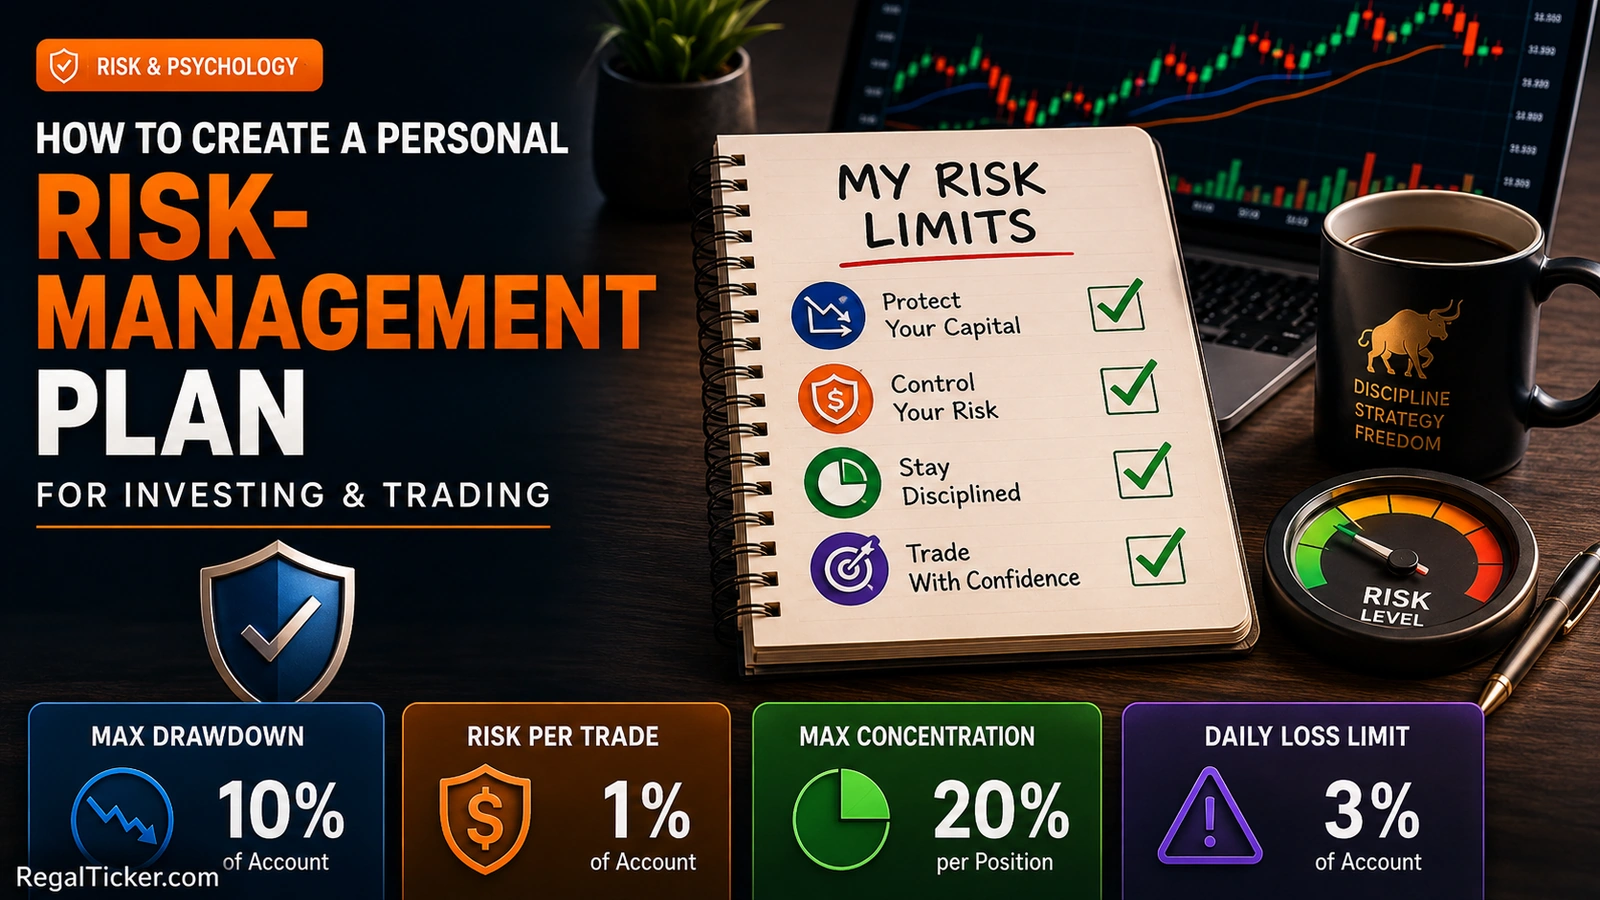
Step 5: Define Activity and Loss Limits
Activity limits protect the investor from emotional escalation.
Daily and Weekly Loss Limits
A trading plan may define:
- maximum daily loss;
- maximum weekly loss;
- maximum consecutive losses;
- maximum number of trades;
- maximum rule violations.
💡 Real example
Daily loss limit: 2R Weekly loss limit: 5R Maximum consecutive losses before review: 4 Maximum unplanned trades: 0
When the limit is reached, the response is predetermined.
Pause Rules
A pause may be triggered by:
- revenge-trading urge;
- moving a stop without evidence;
- oversized quantity;
- two impulsive trades;
- abnormal market conditions;
- technology or execution issue;
- inability to describe the setup clearly;
- personal stress or poor concentration.
Read Trading Psychology: Fear, Greed and Discipline and Behavioural Biases in Investing before writing behavioural triggers.
Cost Limit
Frequent activity creates friction.
Use the Brokerage Calculator to estimate:
- brokerage;
- STT;
- exchange charges;
- GST;
- stamp duty;
- DP charge where applicable;
- break-even price.
The plan may specify a minimum expected reward after costs.
Tax Awareness
Before a portfolio rebalance or profit-taking decision, use the Capital Gains Tax Calculator to estimate the tax effect under the entered assumptions.
Tax is an input—not a reason to hold a broken investment indefinitely.
Step 6: Create Entry, Exit and No-Action Rules
A plan should define what action is allowed and what action is prohibited.
Before Entry
Record:
- setup or investment thesis;
- entry area;
- maximum acceptable price;
- invalidation;
- target or expected value;
- position size;
- risk-reward;
- expected holding period;
- event risk;
- estimated charges.
Stop-Loss Rule
For trading positions, define:
- trigger logic;
- order type;
- gap-risk assumption;
- whether a trailing stop is permitted;
- when a stop may be tightened;
- whether a stop may ever be widened.
Review Stop-Loss Orders in Stock Market.
A stop order does not guarantee execution at the trigger price during gaps or poor liquidity.
Profit-Exit Rule
Possible structures include:
- fixed target;
- partial exit;
- trailing exit;
- time-based exit;
- thesis-based exit;
- valuation-based exit.
The plan should prevent a profitable position from becoming an undefined decision.
No-Action Rule
“No action” is often the correct action.
Examples:
- price is outside the entry range;
- risk-reward has deteriorated;
- quantity cannot fit the risk limit;
- the investor is acting from FOMO;
- the thesis has not been researched;
- liquidity is inadequate;
- total open risk is already high.

Build the Dashboard and Calculator Workflow
Step 7: Build a Personal Risk Dashboard
A one-page dashboard makes the plan usable.
Financial Section
Include:
- emergency reserve status;
- near-term goals;
- debt obligations;
- insurance status;
- expected cash needs;
- contribution plan.
Portfolio Section
Include:
- total portfolio value;
- current asset allocation;
- largest position;
- largest sector;
- current drawdown;
- illiquid exposure;
- speculative exposure.
Trading Section
Include:
- account capital;
- risk per trade;
- total open risk;
- daily loss used;
- weekly loss used;
- current losing streak;
- rule violations;
- transaction costs.
Behaviour Section
Record:
- dominant emotion;
- urgency level;
- sleep or stress concern;
- revenge-trading urge;
- FOMO;
- overconfidence after wins;
- avoidance after losses.
A dashboard is useful only when it changes decisions.
Step 8: Use Calculators as a Risk-Control Workflow
Calculators make hidden assumptions visible.
Goal and Contribution Planning
Use:
These help test accumulation, growth and withdrawal assumptions.
Performance Measurement
Use:
The Stock Return Calculator helps evaluate a single holding. XIRR is useful when deposits and withdrawals occur on different dates.
Position and Trade Planning
Use:
A practical sequence is:
Entry and stop → quantity → target → charges → maximum loss
Tax and Rebalancing
Use the Capital Gains Tax Calculator before large realised-gain decisions.
The complete calculator collection is available through the RegalTicker Investor Tools Hub.
Review, Rebalance and Improve the Plan
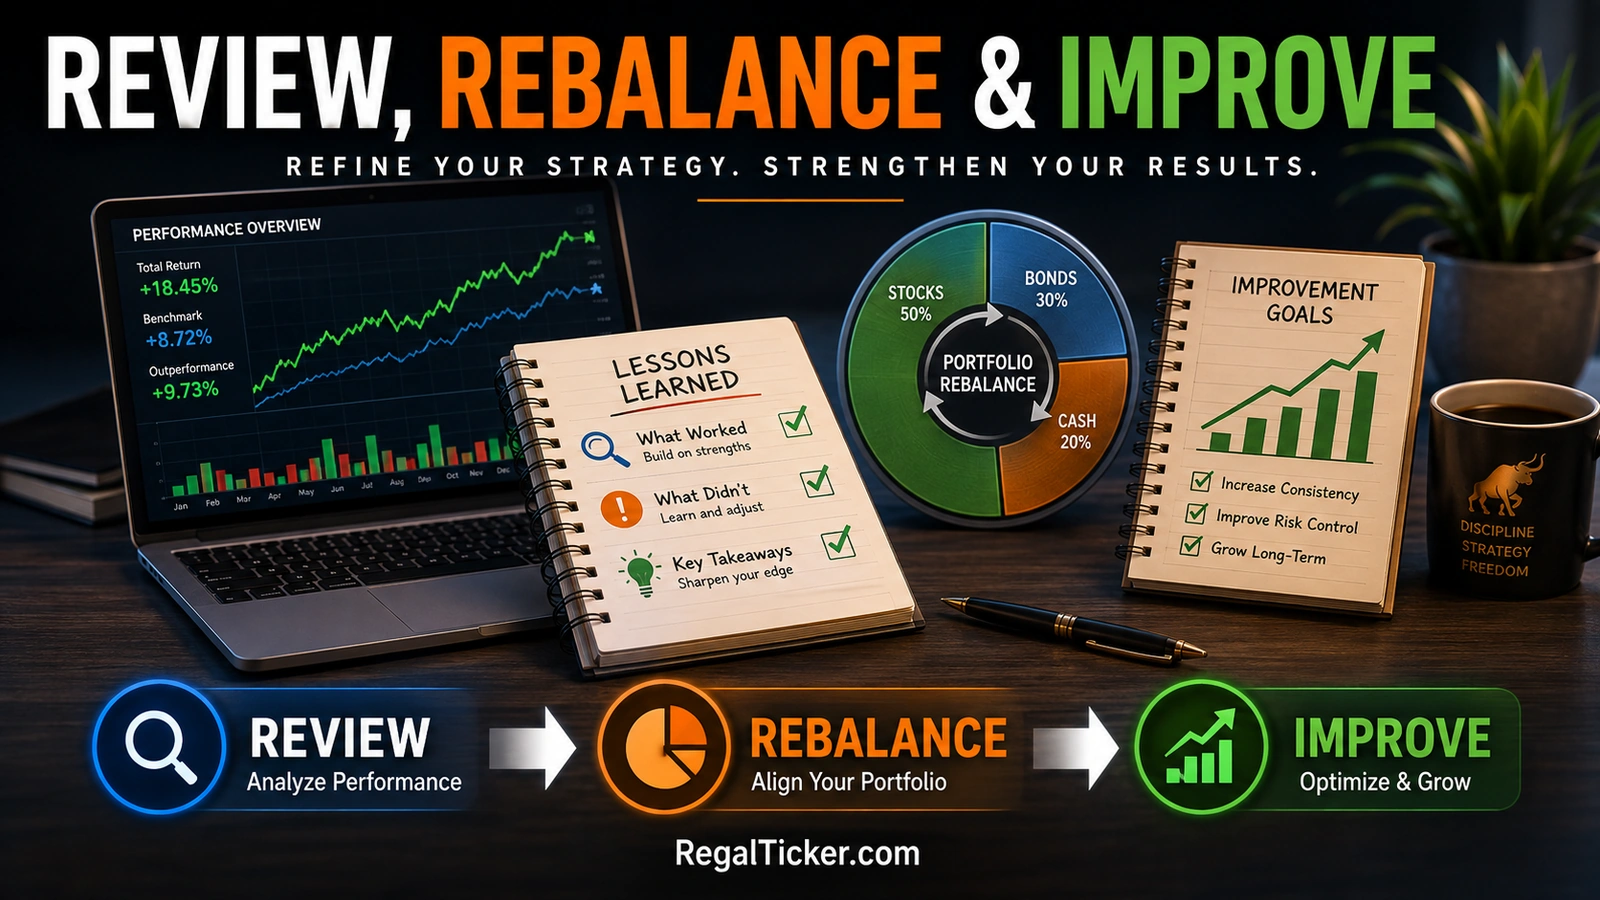
Step 9: Write the Review and Rebalancing Process
The plan should state when it is reviewed.
Scheduled Review
Possible frequencies:
- monthly trading review;
- quarterly portfolio review;
- annual full financial review.
Event-Based Review
Review after:
- job change;
- marriage;
- child;
- home purchase;
- retirement;
- major health event;
- inheritance;
- business change;
- significant drawdown;
- repeated rule violations.
What to Measure
Track:
- portfolio return;
- drawdown;
- XIRR where cash flows vary;
- allocation drift;
- concentration;
- transaction costs;
- tax impact;
- realised R;
- process score;
- behavioural mistakes.
Rebalancing Rule
A rebalancing rule may use:
- calendar dates;
- tolerance bands;
- major life events;
- risk-capacity changes.
Before selling, estimate cost and tax.
Use new contributions as a lower-friction rebalancing tool where appropriate.
A Sample Personal Risk-Management Plan
The following is an educational example.
Financial Foundation
- Emergency reserve: 8 months of essential expenses
- Near-term goal money: kept outside volatile assets
- Insurance review: once per year
- High-interest debt: prioritised before speculative investing
Portfolio Structure
- Equity target: 60%, range 55%–65%
- Debt target: 25%, range 20%–30%
- Gold target: 10%, range 5%–15%
- Cash target: 5%, range 3%–10%
- Single-stock limit: 8%
- Sector limit: 25%
- Speculative bucket: maximum 5%
Drawdown Rules
- 10% drawdown: review concentration
- 15% drawdown: review allocation and liquidity
- 20% drawdown: formal rebalancing decision
- 25% drawdown: suspend new speculative positions
Trading Rules
- Risk per trade: 0.5%
- Maximum open risk: 2%
- Daily loss limit: 1.5%
- Weekly loss limit: 4%
- No averaging a trade below the stop
- No stop widening
- No unplanned entry after a missed move
- Pause after two rule violations
Review Rules
- Weekly trade journal review
- Quarterly portfolio review
- Annual financial-plan review
- Immediate review after a major life change
This is not a recommendation. It demonstrates how a plan can be written clearly.
Common Mistakes and Final Checklist
Common Mistakes When Building the Plan
Using Return Targets as Risk Limits
A desired return does not define an acceptable loss.
Copying Another Person’s Plan
The plan must reflect personal goals, income, obligations, time horizon and behaviour.
Choosing a Percentage without Converting It to Rupees
The rupee loss may be emotionally or financially unacceptable.
Ignoring Correlation
Several positions may depend on the same market outcome.
Treating a Stop-Loss as Complete Protection
Gaps and liquidity can produce worse execution.
Setting Limits That Are Never Enforced
A limit without a predetermined response is only a preference.
Changing the Plan after Every Loss
One outcome is not enough evidence.
Increasing Risk after a Winning Streak
Recent success can create overconfidence.
Ignoring Brokerage and Tax
Net outcomes matter.
Mixing Emergency Money with Trading Capital
This creates financial pressure and emotional interference.
Using Too Many Rules
A plan that cannot be followed is not practical.
Never Reviewing the Plan
Goals and capacity change over time.
Personal Risk-Management Plan Checklist
Financial foundation:
- Are essential expenses protected?
- Is emergency liquidity separate?
- Are near-term goals protected from market timing?
- Are debt and insurance reviewed?
- Is the investment horizon written?
Portfolio rules:
- Is target allocation defined?
- Are ranges defined?
- Is maximum concentration defined?
- Is speculative exposure limited?
- Is maximum acceptable drawdown written?
Position rules:
- Is maximum risk per position defined?
- Is total open risk limited?
- Are averaging rules written?
- Are thesis-failure conditions written?
- Are costs considered?
Behavioural rules:
- Is FOMO a no-trade condition?
- Is revenge trading prohibited?
- Is there a daily loss limit?
- Is there a pause rule?
- Are rule violations recorded?
Review rules:
- Is a review schedule defined?
- Are life-event reviews defined?
- Is rebalancing based on ranges?
- Are results measured after costs?
- Is process reviewed separately from profit?
Frequently Asked Questions
What is a personal risk-management plan?
It is a written framework defining financial goals, capital allocation, acceptable losses, position limits, behavioural rules and review procedures.
Is a risk plan only for traders?
No. Investors also need liquidity, allocation, concentration, drawdown and review rules.
How much should I risk per trade?
There is no universal percentage. It depends on capital, strategy, stop distance, total open risk and financial capacity.
What is the difference between risk appetite and risk capacity?
Risk appetite is willingness to take risk. Risk capacity is the financial ability to absorb loss.
Should emergency money be invested in equities?
Money required for emergencies generally needs liquidity and stability rather than dependence on volatile market prices.
What is a maximum drawdown limit?
It is a predefined portfolio decline that triggers a review or risk response.
Does diversification remove risk?
No. It can reduce concentration and company-specific risk but cannot remove market-wide risk.
Is a stop-loss enough?
No. Position size, gaps, slippage, liquidity and total portfolio risk still matter.
How often should the plan be reviewed?
Use scheduled reviews and review after major life changes, abnormal drawdowns or repeated rule violations.
Can calculators create a risk plan?
They support calculations. The investor must still choose realistic assumptions and limits.
Should I change the plan after several losses?
Review execution and evidence first. Do not change a tested process solely because of a short losing sequence.
How do I control overtrading?
Use trade limits, loss limits, setup criteria, cost estimates and pause rules.
Should investing and trading use the same capital?
The plan should separate long-term goal capital, trading capital and speculative capital where their purposes and risk rules differ.
What is the most important part of the plan?
The most important part is using limits that are financially survivable and behaviourally enforceable.
Final Takeaway
A personal risk-management plan is not a prediction document.
It is a decision document.
It should define:
- the purpose of the money;
- the required liquidity;
- the asset-allocation range;
- the maximum acceptable drawdown;
- the position and concentration limits;
- the trading loss limits;
- the entry, exit and no-action rules;
- the behavioural pause triggers;
- the review and rebalancing process.
Build the plan before the market tests it.
Use the Risk-Reward Calculator, Brokerage Calculator, Stock Average Calculator, Stock Return Calculator, CAGR Calculator, XIRR Calculator, SIP Calculator, SWP Calculator, Capital Gains Tax Calculator and complete Investor Tools Hub to test the plan’s assumptions.
Continue Learning on RegalTicker
- Risk Management in Stock Market
- Position Sizing in Stock Market
- Risk-Reward Ratio in Stock Market
- Stop-Loss Orders in Stock Market
- Diversification and Asset Allocation Explained
- Portfolio Drawdown and Capital Protection
- Trading Psychology: Fear, Greed and Discipline
- Behavioural Biases in Investing
- Risk Management Learning Hub
- All Investor Tools
Official References
- SEBI Investor — How to Manage Investment Risks
- SEBI Investor — Key Risks in Investing
- SEBI Investor — Factors to Consider Before Investing
- SEBI Investor — Do’s and Don’ts of Investing
- SEBI Investor — Understanding the Riskometer
Educational disclaimer: This article is for general investor education only. It is not personalised financial advice, investment advice, tax advice, a research recommendation, a solicitation or a guarantee of returns. Market investments involve risk, actual losses can exceed planned amounts, and execution may differ from assumed prices. Verify current information through official sources and seek advice from appropriately qualified professionals where necessary.