

⚡ Quick answer
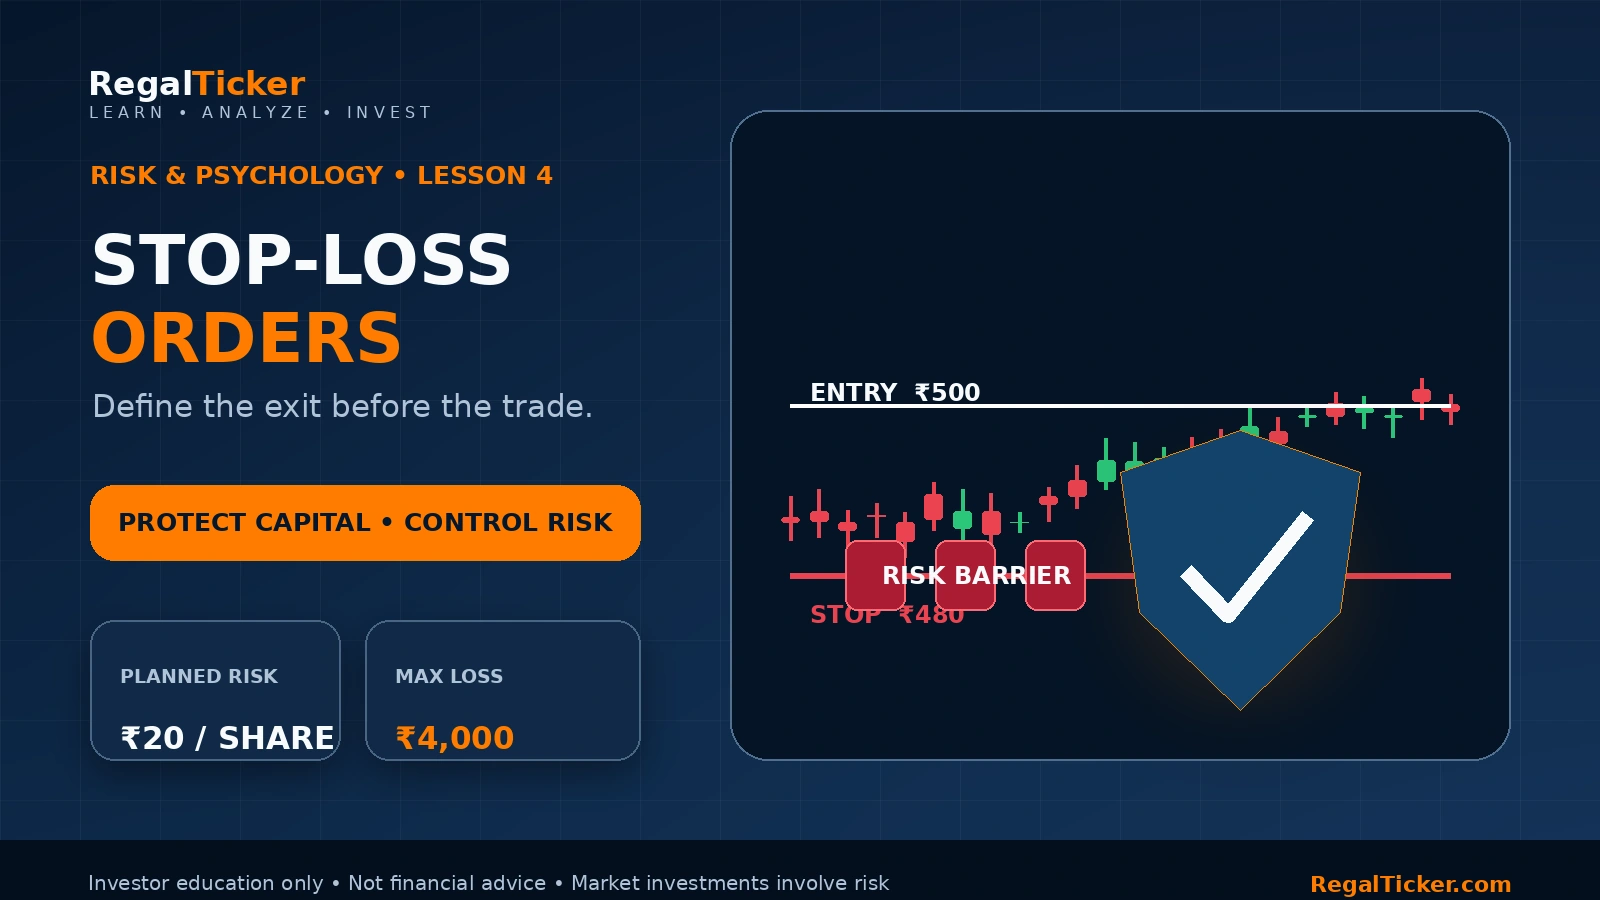
A stop-loss order in stock market trading is an instruction designed to activate when price reaches a predefined trigger level. It helps a trader exit when the original setup is invalidated, but it does not guarantee the exact exit price. Gaps, slippage, low liquidity, circuit limits and order conditions can cause the actual loss to differ from the planned calculation.
Investor note
Key Takeaways
A stop-loss is an exit-planning tool, not a guarantee against loss. The trigger price activates the order; execution may occur at a different price. Stop-market prioritises execution, while stop-limit adds price control but may remain unfilled. The stop should be placed where the trade idea becomes invalid, then quantity should be calculated from the stop distance. Moving a stop farther away after entry increases risk and breaks the original plan. Use the Risk-Reward Calculator, position-sizing formula and Brokerage Calculator together before entering a trade.
A stop-loss order in stock market trading is designed to activate when the market reaches a price selected in advance. Traders use it to limit a planned loss, protect an open gain or exit when the reason for entering a position is no longer valid.
The concept sounds simple: buy a share, place a stop below the entry and accept a limited loss if price falls. In practice, stop-loss planning involves several separate decisions:
where the trade idea becomes invalid; which order type to use; how much price movement should be allowed; how many shares can be purchased; what slippage or gap risk may occur; whether the security is liquid enough for the quantity; and whether the stop is being used as part of a tested process rather than as an emotional reaction.
A stop-loss can improve discipline because it defines the exit before fear, hope and open profit or loss begin to influence the decision. However, it cannot convert a poor setup into a good one, guarantee execution at the trigger or remove market risk.
This lesson follows Risk Management in Stock Market: A Beginner’s Guide, Position Sizing in Stock Market: Formula, Methods and Examples and Risk-Reward Ratio in Stock Market: Formula, Examples and Calculator. Together, these lessons form one workflow:
1. decide how much capital can be risked; 2. identify where the position becomes invalid; 3. calculate the distance to the stop; 4. size the position; 5. compare the possible reward with the risk; 6. estimate transaction costs; 7. record the plan before entry.
Use the RegalTicker Risk-Reward Calculator to test the entry, stop, target and quantity together. It shows the risk per share, total potential loss and total potential reward before a position is opened.
Key idea: A stop-loss is effective only when its placement, order type and position size are planned together.
What Is a Stop-Loss Order?
A stop-loss order is an order that becomes active only after the market price reaches or crosses a specified trigger level.
For a long position, the stop is normally below the entry price. For a short position, the stop is normally above the entry price.
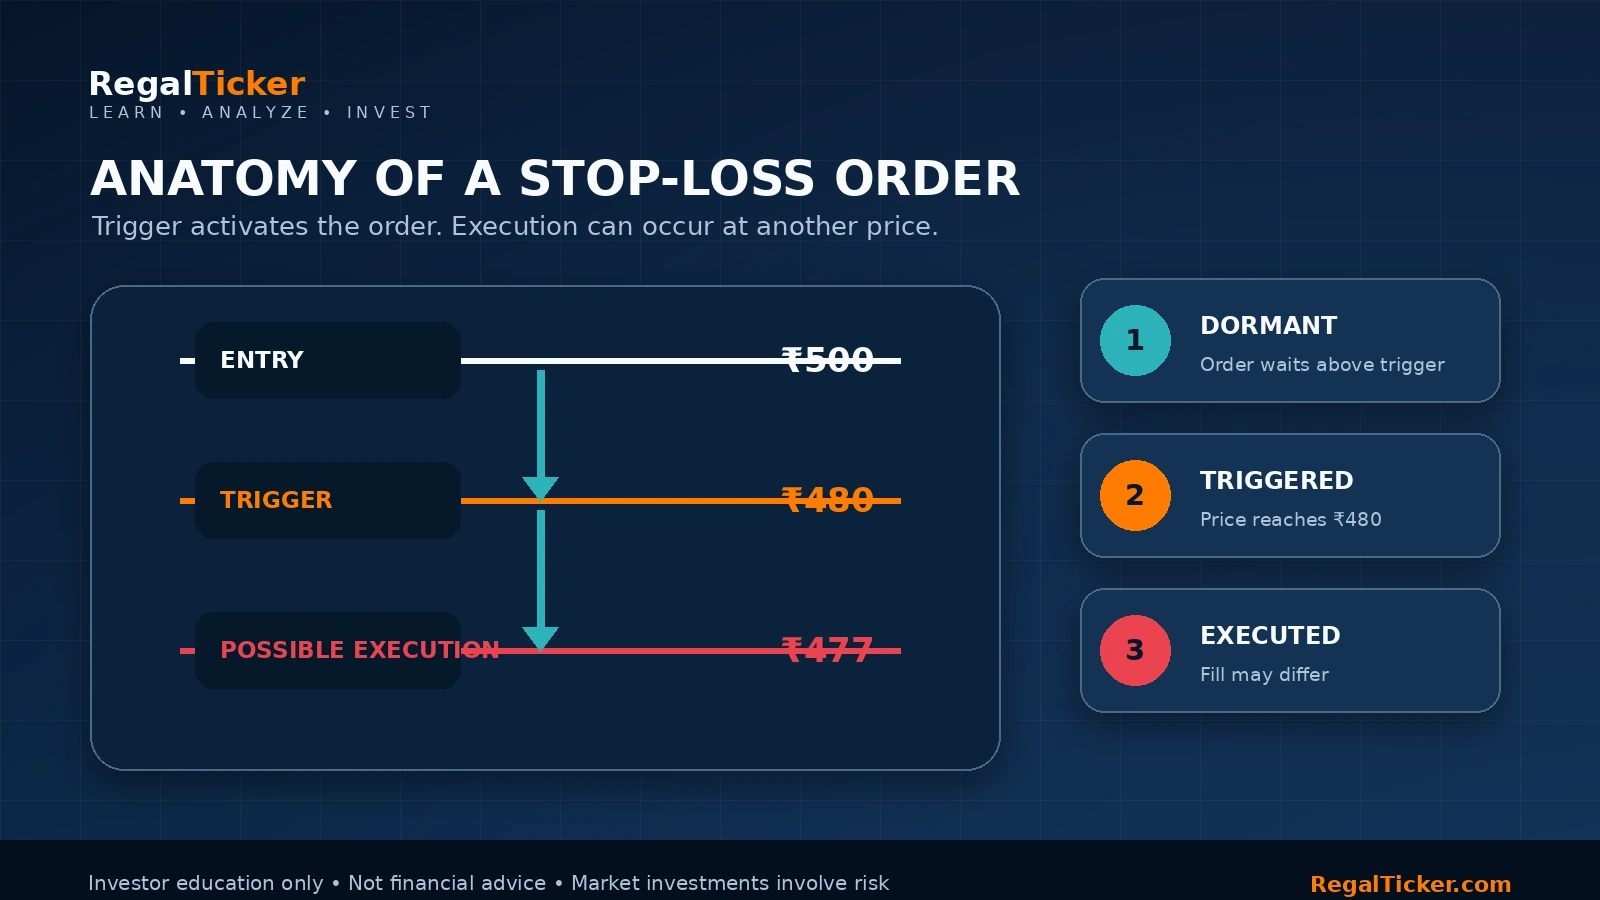
Suppose a trader buys a share at ₹500 and decides that the setup is invalid below ₹480. The ₹480 level becomes the stop trigger. If the market reaches the trigger, the stop order is activated according to the selected order type.
This distinction matters:
- Trigger price: the level that activates the order.
- Order price or market instruction: what the activated order does next.
- Execution price: the price at which the trade actually fills.
- Planned loss: the estimated loss based on entry and stop.
- Actual loss: the final result after execution, slippage and charges.
NSE explains that a stop-loss order remains outside the normal market until the last traded price reaches or crosses the trigger condition. Once triggered, the order enters the regular order book. That activation does not guarantee a fill at the trigger price.
Stop-Loss for a Long Position
For a long position:
- entry is above the stop;
- the trader expects price to rise;
- the stop activates if price falls to or below the trigger.
💡 Real example
Simple example
entry: ₹1,000; stop trigger: ₹960; risk per share: ₹40.
The calculated price risk is 4% of entry:
₹40 ÷ ₹1,000 × 100 = 4%
If quantity is 100 shares, the planned gross loss is:
₹40 × 100 = ₹4,000
Check the same setup in the Risk-Reward Calculator and compare the ₹4,000 potential loss with the target-side reward.
Stop-Loss for a Short Position
For a short position:
- entry is below the stop;
- the trader expects price to fall;
- the stop activates if price rises to or above the trigger.
💡 Real example
short entry: ₹800; stop trigger: ₹840; risk per share: ₹40.
The arithmetic is similar, but short selling introduces product, margin, liquidity and settlement considerations. A beginner should not assume that the same process applies identically across cash equity, futures and options.
A Stop-Loss Is Not a Prediction
The stop does not predict that price will reverse at a particular level. It states that the trader is no longer willing to remain in the position beyond that level.
A position may hit the stop and later recover. That does not automatically mean the stop was wrong. The correct question is whether the stop followed a rational, repeatable rule that protected capital across many trades.
A single outcome cannot validate or invalidate an entire process.
How a Stop-Loss Order Works
A stop-loss order usually moves through four stages:
- the order is placed with a trigger;
- the order remains inactive while the trigger condition is not met;
- the market reaches or crosses the trigger;
- the order becomes active and seeks execution.
The final result depends on the order type, available liquidity and market movement.
Trigger Price vs Execution Price
Assume a trader owns shares bought at ₹500 and sets a sell stop trigger at ₹480.
During normal trading, price moves:
₹488 → ₹484 → ₹481 → ₹480
At ₹480, the trigger condition is met. The order activates.
If sufficient buyers are available near ₹480, execution may occur close to the trigger. If price is falling quickly, fills may occur at ₹479, ₹477 or lower. If the stock opens the next day at ₹450 after bad news, the first available execution can be far below the planned stop.
Therefore:
Trigger price is not the same as guaranteed exit price.
Gap Risk
A gap occurs when price opens or trades at a level significantly different from the previous available price.
Assume:
- entry: ₹600;
- stop: ₹570;
- previous close: ₹580;
- next opening price after unexpected news: ₹520.
The planned risk was ₹30 per share, but the market is already ₹50 below the stop at the open. A stop instruction cannot create liquidity at ₹570 when buyers are available only much lower.
This is why planned loss must be treated as an estimate, not a ceiling.
Slippage
Slippage is the difference between the expected execution price and the actual execution price.
Slippage tends to become more important when:
- the stock has low trading volume;
- the bid-ask spread is wide;
- the order quantity is large relative to available depth;
- the market is moving rapidly;
- a major event is released;
- the stock is near a circuit limit;
- several traders are trying to exit at the same time.
Test a worse stop-execution price in the Risk-Reward Calculator, not only the ideal trigger. For example, compare ₹480 with a slippage scenario of ₹475 or ₹470.
Stop-Loss and Circuit Limits
Price bands and circuit limits can restrict how far a security is allowed to trade during a session. A stop may trigger without finding an executable counter-order, particularly when the market is locked at a limit.
A stop is an instruction submitted to the market. It is not insurance offered by the exchange or broker.
Stop-Loss and Partial Execution
A large order may be filled in several trades at different prices. If only part of the quantity executes near the trigger and the remaining quantity fills lower, the average exit can be worse than expected.
Position size should therefore consider liquidity, not only account capital.
Types of Stop-Loss Orders
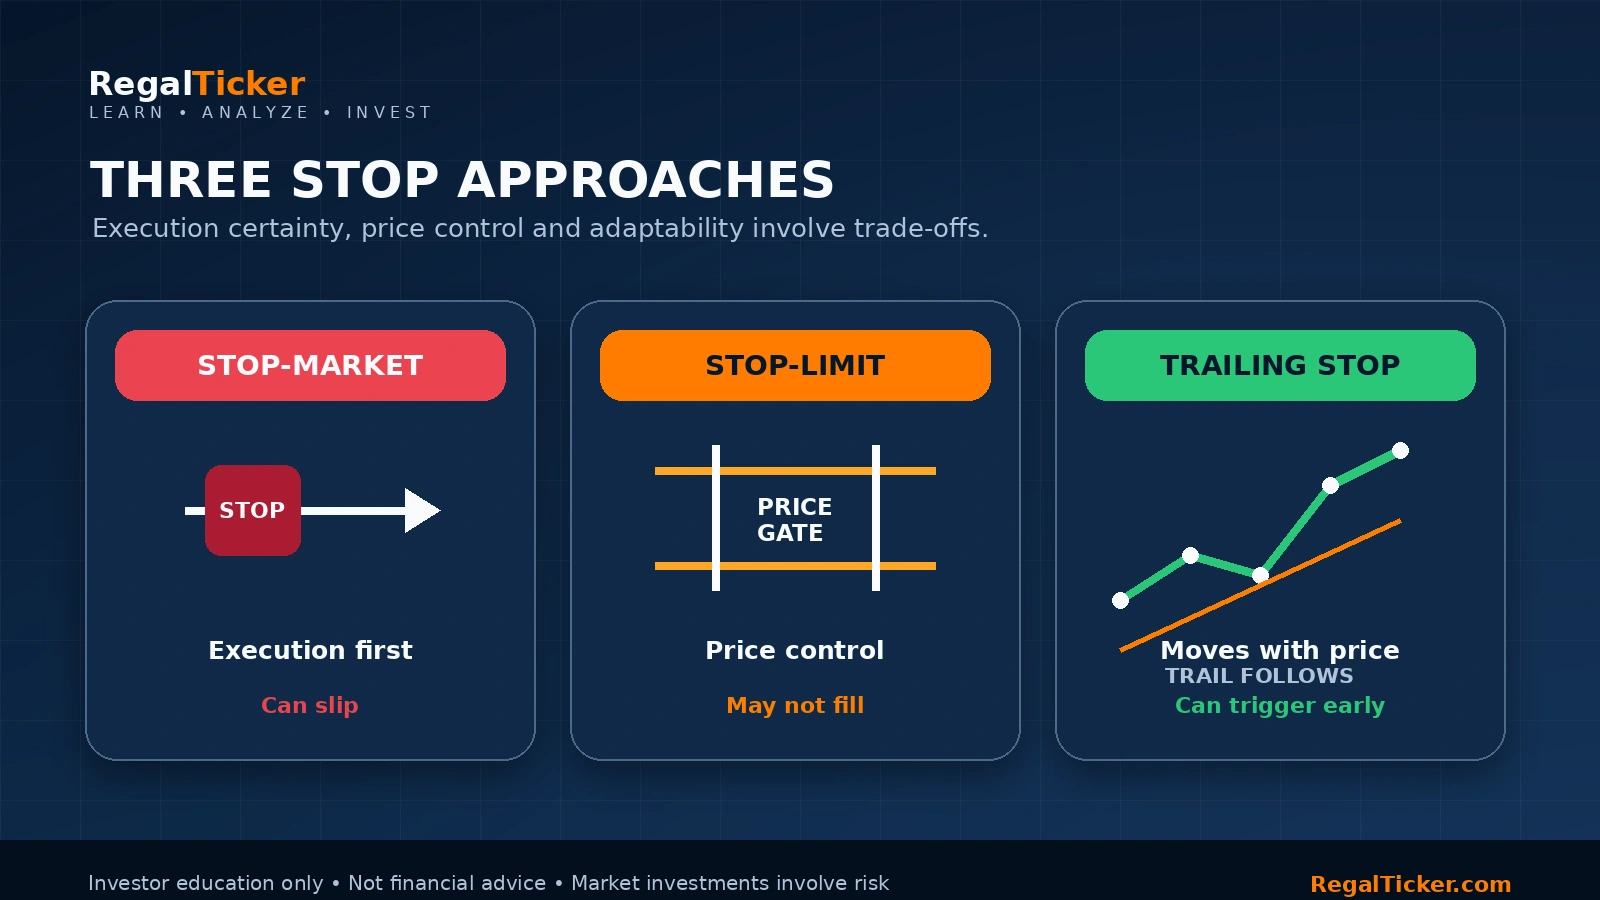
The exact order names and availability depend on the broker, exchange segment and product. The three most important concepts are stop-market, stop-limit and trailing stop.
Stop-Market Order
A stop-market order becomes a market order after the trigger condition is met.
Its priority is execution, not exact price control.
Potential advantage:
- greater probability of exiting after the trigger.
Primary risk:
- the execution price may be significantly worse during a gap, fast fall or illiquid market.
A stop-market approach can be useful when exiting is more important than controlling the final price, but the trader must understand that the loss can exceed the original calculation.
Stop-Limit Order
A stop-limit order uses two prices:
- trigger price: activates the order;
- limit price: specifies the worst acceptable execution price.
Example for a sell stop-limit:
- trigger: ₹480;
- limit: ₹476.
When ₹480 is reached, a sell limit order at ₹476 enters the order book. It can execute at ₹476 or better, but not below ₹476.
Potential advantage:
- provides a degree of price control.
Primary risk:
- the order may remain unfilled if price falls below the limit too quickly.
NSE has pre-trade validations for the relationship between stop-loss trigger and limit prices, and exchanges or brokers may update permitted ranges. Current platform instructions should always be checked before placing the order.
Trailing Stop
A trailing stop is designed to move in the favourable direction as price advances while remaining unchanged when price moves against the position.
💡 Real example
entry: ₹500; trailing distance: ₹20; price rises to ₹560; trailing stop moves to approximately ₹540 under a simple fixed-distance rule.
If price later falls to the trigger, the position exits.
A trailing stop can protect part of an open gain, but it does not guarantee the best exit. If set too close, normal volatility may trigger it. If set too far, a substantial part of the gain may be surrendered.
Broker implementations differ. Some trailing stops are maintained only within a session, some depend on the order product and some may be simulated by the broker rather than held natively at the exchange.
Manual or Mental Stop
A mental stop is a price the trader intends to respect without placing an actual order.
Its apparent advantage is flexibility. Its risk is that hesitation, hope, distraction, a technical problem or rapid movement prevents timely execution.
Mental stops demand exceptional discipline and constant monitoring. They are generally less reliable for beginners than a documented order-based plan.
Time Stop
A time stop exits a position when the expected move does not occur within a defined period.
💡 Real example
a breakout is expected to follow through within three sessions; after three sessions, price remains flat; the trader exits even though the price stop has not been reached.
A time stop controls opportunity cost and thesis decay. It can be combined with a price-based stop rather than replacing it.
Stop-Loss Calculation Formulas
A stop-loss calculation connects price risk with total capital risk.
Risk Per Share
For a long position:
Risk per share = Entry price − Stop price
For a short position:
Risk per share = Stop price − Entry price
General form:
Risk per share = |Entry price − Stop price|
Stop-Loss Percentage
For a long position:
Stop-loss percentage = (Entry price − Stop price) ÷ Entry price × 100
💡 Real example
entry: ₹750; stop: ₹720.
Stop distance:
₹750 − ₹720 = ₹30
Stop-loss percentage:
₹30 ÷ ₹750 × 100 = 4%
Total Planned Gross Loss
Total planned gross loss = Risk per share × Quantity
💡 Real example
risk per share: ₹30; quantity: 150 shares.
Total planned gross loss:
₹30 × 150 = ₹4,500
This excludes brokerage, statutory charges and slippage.
Position Size From Maximum Rupee Risk
Quantity = Maximum planned rupee risk ÷ Risk per share
Assume:
- maximum planned loss: ₹3,000;
- entry: ₹500;
- stop: ₹485;
- risk per share: ₹15.
Quantity:
₹3,000 ÷ ₹15 = 200 shares
Position value:
₹500 × 200 = ₹1,00,000
The position sizing guide explains the complete process and why quantity should be rounded down rather than up when the result is not a whole number.
Stop Price From a Percentage
For a long position:
Stop price = Entry price × (1 − Stop percentage)
If entry is ₹1,000 and the selected stop distance is 5%:
₹1,000 × (1 − 0.05) = ₹950
For a short position:
Stop price = Entry price × (1 + Stop percentage)
Percentage stops are easy to calculate but can ignore volatility and market structure. A 3% move may be large for one security and ordinary noise for another.
Effective Loss After Costs and Slippage
A more realistic estimate is:
Effective loss = Price loss + Slippage + Estimated transaction costs
Assume:
- planned price loss: ₹4,000;
- slippage: ₹700;
- estimated charges: ₹250.
Effective estimated loss:
₹4,000 + ₹700 + ₹250 = ₹4,950
Use the Brokerage Calculator to estimate brokerage, STT, exchange charges, SEBI fees, GST, stamp duty and applicable DP charges. Then test a realistic slippage price separately.
How to Choose a Stop-Loss Level
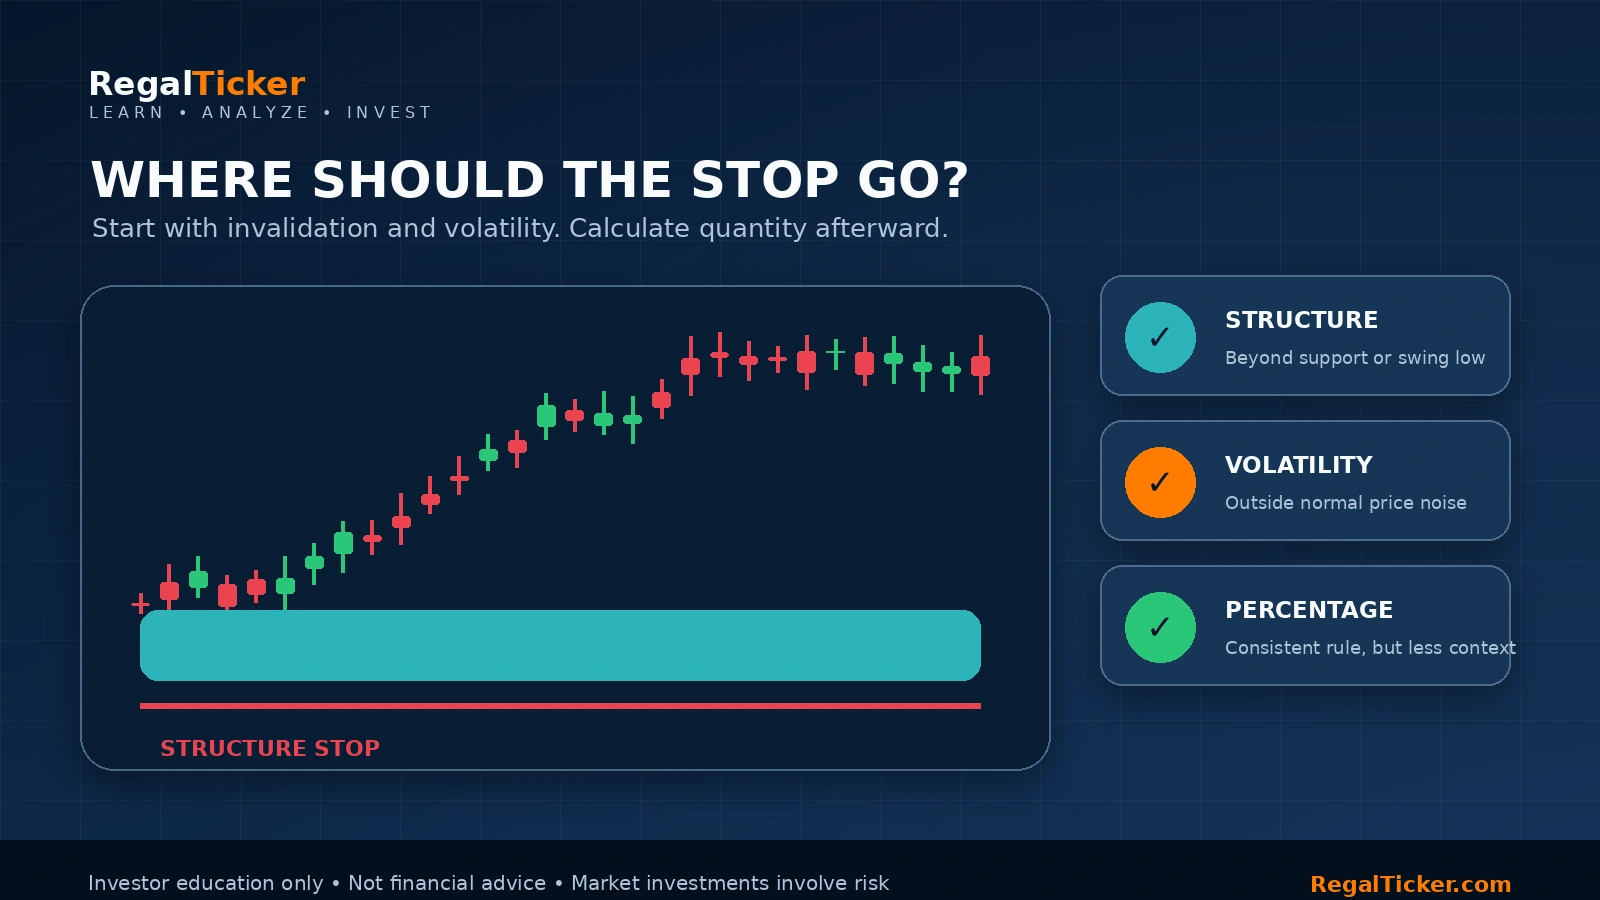
The stop should be chosen from the trade thesis and market behaviour. Quantity should be calculated afterward.
Market-Structure Stop
A market-structure stop is placed beyond a level that invalidates the setup, such as:
- below a meaningful support zone;
- below a confirmed swing low;
- below the low of a breakout base;
- above resistance for a short position;
- beyond a trendline or pattern boundary;
- outside the level that justified entry.
Review Support and Resistance in the Stock Market before using a structure-based stop.
A support zone is usually an area, not one exact rupee value. Placing a stop directly at an obvious level can expose it to ordinary tests of that zone.
Volatility-Based Stop
A volatility-based stop allows for the security’s normal price movement.
Possible inputs include:
- average true range;
- recent candle ranges;
- historical volatility;
- average intraday movement;
- gap behaviour;
- event-driven volatility.
The purpose is not to maximise the distance. It is to avoid placing the stop inside normal market noise.
A wider stop requires a smaller quantity if the same rupee risk limit is maintained.
Percentage-Based Stop
A fixed percentage stop may be useful for consistent screening or broad portfolio rules.
Examples include 3%, 5% or 8%, but there is no universally correct percentage. The same figure can be too tight for a volatile small-cap stock and unnecessarily wide for a stable large-cap stock.
Percentage rules should be tested against:
- timeframe;
- security volatility;
- strategy;
- liquidity;
- expected reward;
- historical results.
Candle-Based Stop
A candle-based stop may be placed beyond:
- the signal candle low;
- the pattern low;
- the breakout candle;
- a rejection wick;
- a reversal structure.
Read How to Read Candlestick Charts: A Beginner’s Guide before relying on a single candle. Candlesticks require context; one pattern alone is not a complete trade thesis.
Time-Based and Thesis-Based Exit
Not every exit must be triggered by a price level.
A trader or investor may exit because:
- the expected move did not occur within the planned period;
- the business thesis changed;
- earnings quality deteriorated;
- leverage increased materially;
- a key support in the thesis disappeared;
- portfolio concentration became excessive;
- a better risk-adjusted opportunity became available.
Long-term investors may use thesis invalidation and allocation limits more than tight mechanical stops.
Why Entry Quality Matters
A better entry can reduce the distance to a logical stop and improve the risk-reward ratio.
Assume support is near ₹480 and invalidation is ₹470.
Entry A at ₹500:
- risk = ₹30.
Entry B at ₹485:
- risk = ₹15.
With the same ₹3,000 maximum loss:
- quantity at Entry A = 100 shares;
- quantity at Entry B = 200 shares.
However, waiting for a lower entry does not guarantee execution, and buying only because price is cheaper is not enough. The setup must still be valid.
Use the Risk-Reward Calculator to compare the original planned entry with a chased entry or an improved pullback entry.
Worked Stop-Loss Examples
Example 1: Structure-Based Long Trade
Assume:
- entry: ₹820;
- support zone: ₹785–₹790;
- stop trigger: ₹780;
- target: ₹940;
- maximum planned price loss: ₹4,000.
Risk per share:
₹820 − ₹780 = ₹40
Quantity:
₹4,000 ÷ ₹40 = 100 shares
Total position value:
₹820 × 100 = ₹82,000
Potential reward per share:
₹940 − ₹820 = ₹120
Potential reward:
₹120 × 100 = ₹12,000
Risk-reward ratio:
₹12,000 ÷ ₹4,000 = 3
The gross plan is 1:3. Enter the values in the Risk-Reward Calculator, then check the expected net result with the Brokerage Calculator.
Example 2: Stop Too Tight for Normal Volatility
Assume:
- entry: ₹500;
- support zone: ₹470–₹475;
- stop chosen only 1% below entry: ₹495.
The stop is ₹5 away, giving a very large calculated quantity for a fixed rupee risk. But if the stock commonly moves 2%–3% during ordinary sessions, the stop may sit inside normal noise.
The displayed risk-reward ratio can look excellent because the denominator is artificially small. The process is weak because the stop does not represent invalidation.
The solution is not automatically to widen the stop while keeping the same quantity. The correct sequence is:
- identify a logical stop;
- recalculate risk per share;
- reduce quantity;
- reassess whether the target still offers acceptable reward.
Example 3: Gap Below the Stop
Assume:
- entry: ₹600;
- stop trigger: ₹570;
- quantity: 200 shares;
- planned gross loss: ₹6,000.
Unexpected news causes the next available price to be ₹535.
Actual price loss per share:
₹600 − ₹535 = ₹65
Gross price loss:
₹65 × 200 = ₹13,000
The loss is more than double the original plan before charges.
This example shows why concentrated positions, overnight event risk and illiquid securities require extra caution.
Example 4: Stop-Limit Order Does Not Fill
Assume a sell stop-limit order uses:
- trigger: ₹480;
- limit: ₹475.
The stock falls rapidly from ₹482 to ₹468.
The trigger activates, but the limit order cannot sell below ₹475. If no buyer is available at ₹475 or better, the position remains open while price continues lower.
The limit protected price control but sacrificed execution certainty.
Example 5: Trailing Stop Protects Part of a Gain
Assume:
- entry: ₹300;
- initial stop: ₹285;
- price rises to ₹360;
- trailing rule maintains a ₹20 distance;
- trailing stop rises to ₹340.
If price reverses and executes near ₹340:
- gain per share = ₹40;
- original risk per share = ₹15;
- realised gross R-multiple = ₹40 ÷ ₹15 = 2.67R.
The actual result may differ because of execution and charges. Use the Stock Return Calculator after exit and compare the realised result with the initial plan.
Example 6: Moving the Stop Farther Away
Assume:
- entry: ₹1,000;
- original stop: ₹960;
- quantity: 100 shares;
- original planned loss: ₹4,000.
Price falls to ₹965. The trader moves the stop to ₹920 to avoid being stopped.
New price risk:
₹1,000 − ₹920 = ₹80 per share
New planned loss:
₹80 × 100 = ₹8,000
The trader has doubled the risk after entry without improving the setup.
A stop can be adjusted when new evidence justifies it, but moving it farther away solely to avoid accepting a loss is not risk management.
Example 7: Averaging Down Changes Total Risk
Assume:
- first purchase: 100 shares at ₹500;
- second purchase: 100 shares at ₹460;
- stop remains ₹430.
Use the Stock Average Calculator:
Weighted average entry:
(100 × ₹500 + 100 × ₹460) ÷ 200 = ₹480
Risk per share from average:
₹480 − ₹430 = ₹50
Total planned gross risk:
₹50 × 200 = ₹10,000
A lower average price does not necessarily mean lower total risk. Quantity has doubled and more capital is committed to a position that moved against the original entry.
Example 8: Charges Reduce a Small Target
Assume:
- entry: ₹500;
- stop: ₹490;
- target: ₹515;
- quantity: 500 shares.
Gross planned loss:
₹10 × 500 = ₹5,000
Gross potential profit:
₹15 × 500 = ₹7,500
Gross ratio:
1:1.5
After brokerage, statutory charges and slippage, the effective ratio can be materially lower. Use the Brokerage Calculator before accepting a setup with a small gross edge.
Use RegalTicker Calculators as One Stop-Loss Workflow
The calculators are most useful when used together.
Step 1: Test Entry, Stop and Target
Use the Risk-Reward Calculator to enter:
- entry price;
- stop-loss price;
- target price;
- proposed quantity.
Review:
- risk per share;
- total potential loss;
- potential reward;
- reward-to-risk ratio;
- risk as a percentage of entry.
Test both the ideal stop price and a worse slippage scenario.
Step 2: Calculate Quantity
Use the formula in Position Sizing in Stock Market:
Quantity = Maximum acceptable rupee loss ÷ Risk per share
Do not select quantity first and then force the stop to fit the desired number of shares.
Step 3: Estimate Trading Costs
Use the Brokerage Calculator to estimate:
- brokerage;
- STT;
- exchange transaction charges;
- SEBI turnover fees;
- GST;
- stamp duty;
- applicable DP charges;
- estimated net result.
A stop-loss controls price risk, but trading costs still affect the final loss.
Step 4: Recalculate After Additional Purchases
If more shares are added, use the Stock Average Calculator to calculate the weighted average.
Then return to the Risk-Reward Calculator with:
- revised average entry;
- total quantity;
- current stop;
- current target.
This reveals the new total exposure.
Step 5: Measure the Realised Outcome
After exit, use the Stock Return Calculator to calculate the actual profit or loss and return.
Record:
- planned stop;
- actual execution price;
- planned loss;
- actual gross loss;
- charges;
- slippage;
- realised R-multiple;
- reason for any deviation.
Step 6: Use the Complete Tools Hub
The RegalTicker Investor Tools Hub brings together stock, portfolio, tax and corporate-action calculators.
For stop-loss planning, the preferred sequence is:
Risk-Reward Calculator → Position Size → Brokerage Calculator → Stock Average Calculator when needed → Stock Return Calculator after exit
The calculators support arithmetic. They do not determine whether a security should be bought or sold.
Common Stop-Loss Mistakes
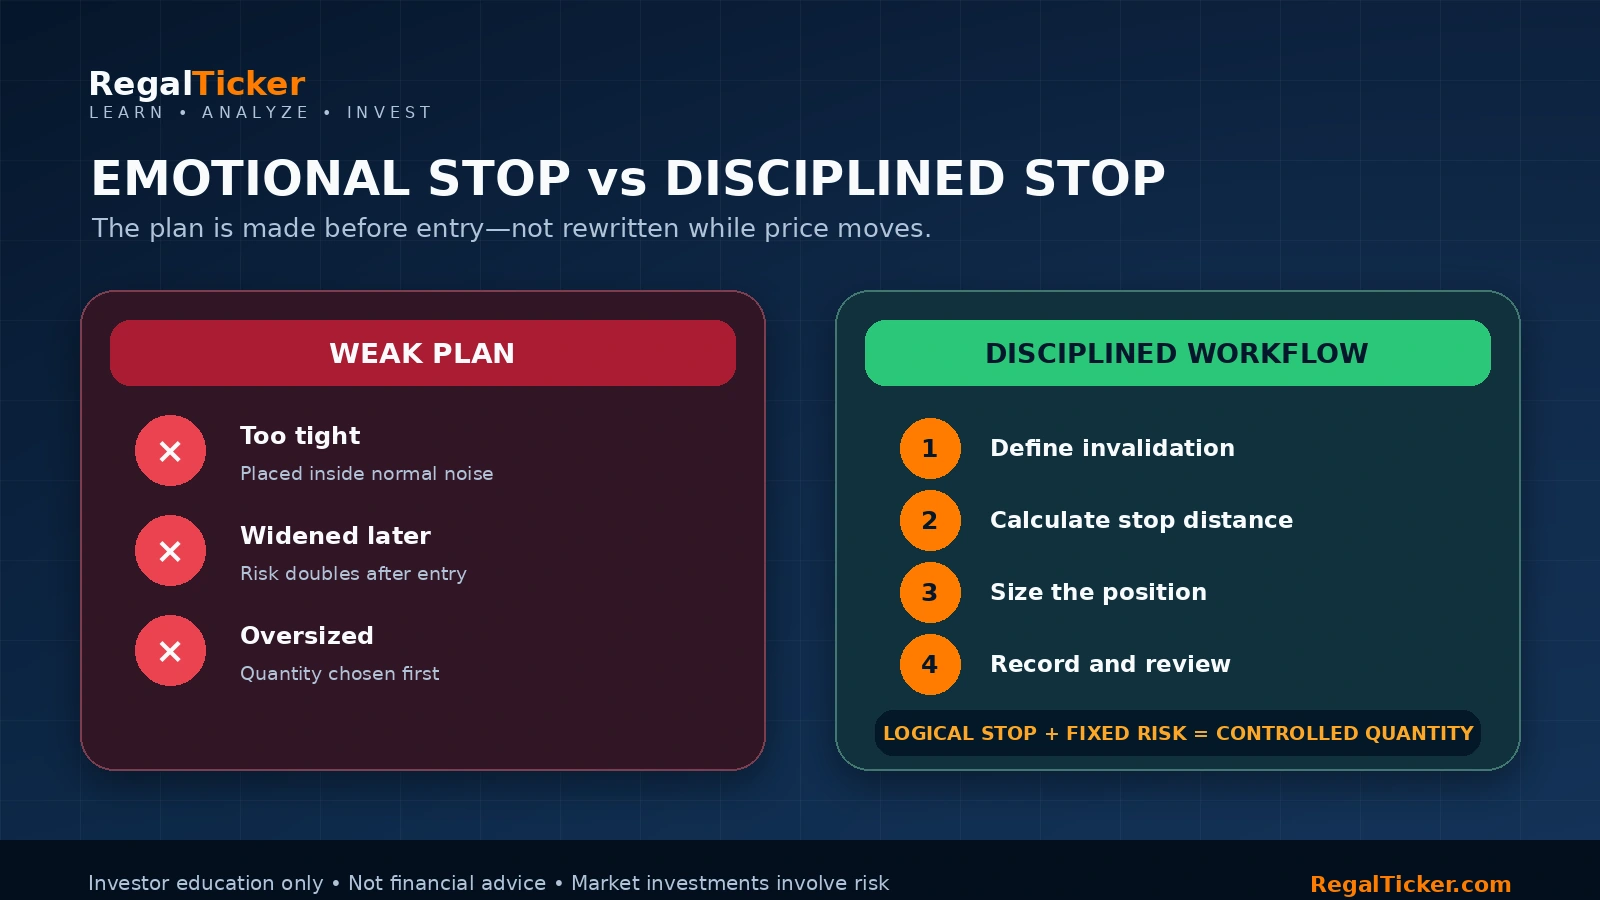
Placing the Stop at a Random Percentage
A fixed 2%, 5% or 10% stop may ignore volatility, support and timeframe.
Making the Stop Too Tight
A very tight stop can create a favourable-looking ratio but may be triggered by ordinary price movement.
Making the Stop Too Wide
A distant stop can hide an unclear thesis and create excessive capital risk unless quantity is reduced.
Moving the Stop Farther Away
Widening the stop after entry increases the loss allowed by the original plan.
Removing the Stop
Cancelling the stop because price is approaching it converts a controlled trade into an unplanned holding.
Choosing Quantity Before the Stop
Quantity should come after entry and invalidation are defined.
Ignoring Slippage and Gaps
Planned loss is not guaranteed maximum loss.
Using Stop-Limit Without Understanding Non-Execution
Price control can leave the position open during a rapid move.
Placing Stops at Obvious Exact Levels
Many traders may use the same round number or visible low. A stop should be based on a zone and invalidation logic.
Ignoring Liquidity
A large order in a thinly traded security may execute across multiple lower prices.
Using the Same Stop Method for Every Security
Different volatility, liquidity and timeframes require different treatment.
Moving the Stop Too Quickly to Break-Even
An early break-even stop can remove the position before the expected move develops.
Trailing the Stop Emotionally
A trailing rule should be defined in advance rather than adjusted continuously from fear.
Averaging Down Without Recalculating Risk
More quantity changes average price, total exposure and maximum loss.
Treating a Stop as a Substitute for Research
A stop can limit exposure but cannot create a sound thesis.
Stop-Loss Orders for Traders and Investors
Intraday Traders
Intraday traders often use:
- tighter stops;
- smaller holding periods;
- immediate monitoring;
- high sensitivity to brokerage and slippage;
- price-action or volatility-based invalidation.
Frequent trading means small costs can accumulate. The Brokerage Calculator should be part of the pre-trade process.
Swing Traders
Swing traders hold positions across sessions, so overnight gap risk is important.
Stops may be based on:
- daily support;
- swing lows;
- trend structure;
- volatility;
- major event dates.
Quantity may need to be smaller than an intraday position because the actual loss can exceed the planned stop after a gap.
Position Traders
Position traders may use wider stops based on weekly structure and lower quantity.
A wide stop is not automatically safer. It must still represent a defined thesis and acceptable total risk.
Long-Term Investors
A long-term investor may avoid tight mechanical stops because normal market volatility can be large over months or years.
Possible exit rules include:
- fundamental thesis failure;
- governance deterioration;
- rising debt beyond the original assumption;
- loss of competitive advantage;
- portfolio concentration;
- valuation becoming unsupported;
- better allocation opportunities;
- need for liquidity.
Long-term investing still requires risk limits, but the correct control may be position allocation, diversification and thesis review rather than a narrow daily price stop.
SEBI investor education emphasises investment goals, risk appetite, liquidity, diversification and regular review. A mechanical stop should not replace these broader decisions.
Leveraged and Derivative Positions
Leverage increases the impact of price movement. Options and futures can include margin calls, expiry, nonlinear payoffs and liquidity risk.
A simple equity stop-loss calculation may not capture the complete risk. Beginners should understand the product before trading leveraged instruments.
Pre-Trade Stop-Loss Checklist
Use this checklist before placing a stop:
- Is the setup or investment thesis written clearly?
- Is the entry based on analysis rather than urgency?
- Where does the idea become invalid?
- Is the stop beyond normal price noise?
- Is market structure or volatility supporting the stop?
- Is the security sufficiently liquid?
- Is there overnight or event risk?
- Is the selected order type understood?
- Could a stop-limit remain unfilled?
- Could a stop-market execute much worse?
- Has slippage been considered?
- Has the stop been entered into the Risk-Reward Calculator?
- Has quantity been calculated from maximum rupee risk?
- Has the Brokerage Calculator been used?
- Is the potential reward realistic?
- Does the setup still make sense after costs?
- Are several positions exposed to the same sector or market factor?
- Is the stop plan recorded before entry?
- Is there a rule for trailing or moving the stop?
- Will the actual execution and realised result be reviewed afterward?
Frequently Asked Questions
What is a stop-loss order in stock market trading?
It is an order that activates when price reaches a predefined trigger. It is used to exit when a planned loss limit or invalidation level is reached.
Does a stop-loss guarantee the exit price?
No. Gaps, slippage, low liquidity, circuit limits and fast movement can cause execution at a different price.
What is the difference between trigger price and limit price?
The trigger activates the order. In a stop-limit order, the limit sets the worst acceptable price. If the market moves beyond the limit, the order may remain unfilled.
What is better: stop-market or stop-limit?
Neither is universally better. Stop-market prioritises execution but can suffer slippage. Stop-limit provides price control but may not execute.
How do I calculate stop-loss percentage?
For a long trade:
(Entry price − Stop price) ÷ Entry price × 100
How do I calculate quantity from a stop-loss?
Maximum planned rupee loss ÷ Risk per share. Read the position sizing guide for examples.
Where should a stop-loss be placed?
It should normally be placed where the trade thesis becomes invalid, with enough room for ordinary volatility. There is no universal percentage.
Should I move a stop to break-even?
Only according to a defined rule. Moving it too early can cause normal price movement to exit a valid setup.
Can I move a stop farther away?
Doing so increases risk. It should not be done merely to avoid accepting a loss.
What is a trailing stop?
It is a stop that moves in the favourable direction as price advances under a defined rule, while not moving backward when price reverses.
Can a stop-loss be used for long-term investing?
Yes, but long-term investors may rely more on allocation limits, fundamental invalidation and portfolio review than tight price stops.
Why was my stop triggered but the order not executed?
A stop-limit order may activate without finding a buyer at the limit price or better. Market conditions, liquidity and price movement affect execution.
Can I calculate stop-loss risk online?
Use the RegalTicker Risk-Reward Calculator to enter entry, stop, target and quantity. It shows total potential risk and reward.
Should brokerage be included in the loss?
Yes. Use the Brokerage Calculator to estimate transaction costs separately.
What should I do after the trade closes?
Compare the planned stop with the actual execution, charges and realised R-multiple. Use the Stock Return Calculator for the final return.
Final Takeaway
A stop-loss order in stock market trading is a discipline tool, not a guarantee.
A complete stop-loss plan answers five questions:
- Why is the position being entered?
- Where is the thesis invalid?
- Which order type is appropriate?
- How much money can be lost?
- How many shares can be held without exceeding that limit?
The correct sequence is:
Analyse the setup → choose entry → define invalidation → calculate stop distance → size the position → test reward → estimate costs → place the correct order → review actual execution
Use the Risk-Reward Calculator to test the complete price plan, the position sizing guide to control quantity, and the Brokerage Calculator to estimate the net effect of charges.
A logical stop with disciplined position sizing can keep one failed idea from becoming a damaging portfolio loss. An arbitrary stop, oversized quantity or emotionally widened exit can do the opposite.
Continue Learning on RegalTicker
- Risk Management in Stock Market: A Beginner’s Guide
- Position Sizing in Stock Market: Formula, Methods and Examples
- Risk-Reward Ratio in Stock Market: Formula, Examples and Calculator
- Market Order vs Limit Order vs Stop-Loss Explained
- Support and Resistance in the Stock Market
- How to Read Candlestick Charts: A Beginner’s Guide
- Risk Management Learning Hub
- All RegalTicker Investor Tools
Official References
- NSE India — Trading System and Stop-Loss Order Conditions
- NSE Circular — Validation for Stop-Loss Limit Order Entry
- SEBI Investor — Key Risks in Investing
- SEBI Investor — How to Manage Investment Risks
- SEBI Investor — Factors to Consider Before Investing
- SEBI Investor — Securities Market Do’s and Don’ts
Educational disclaimer: This article is for investor education and general information only. It is not financial advice, personalised investment advice, a research recommendation, a solicitation or a guarantee of returns. Stop-loss orders may execute at prices different from their triggers, and actual losses can exceed planned amounts. Product features, order availability, exchange validations, costs, tax rules and regulations can change. Verify current information through official exchange, broker and regulatory sources, conduct independent research and consult an appropriately qualified professional where necessary.