
A Chart Should Produce a Testable Plan, Not a Prediction
How to analyse a stock technically is not a question of finding the perfect indicator. It is a process of turning observable price, volume and market behaviour into a structured assessment. A useful analysis begins with trustworthy data and a chosen timeframe, then maps trend and levels, evaluates participation, defines confirmation and records where the idea would be wrong. Only then does it measure risk.
Beginners often reverse that order. They open a chart, add indicators and look for a green signal. If the chart disagrees, they change the timeframe or settings until it supports their opinion. This turns a decision tool into confirmation bias.
This capstone guide joins the previous nine Technical Analysis lessons into a repeatable process. It includes a hypothetical worked example, a completed worksheet and a contrasting case where the correct outcome is no action. It is for education and process building, not a recommendation to buy or sell a security.
⚡ Quick answer
To analyse a stock technically, first verify the security, historical-price adjustments and volume data. Define the intended horizon and the timeframe that owns the setup. Check the broad market and sector, classify the stock’s trend, and mark meaningful support, resistance and the next obstacle. Name one observable setup; compare volume with a relevant baseline and use indicators only to answer specific questions. Write a confirmation rule and a structural invalidation level before considering an entry. Finally, calculate risk per share, account for execution costs and judge whether there is adequate room to the next obstacle. If evidence, liquidity or risk is inadequate, record no action rather than forcing a conclusion.
Key takeaways
Check the correct security, corporate actions and chart-adjustment convention before drawing levels.
Pick the decision horizon first; weekly, daily and intraday charts answer different questions.
Identify price structure and support/resistance before adding indicators.
Market-relative performance versus an index is not the RSI oscillator.
Volume shows participation but does not guarantee continuation.
RSI, MACD and moving averages are correlated transformations of price, not separate votes.
Mark the setup and confirmation rule before price reaches the level.
Define structural invalidation before calculating quantity or looking for a target.
Measure the next real obstacle, spread, liquidity, costs and gap risk.
Save an observation and a hypothesis separately so later outcomes cannot rewrite the original reasoning.
A completed analysis may reasonably conclude wait, reassess, or no action.
What a Complete Technical Analysis Process Can and Cannot Do
Technical analysis describes observable market behaviour. Price records where transactions occurred. Candlesticks condense open, high, low and close; volume shows traded quantity. Trends, levels, patterns and indicators help organise those observations.
It cannot establish business quality, management integrity or intrinsic value from a chart alone. SEBI Investor’s comparison of technical and fundamental analysis distinguishes chart behaviour from the financial health, business model and economic factors studied through fundamental analysis.
Technical Analysis Is an Evidence Framework
A pattern, crossover or breakout cannot guarantee the next move. New disclosures, market reversals, spread changes, ordinary volatility and gaps can invalidate an apparently strong setup. A consistent method helps you explain why an idea existed at a given time and what would disprove it; it does not create certainty.
Analysis and Execution Are Different Decisions
A stock can have a constructive chart while the available market price offers too little room to the next obstacle, or an invalidation level too far away for the intended loss limit. The analytical conclusion can be valid even when no position is appropriate.
Investor note
A Good Chart Does Not Override Business Research
A chart helps organise price behaviour. For company accounts, business quality, debt, cash flow and valuation, use How to Analyse a Company Fundamentally. Different methods answer different questions; neither guarantees a return.
Know the Difference Between an Observation and a Conclusion
| What you can observe | Interpretation to test—not assume |
|---|---|
| A daily higher high follows a higher low | The daily uptrend may remain intact |
| Price closes above a pre-marked resistance zone | The market may be accepting prices outside the range |
| Volume is 1.6 times a recent 20-day baseline | Participation increased; continuation is not assured |
| RSI falls from 74 to 58 during consolidation | Momentum cooled; this does not establish a reversal |
| A gap increases the reference price from ₹514 to ₹525 | The same chart thesis now has different entry economics |
How to Analyse a Stock Technically: The 10-Step Workflow
The steps below move from data and context to a testable setup and then to risk. Chart-data verification is a preflight check; the ten analytical steps remain unchanged.
| Step | Question | Written output |
|---|---|---|
| 1. Horizon | How long is the idea intended to last? | Context, working and optional monitoring timeframes |
| 2. Market context | What are the index, sector, liquidity and known events doing? | Supportive, mixed or conflicting context |
| 3. Trend | Is the stock rising, falling, ranging or transitioning? | Objective swing-structure description |
| 4. Levels | Where are the key zones and next obstacle? | Support, resistance, obstacle and failure zones |
| 5. Setup | Which single price behaviour is being tested? | Observable, falsifiable hypothesis |
| 6. Volume | Is participation different from a relevant baseline? | Volume and tradability assessment |
| 7. Indicators | Which tool adds a distinct question? | Momentum context and contradictions |
| 8. Confirmation | What exact price event is required? | Predefined trigger on the setup timeframe |
| 9. Invalidation | What price behaviour makes the idea wrong? | Structural failure condition |
| 10. Risk | Is the loss and room to the obstacle acceptable? | Risk-per-share, costs and action-or-skip conclusion |
Highlight
Write the Thesis Before the Outcome
For example: “The daily trend is upward but price is consolidating below resistance. I will regard it as a continuation candidate only if a daily candle closes beyond the full zone; a return through my predefined failure level would invalidate the immediate idea.” This is testable. “The stock looks strong” is not.
Prepare the Chart and Its Market Context
The first two steps are not glamorous. They prevent analysis of the wrong symbol, misleading price history or an inappropriate timeframe.
Preflight: Verify the Security, Data and Corporate Actions
Check the symbol and security series, date range, adjusted-versus-unadjusted price convention, currency, trading volume units and any known splits, bonus issues, rights events or suspensions. If comparing two providers, confirm they use comparable adjustment settings and sessions.
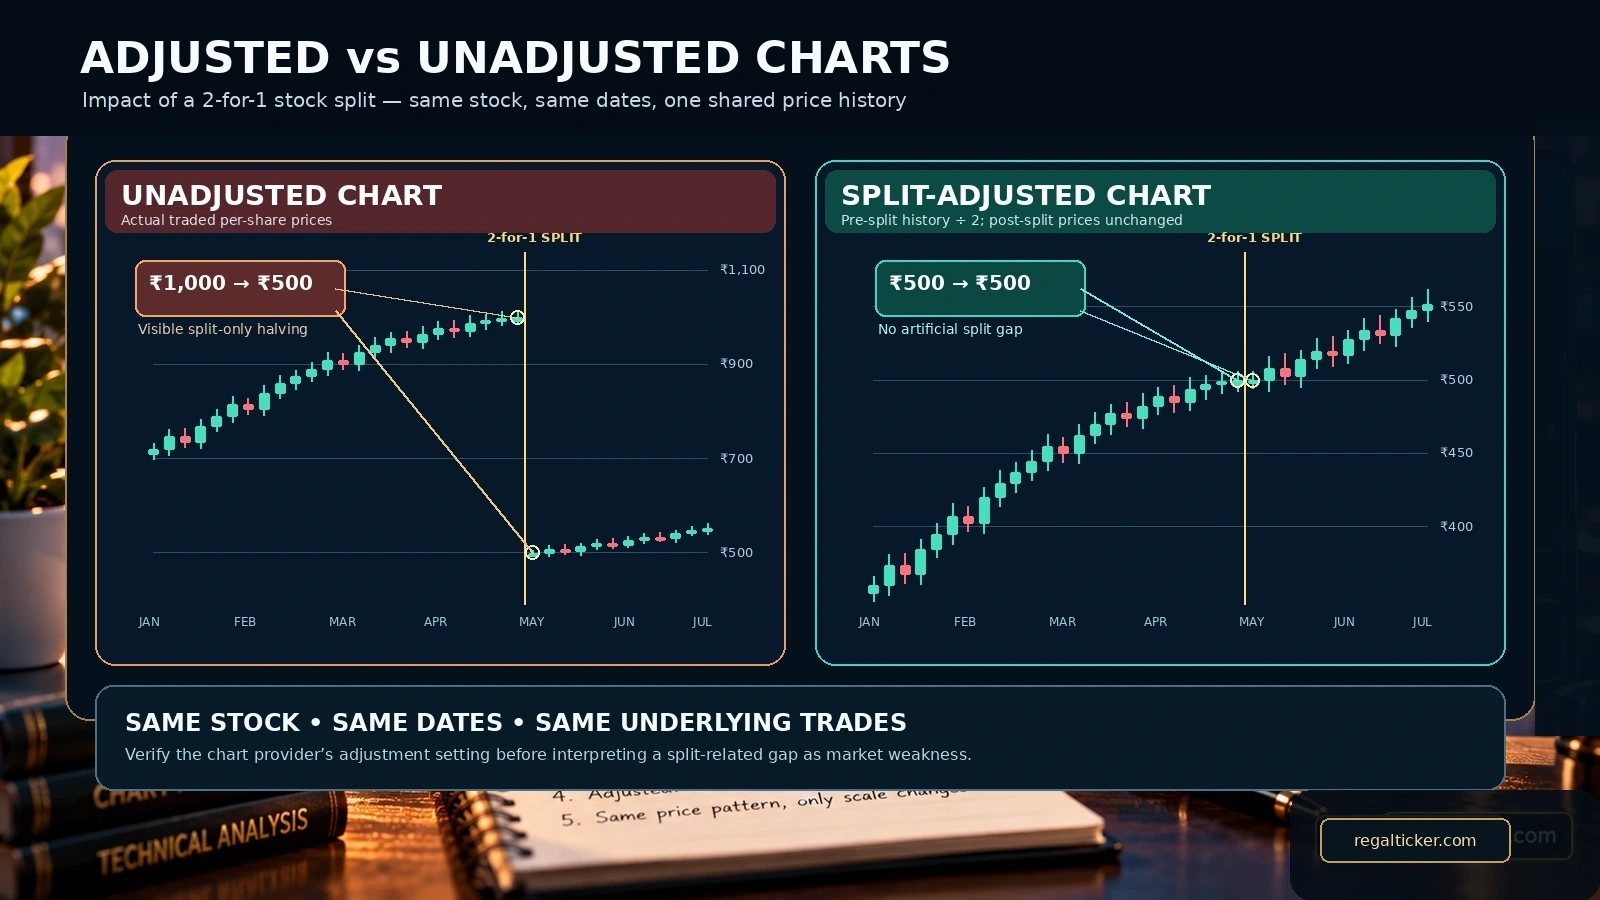
Consider a hypothetical 2-for-1 split: 100 shares priced at ₹1,000 before the split become 200 shares at a theoretical ₹500 reference, ignoring market movement. An unadjusted chart may show a sharp step from around ₹1,000 to around ₹500. That discontinuity is not automatically a 50% economic loss or technical breakdown. A split-adjusted historical series may restate earlier prices for comparison, but its precise convention depends on the provider.
NSE itself distinguishes adjusted 52-week high/low data from actual unadjusted prices in its market reports. A separate NSE equity chart note says that chart’s historical prices are not adjusted for corporate actions. Verify the specific data field and page, rather than assuming one universal NSE convention. For split mechanics, see Bonus Shares vs Stock Split.
Caution
An Apparent Price Gap May Be a Data Event
Check the company or exchange announcement and the chart’s adjustment method before calling a split-related price change a crash, breakout, stop-out or volatility event. Do not mix adjusted past prices with an unadjusted current reference in the same calculation.
Step 1: Define the Holding Period and Primary Timeframe
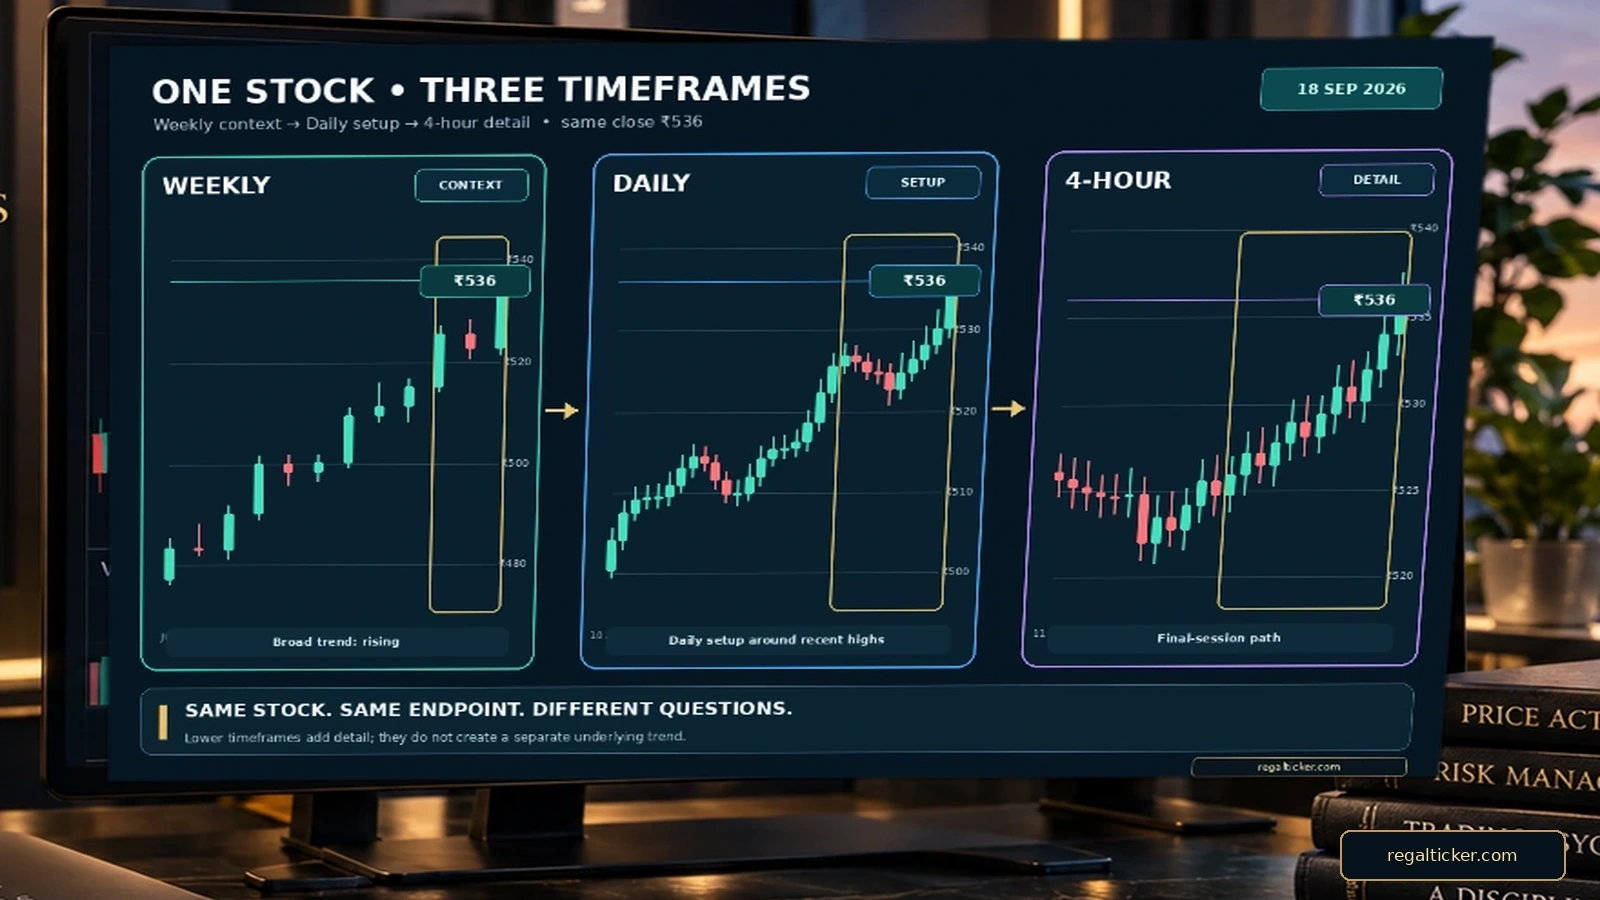
Choose the intended horizon before studying the pattern. The weekly chart can show an uptrend while a four-hour chart shows a pullback; both may be true.
| Intended analysis | Context chart | Setup-owning chart | Optional monitoring chart |
|---|---|---|---|
| Multi-week position | Weekly | Daily | Four-hour or daily close |
| Several-day swing | Daily | Daily or four-hour | One-hour or four-hour |
| Intraday idea | Daily or one-hour | Fifteen-minute | Five-minute |
⭐ Pro tip
One Idea, One Primary Clock
Record “weekly context / daily setup / four-hour monitoring” before the first signal. If the idea changes, write a new thesis rather than moving between charts solely to defend the original one.
Step 2: Check the Index, Sector, Liquidity and Event Context
Compare the stock’s trend with a suitable broad benchmark and its relevant sector or industry. Check market breadth and upcoming company disclosures when they materially affect the horizon. A stock can rise while its sector rises faster: that is underperformance relative to the sector, even if the stock’s own breakout holds.
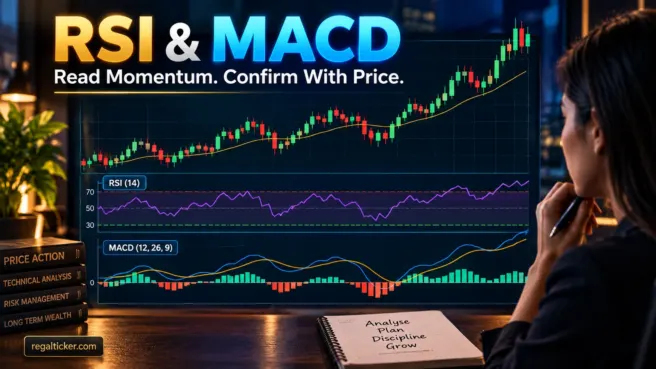
This comparative relative strength is not RSI. The RSI and MACD lesson explains RSI as a bounded momentum oscillator derived from the stock’s own price changes.
Liquidity matters independently. A clean chart in a thinly traded security can hide wide bid–ask spreads, isolated prints and slippage. Note relevant results dates and corporate actions; a chart pattern does not cancel event or gap risk.
Map Trend, Levels and the Actual Setup
Steps 3–5 define the price map. Ask first what price has actually done, not what an indicator predicts it might do.
Step 3: Classify the Trend From Market Structure
An uptrend typically contains higher highs and higher lows; a downtrend, lower highs and lower lows; a range oscillates between zones; a transition disrupts the previous swing sequence without necessarily establishing a new trend. Read the detailed Trend Analysis guide.
Record the primary structure and current swing separately: “Weekly structure remains upward; daily price is consolidating beneath resistance.” Do not force a directional label onto a sideways market.
Step 4: Mark Support, Resistance and the Next Obstacle
Use visible swing reactions to draw zones, not exact paise-level predictions. Start with the nearest meaningful support, the setup boundary, invalidation and the first realistic obstacle beyond confirmation. Remove weak, unrelated lines that do not affect the decision.
A daily breakout can be valid yet face weekly resistance almost immediately. That obstacle must be marked before creating a target. The dedicated Support and Resistance lesson explains level selection and role reversal.
Step 5: Name One Observable Setup
Examples include a range breakout, support retest, trend pullback, continuation pattern, reversal structure or failed break. Call a developing rectangle a potential breakout until its chosen boundary is crossed under your predefined rule. Read Chart Patterns for pattern mechanics.
| Observation | Hypothesis to verify |
|---|---|
| Price formed a 15-session range below ₹510–₹512 | A continuation breakout could develop |
| The previous weekly trend rose | Broader structure supports but does not prove continuation |
| A candle wicks to ₹514 but closes at ₹509 | The required daily close has not happened |
| Price closes above ₹512 with additional volume | Confirmation evidence improves; a later reversal remains possible |
❌ Myth
A chart pattern becomes valid as soon as it looks familiar.
✅ Fact
The pattern remains a hypothesis until its specific boundary and confirmation conditions are observed. Even a confirmed break can later fail.
Confirm Participation and Momentum
Steps 6–7 add context without letting supporting tools replace the actual price setup.
Step 6: Evaluate Volume and Tradability
Compare traded quantity with recent bars on the same timeframe—often a relevant 10–20 bar baseline—and with earlier attempts at the level. Rising price with increased volume can show broader participation; declining volume during a pullback can indicate less activity. High volume with a long rejection wick can reflect strong opposition rather than clean acceptance.
A low-volume break is not automatically false; its participation evidence is weaker, so subsequent price acceptance matters more. Check spread and liquidity alongside volume. The Trading Volume lesson covers these distinctions.
Step 7: Use Moving Averages, RSI and MACD Selectively
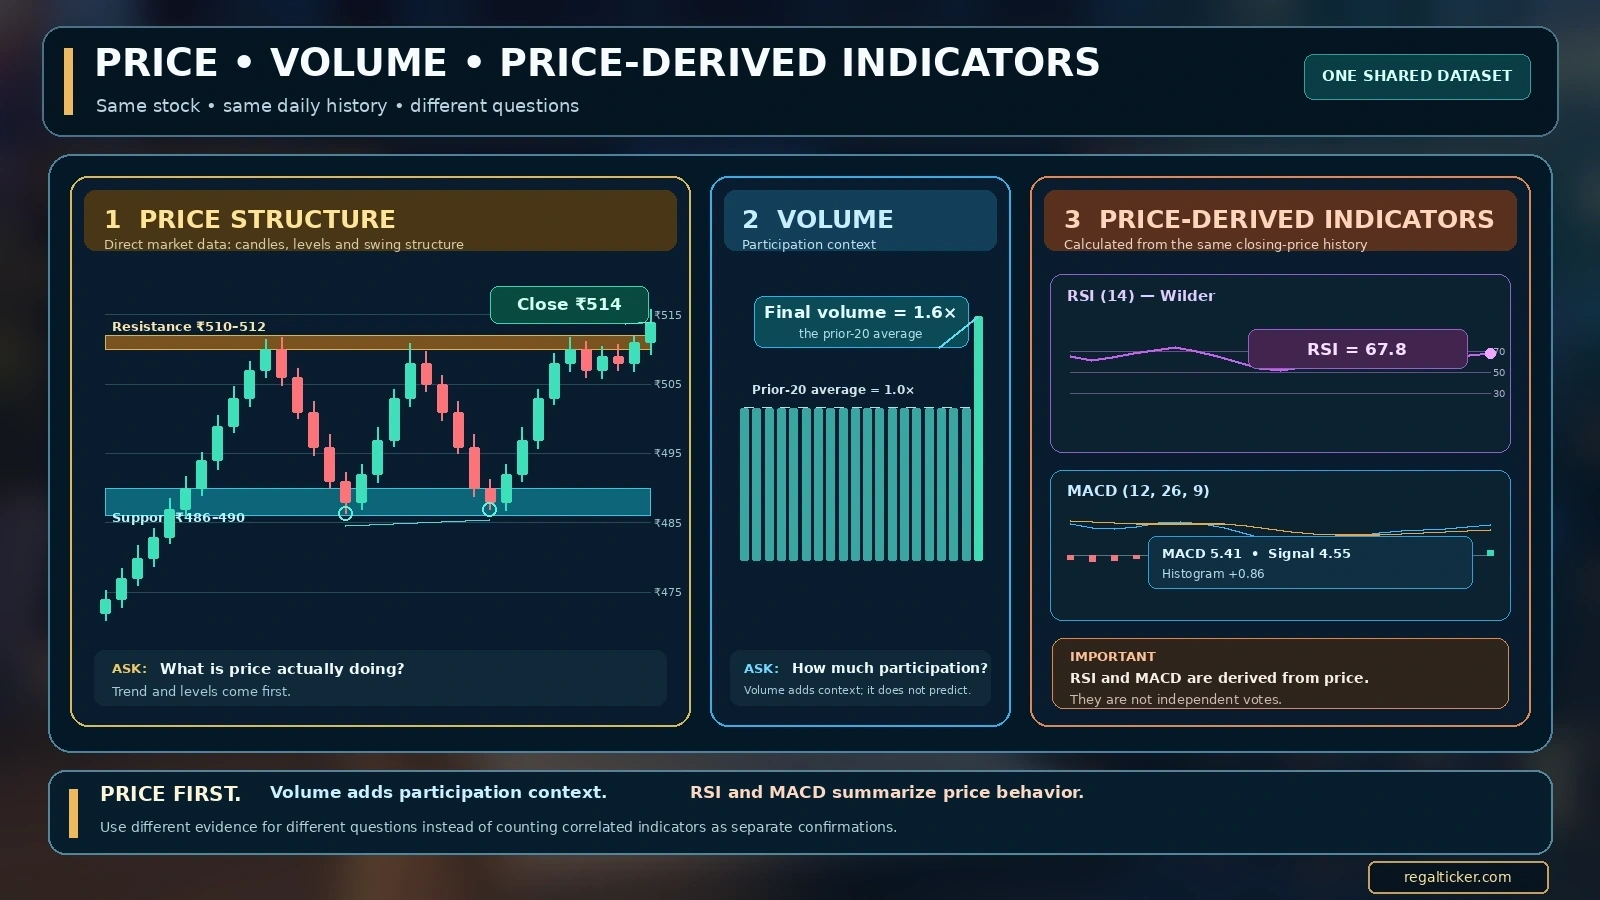
| Evidence source | Question it answers | What it does not prove |
|---|---|---|
| Price structure | Is the market rising, falling, ranging or changing? | That a pattern must continue |
| Volume | Did participation expand or contract? | Whether buyers will prevail next |
| Moving average | What does smoothed past price suggest about direction? | A crossover is a guaranteed entry |
| RSI | How do recent gains compare with recent losses? | That an overbought reading means sell |
| MACD | How are two price averages and their difference changing? | That a crossover predicts the next move |
| Benchmark comparison | Is the stock outperforming its index/sector? | That relative leadership will persist |
Investor note
Price First; Indicators Answer Smaller Questions
If price closes beneath well-defined support while RSI is 28, “oversold” does not make support magically hold. RSI can remain low during a downtrend. See Moving Averages and RSI and MACD for their limitations.
Define Confirmation, Trigger and Invalidation
Steps 8–9 turn the hypothesis into observable conditions. Write both before evaluating the breakout candle.
Step 8: Define Exactly What Confirms the Setup
A close above the full resistance zone is different from a wick beyond it. A follow-through candle may provide additional acceptance; a retest can clarify whether the old level holds, but a retest is not mandatory. Close-based and retest-based approaches trade earlier response for more evidence, and neither removes uncertainty. The Breakout and Breakdown lesson explains the difference between an unconfirmed attempt, false breakout and broader failed breakout.
Before the session, write: “A daily close above ₹512 qualifies as the price condition; an intraday high alone does not.” Then record the actual close without redrawing the rule to fit it.
Step 9: Define Invalidation Before Entry
Invalidation is the observable price behaviour that proves the specific idea wrong. Examples include a close back through the range boundary, failure below a valid retest low or loss of the last higher low on the setup timeframe. An arbitrary stop chosen solely to fit a convenient position size may not align with chart structure.
A setup can remain intact while the offered price becomes unattractive. Conversely, a trade can later recover after its original thesis was invalidated. Judge the plan by its rules and information available at the time, not the hindsight outcome.
Risk
Price Risk and Execution Risk Are Different
A logical invalidation does not guarantee an order will execute at that exact price. Gaps, liquidity, spread, partial fills and slippage can create a larger realised loss than the planned chart distance.
Measure Risk Before Considering Execution
Step 10 is the gatekeeper. Price structure may support an idea even when the available risk or room to the next obstacle does not.
Step 10: Calculate Risk per Share and Quantity
For a hypothetical long setup:
🧮 Simple calculation
A Structural Risk Example
Reference price: ₹512. Structural invalidation: ₹500. Risk per share: ₹512 − ₹500 = ₹12. If the illustrative maximum planned position loss is ₹1,200, theoretical quantity before costs is ₹1,200 ÷ ₹12 = 100 shares. The quantity is not a recommendation; actual losses can differ through execution, fees and gaps.
Compare the First Real Obstacle With the Risk
Suppose the next observable resistance is ₹524. The gross room from ₹512 is ₹12 per share, equal to the ₹12 planned risk: 1:1 gross reward-to-risk before costs. A chart target invented beyond the real obstacle cannot fix poor available economics.
Use the calculator
Check Risk and Reward Arithmetic
Use the Risk-Reward Calculator to compare your own entry, structural invalidation and next realistic obstacle. The tool evaluates the arithmetic; it does not validate the setup or predict an outcome.
Know When No Action Is the Right Conclusion
Skip or reassess when the chart data are inconsistent, the level is arbitrary, liquidity is inadequate, a key event creates unbounded gap uncertainty, confirmation is absent, invalidation cannot be defended or the available price leaves too little room to the next obstacle.
If the reference price changes materially, re-run the entire risk calculation. Do not reuse an old ratio merely because the pattern still looks attractive. This principle becomes concrete in the contrasting no-action example below.
Worked Example: From Blank Chart to Written Plan
Consider Meridian Components, a completely hypothetical liquid share. Prices and indicators in this illustration are constructed for education, not live market data or a recommendation.
The Original Ten-Step Meridian Analysis
| Step | Pre-recorded observation or rule |
|---|---|
| 1. Horizon | Several days to a few weeks: weekly context, daily setup, optional four-hour monitoring |
| 2. Context | Broad index and sector trend upward; sector approaches prior resistance; spreads are relatively narrow; check the next results date |
| 3. Trend | Weekly higher highs and higher lows; daily uptrend followed by 15 sessions of consolidation |
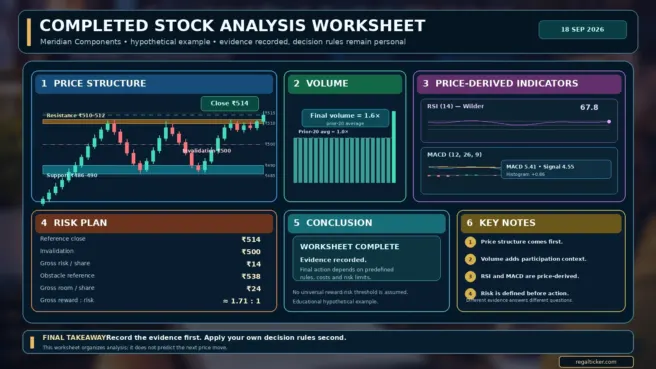
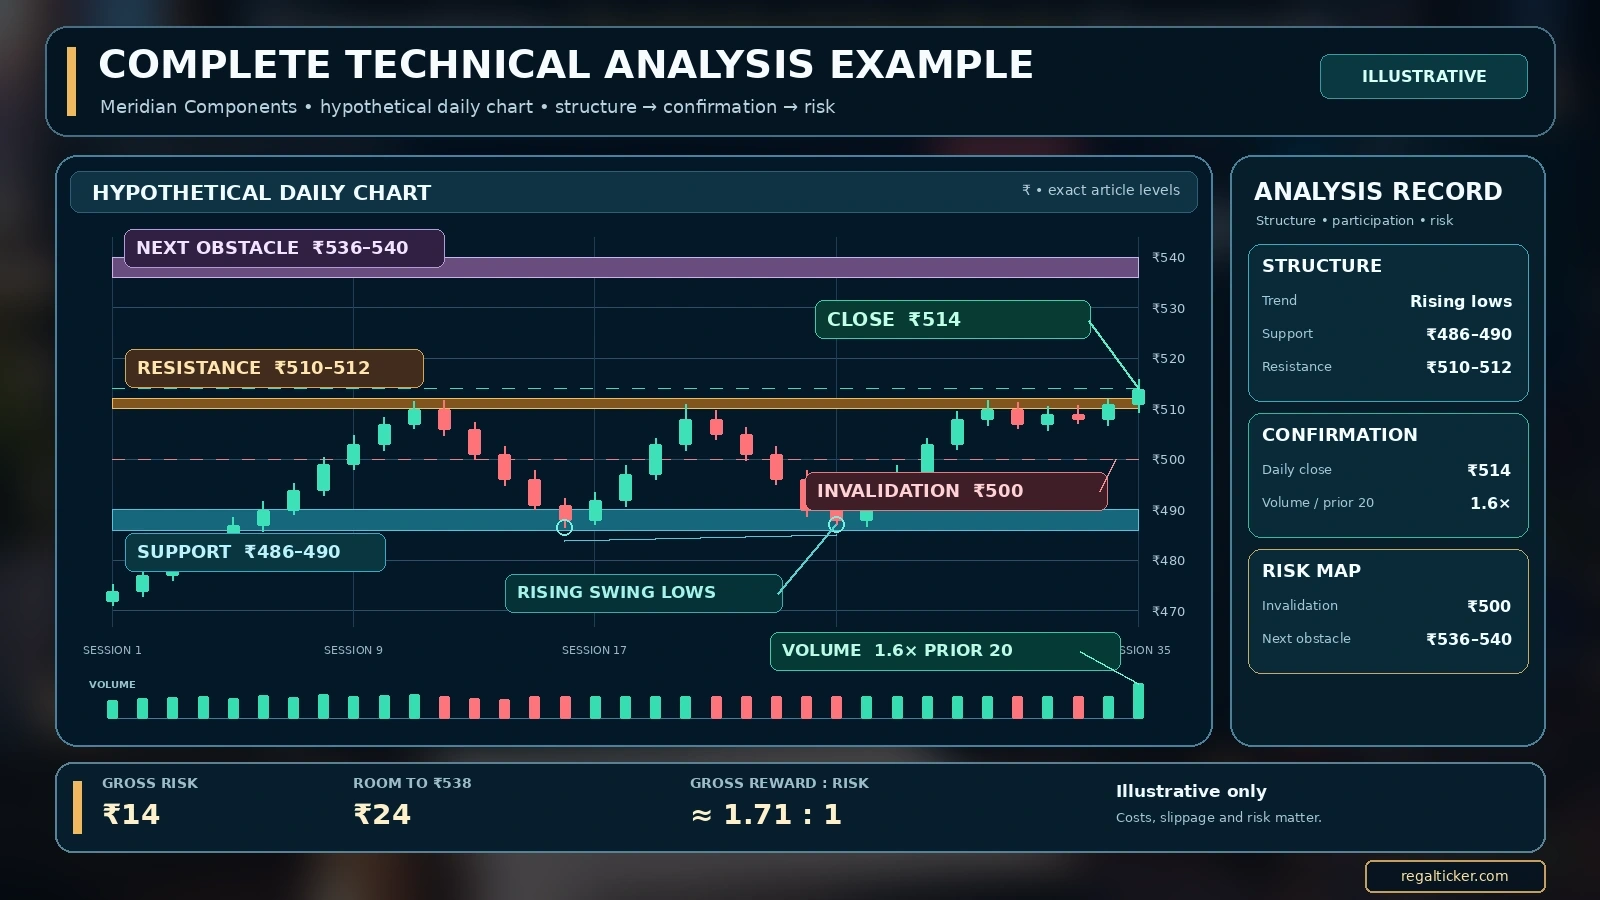
| 4. Levels | Daily support ₹486–₹490; resistance ₹510–₹512; illustrated swing lows around ₹486–₹487; weekly obstacle ₹536–₹540 |
| 5. Setup | Potential continuation breakout from a rectangle; not confirmed just because the shape exists |
| 6. Volume | The latest resistance attempt shows 1.6× the recent 20-day average; participation supports but does not guarantee the move |
| 7. Indicators | RSI 67.8; MACD 5.41 above its 4.55 signal with a +0.86 histogram; all are derived from the same closing-price history and are not independent votes |
| 8. Confirmation | Daily close above the entire ₹510–₹512 zone; a wick to ₹514 with a ₹509 close does not qualify |
| 9. Invalidation | Immediate breakout idea invalid below ₹500 if structurally justified; below ₹486 would more fully invalidate the wider range thesis |
| 10. Risk | Hypothetical reference ₹514; invalidation ₹500; obstacle reference ₹538; assess costs and allowable loss |
Complete the Meridian Risk Calculation
🧮 Simple calculation
Original Reference — Illustrative, Not a Signal
Reference entry after the predefined close: ₹514. Invalidation: ₹500. Gross risk per share: ₹14. First weekly obstacle reference: ₹538 within the ₹536–₹540 zone. Gross room: ₹538 − ₹514 = ₹24. Gross reward-to-risk: ₹24 ÷ ₹14 ≈ 1.71:1, before costs, slippage or any probability estimate.
A potential ratio is not a forecast or expected return. If the next obstacle is nearer than ₹538, or spread and execution are unfavourable, the practical assessment changes.
Contrasting Case: Strong Chart, Inadequate Available Price
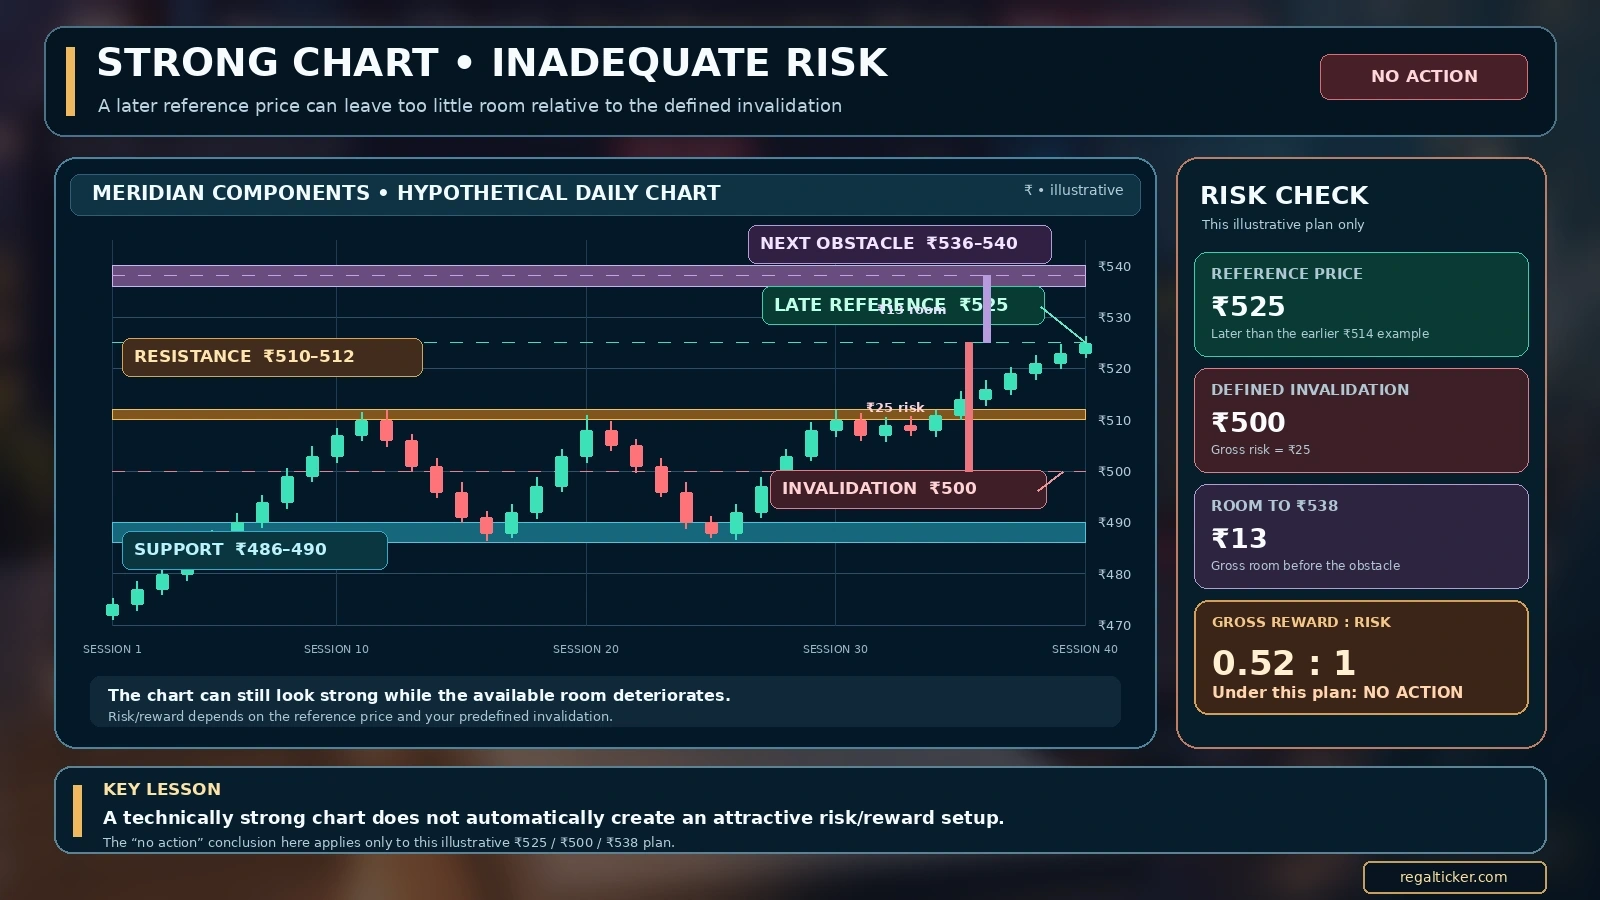
Now assume the same hypothetical stock gaps and the available reference rises to ₹525 before any position is considered. Keep the previously justified ₹500 invalidation and ₹538 obstacle reference; do not move either merely to make the ratio look better.
💡 Real example
When the Chart Still Looks Constructive but the Plan Fails
At ₹525, structural risk is ₹25 per share. Gross room to ₹538 is ₹13 per share. Gross reward-to-risk is ₹13 ÷ ₹25 = 0.52:1 before costs. The original ₹514 example had around 1.71:1. The price structure may still be constructive, but this particular available reference does not meet a hypothetical plan that requires greater room relative to risk. The documented conclusion is no action at ₹525 under that plan, not “change the stop” or “invent a target.”
Caution
“No Action” Is a Full Research Result
This is not proof that price will fall after ₹525. It means the setup’s available price and risk fail the specified plan. Price may rise anyway; the quality of the decision must be reviewed against information available at the time.
A Completed One-Page Analysis Worksheet
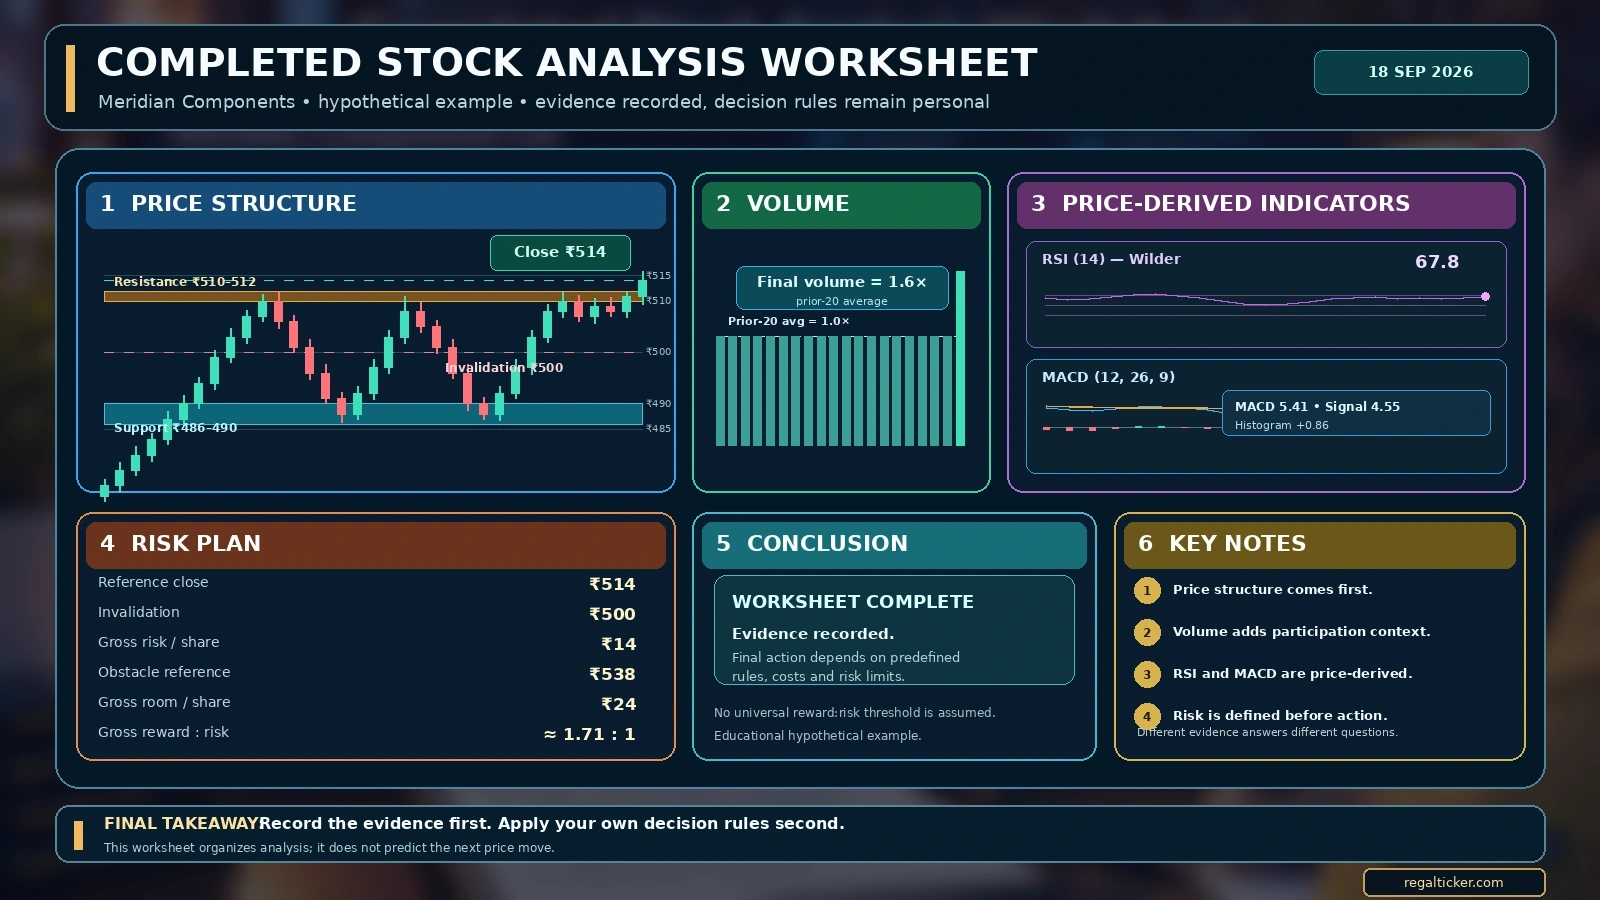
Use the same fields for every stock, including rejected setups. The completed Meridian record below is illustrative and assumes the relevant chart data convention was checked.
| Worksheet field | Meridian Components — hypothetical recorded value |
|---|---|
| Security/data | Hypothetical; symbol and price-adjustment convention verified in a real application |
| Date/time of snapshot | Record actual timestamp before confirmation; do not backfill from hindsight |
| Context / setup / monitoring | Weekly / daily / optional four-hour |
| Market and sector | Generally supportive; sector nearing resistance |
| Price structure | Weekly and daily uptrend; 15-session daily rectangle |
| Key levels | Support ₹486–₹490; resistance ₹510–₹512; obstacle ₹536–₹540 |
| Setup | Possible continuation breakout; hypothesis only |
| Volume | Latest attempt 1.6× 20-day baseline |
| Indicator context | RSI 67.8; MACD 5.41; signal 4.55; histogram +0.86; correlated price-derived evidence |
| Confirmation | Daily close above ₹512; wick-only move does not qualify |
| Reference / invalidation | ₹514 reference; ₹500 structural invalidation |
| Gross risk / obstacle room | ₹14 per share risk; ₹24 room to ₹538; ≈1.71:1 before costs |
| Conflict and costs | Sector obstacle, spread, slippage, gap and result-event checks |
| Decision at ₹514 reference | Conditional review only if the written plan and actual execution assumptions are met |
| Decision if price gaps to ₹525 | Recompute: ₹25 risk; ₹13 room; 0.52:1; no action under the example plan |
| Saved evidence | Pre-event chart, working-timeframe close, volume baseline, notes and later review |
Checklist before you act
- Confirm the data source, security and corporate-action adjustment convention.
- Save an untouched screenshot and timestamp before the trigger.
- Mark the level, next obstacle and invalidation without looking ahead.
- Record independent observations separately from interpretations.
- Recalculate from the actual available price, not an idealised old entry.
- Include liquidity, spread, costs and possible gaps.
- Record “no action” when conditions are not met.
- Review adherence to the plan later, not merely whether price subsequently rose or fell.
Write a Falsifiable Final Thesis
“Meridian Components is in a weekly and daily uptrend and has formed a 15-session range beneath ₹510–₹512 resistance. I will recognise the price condition only after a daily close above the complete zone, comparing activity with its 20-day volume baseline. A return below ₹500 invalidates the immediate breakout plan if that boundary is structurally defensible. The next weekly obstacle is ₹536–₹540. I will re-evaluate risk if the available price moves materially away from ₹514, and I will not act when the setup, liquidity or allowable risk is inadequate.”
Final Technical Analysis Checklist, Mistakes and FAQs
The Ten-Step Review Checklist
- Horizon: Define what the analysis is for, and fix the primary timeframe.
- Context: Review benchmark, sector, liquidity and event calendar.
- Trend: Describe actual swing structure, including uncertainty.
- Levels: Pre-mark the setup zone, invalidation and next obstacle.
- Setup: Name one observable pattern or price behaviour.
- Volume: Compare with an appropriate baseline and inspect the candle outcome.
- Indicators: Select a tool for a specific question; identify correlated evidence.
- Confirmation: Write the exact close or structure condition in advance.
- Invalidation: Define the price behaviour that makes the thesis wrong.
- Risk: Recompute quantity, costs and obstacle room from the available price; skip when inadequate.
Mistakes That Make Analysis Unreviewable
| Mistake | Better practice |
|---|---|
| Using an unverified, unadjusted split chart to infer a collapse | Check event records and provider-specific price adjustments |
| Changing the timeframe after price moves against the idea | Keep the predeclared setup-owning timeframe |
| Redrawing levels after seeing the outcome | Save and timestamp a pre-event screenshot |
| Calling every volume spike bullish | Read participation alongside candle close and price location |
| Counting MA, RSI and MACD as three independent confirmations | Separate price structure, volume, benchmark context and one momentum view |
| Choosing a stop solely from a desired quantity | Locate structural invalidation first; size afterward |
| Ignoring spread and slippage | Include realistic transaction assumptions |
| Reusing an old target and risk ratio after a price gap | Recalculate from the actual available price |
| Recording only winners | Journal rejected and failed setups as well |
| Treating a later rise as proof that a rejected plan was wrong | Judge the decision against the rules and information available then |
Maintain a Prospective Chart Journal
Save snapshots before confirmation, at the actual decision point, after the invalidation or exit event, and during a later review. Record date, timeframe, relevant evidence, competing interpretations, trigger, structural failure condition, costs, planned risk, what actually happened and any change to the rules. A single profitable outcome does not validate a weak method; a rule-following loss does not automatically invalidate a defensible process.
Risk
Educational Analysis Is Not a Personal Trading Recommendation
Market participation can result in loss. SEBI’s July 2024 intraday-trading study examines outcomes for individual intraday traders in the Indian equity cash segment; its findings should not be treated as probabilities for this hypothetical setup or for every investor. No chart method removes execution, liquidity or market risk.
Final takeaway
What to remember
Technical stock analysis is a sequence, not a collection of bullish labels. Verify the data, choose the correct timeframe, describe price structure, name a testable setup, assess participation, require an observable confirmation and define failure before calculating risk. Preserve the original written record so the outcome cannot rewrite the evidence. A complete worksheet may end with a conditional assessment, a watchlist note or no action. That is a strength of a disciplined process, not a failure to predict.
Frequently asked questions
What is the first step in technical analysis of a stock?
Confirm the correct security and trustworthy historical data, then define the holding horizon and setup-owning timeframe. Price structure becomes meaningful only with those foundations.
Can a stock split look like a crash on a chart?
Yes. Raw pre-split and post-split prices may show a discontinuity. Verify the declared corporate action and the chart provider’s adjustment convention before interpreting that step as a market move.
How many timeframes should I analyse?
Use only what the decision requires. A higher chart for context, a working chart for the setup and an optional lower chart for monitoring is a practical framework, not a universal rule.
Is a 50-period moving average the same on daily and weekly charts?
No. A 50-period average on a daily chart summarises 50 daily bars, while the weekly version summarises 50 weekly bars. They are different lookbacks.
What is the difference between market relative strength and RSI?
Market-relative performance compares a stock with a benchmark or sector. RSI is a 0–100 oscillator based on recent gains and losses within that stock. The similar names describe different calculations.
Should I use RSI and MACD together?
They can both provide context, but both are derived from past price and should not be counted automatically as independent confirmations. Explain the distinct question each tool answers.
Does higher volume confirm that a breakout will succeed?
No. Higher volume indicates more participation relative to the chosen baseline. Price may still reject the level or later reverse.
Is an intraday wick beyond resistance a confirmed daily breakout?
Not under a rule requiring a daily close beyond the resistance zone. Define the intended confirmation timeframe before the event.
How should I choose invalidation?
Identify the price behaviour that would make the specific setup wrong, using the setup timeframe and meaningful structure. Then measure the distance from the available reference price.
Is a high reward-to-risk ratio a probability of success?
No. It compares gross potential movement with planned risk. It does not estimate the likelihood of reaching the target or guarantee stop execution.
What if the stock gaps far above the original planned entry?
Recalculate from the new available price. The chart thesis can remain constructive while the new risk-to-obstacle relationship becomes inadequate, producing a no-action conclusion.
Can technical analysis establish a company’s long-term business value?
No. Charts organise price and volume behaviour. Assessing financial statements, governance, business durability and valuation requires fundamental research.
Investor note
Related tool: demerger cost records
For a shareholding affected by a demerger, use the Demerger Cost Basis Calculator with the company’s official allocation figures. Keep that working with the original acquisition records.
Verify through official sources
Official references
- SEBI Investor — Technical Analysis vs Fundamental Analysis
- NSE — All Reports: Adjusted 52-Week High and Low Versus Unadjusted Bhavcopy Prices
- NSE — Equity Quote Page With Historical Chart Adjustment Note
- NSE — Corporate Action Reports and Security Data
- SEBI — July 2024 Study of Individual Intraday Trading in the Equity Cash Segment