

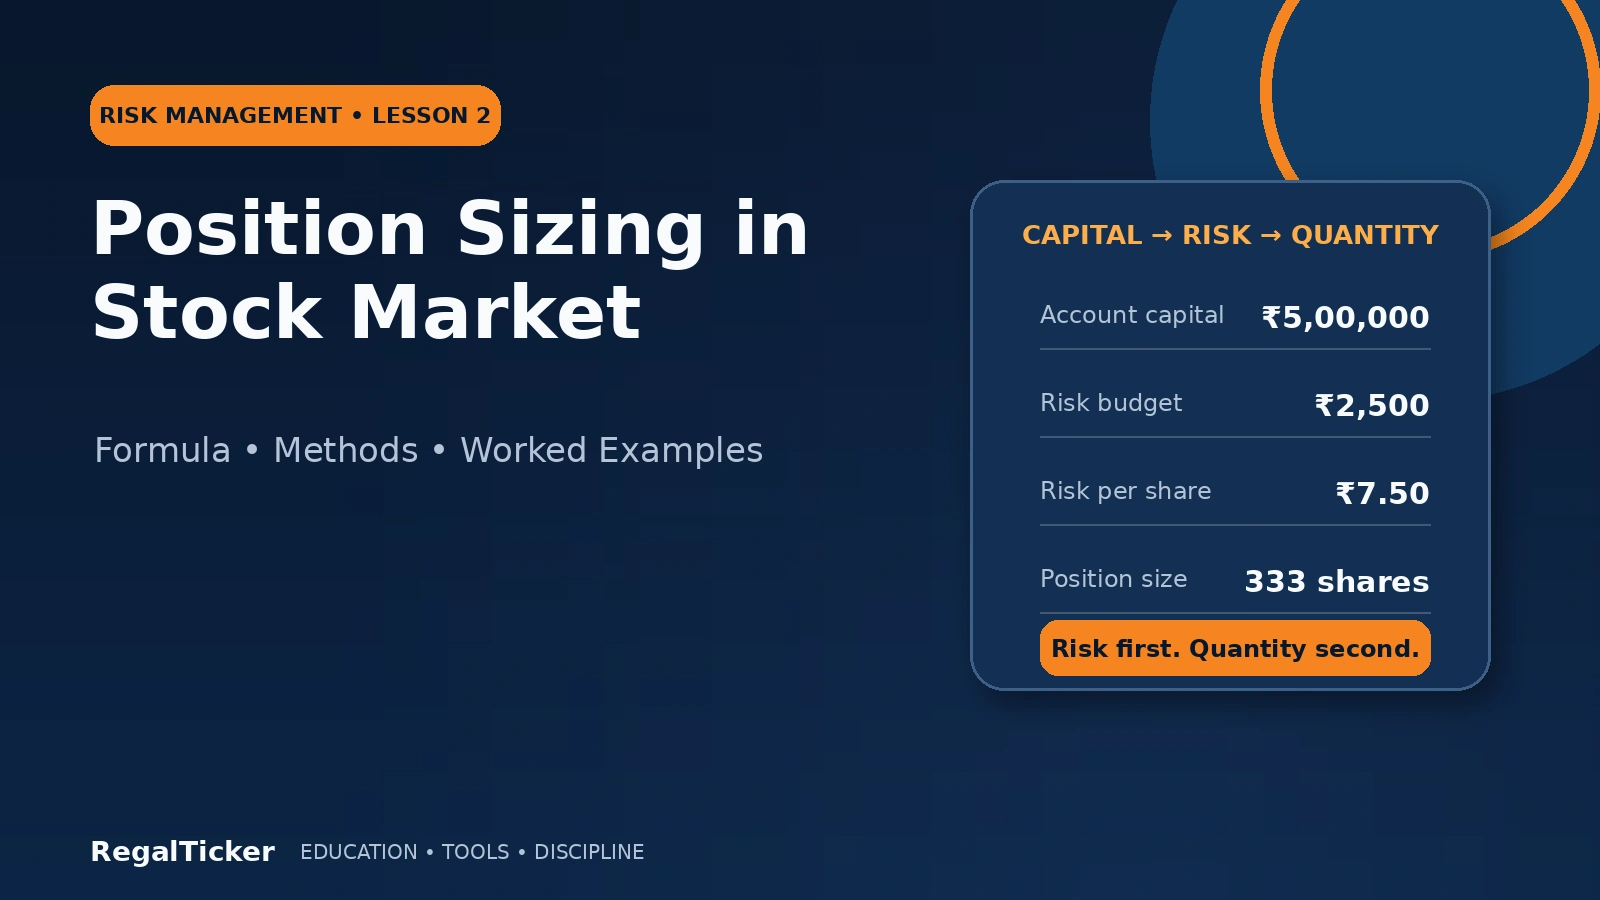
Position sizing in stock market investing and trading means deciding how many shares—or how much portfolio capital—to allocate to one decision. It converts a risk plan into a measurable quantity before money is committed.
Many beginners reverse this process. They first decide to buy 100 shares, invest ₹1 lakh or use all available cash. Only afterwards do they check the possible loss. Proper position sizing begins with the amount of loss or exposure the portfolio can tolerate, then works backwards to the quantity.
A well-sized position should answer five questions:
- How much total capital is available for the strategy?
- What is the maximum acceptable loss or allocation for this position?
- Where does the original thesis or setup become invalid?
- How much can be bought without breaching portfolio limits?
- What could make the actual loss larger than the calculation?
This lesson expands the position-sizing framework introduced in Risk Management in Stock Market: A Beginner’s Guide. It covers the main formulas, worked examples, investor and trader methods, portfolio-level controls and the most common mistakes.
For trade planning, the RegalTicker Risk-Reward Calculator can compare entry, stop-loss, target, quantity, total risk and total potential reward after the assumptions have been chosen.
Key idea: Position size is not a prediction of how confident you feel. It is a limit on how much damage one decision can cause if it fails.
What Is Position Sizing in Stock Market?
Position size is the number of shares, contracts or rupees assigned to one market position. It can be expressed in several ways:
- number of shares;
- total rupee value;
- percentage of the portfolio;
- maximum planned rupee loss;
- percentage of capital at risk;
- contribution to total portfolio risk.
These measures describe different things. A ₹1 lakh position is not automatically safer than a ₹2 lakh position. Safety depends on the price distance to invalidation, liquidity, volatility, leverage, concentration and the rest of the portfolio.
Suppose two traders each buy shares worth ₹1 lakh:
- Trader A has a planned exit 2% below the entry.
- Trader B has a planned exit 12% below the entry.
Their capital deployed is the same, but their planned price risk is very different. Trader A risks roughly ₹2,000 before costs and slippage. Trader B risks roughly ₹12,000.
Position sizing connects capital deployed with capital at risk.
Position Size Is Not the Same as Risk
Position value is:
Position value = Entry price × Quantity
Planned price risk is:
Planned price risk = Risk per share × Quantity
A position may use a meaningful portion of available cash while risking a smaller amount up to a planned exit. However, the calculation is not a guarantee. A price gap, poor liquidity, order rejection or delayed execution can create a larger loss.
The SEBI investor guide on key securities-market risks identifies market, liquidity, business and volatility risks among the factors investors should understand before committing capital. Position sizing helps control exposure to these risks, but it cannot remove them.
Why Position Sizing Matters
A sound position-sizing process helps prevent:
- one trade from causing an unacceptable portfolio loss;
- a high-conviction idea from becoming an uncontrolled concentration;
- a wide stop-loss from silently increasing risk;
- averaging down from expanding exposure beyond the original plan;
- several correlated positions from failing together;
- leverage from magnifying a normal mistake;
- emotions from determining quantity after entry.
The purpose is consistency. A good setup can fail, and a weak setup can occasionally profit. Position sizing keeps the consequence of being wrong within a deliberate boundary.
The Position Size Formula
For a price-defined long trade, the basic educational formula is:
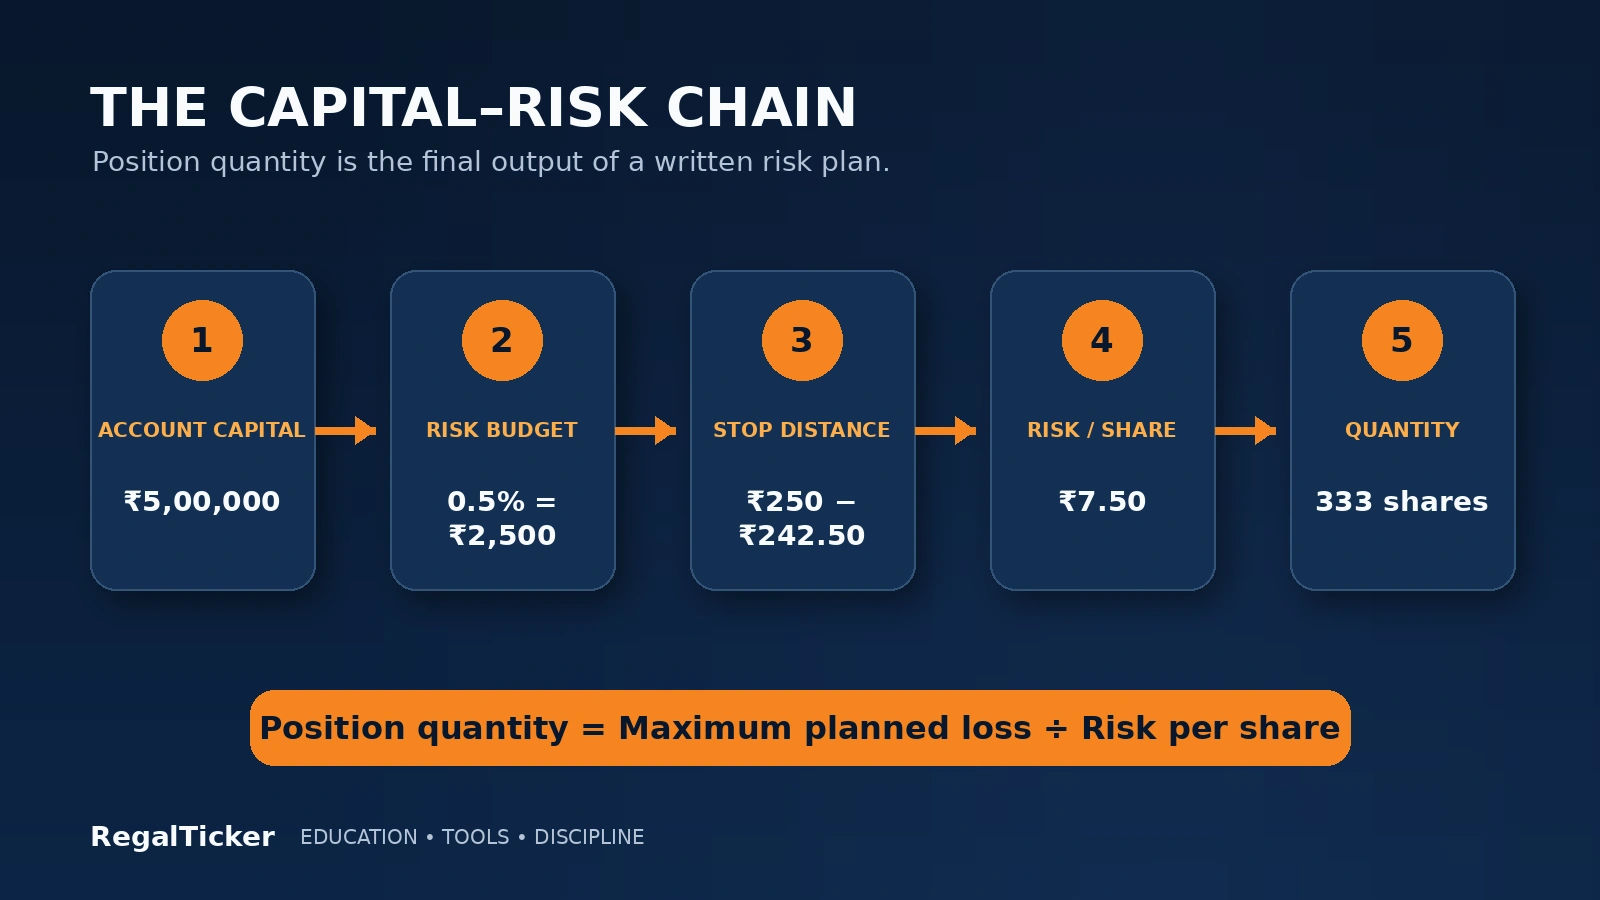
Position quantity = Maximum planned rupee loss ÷ Risk per share
Where:
Maximum planned rupee loss = Account capital × Chosen risk percentage
And:
Risk per share = Entry price − Planned exit price
For a short position:
Risk per share = Planned exit price − Entry price
A simpler general form is:
Risk per share = |Entry price − Planned exit price|
The quantity should normally be rounded down because buying a fraction above the result would exceed the chosen risk budget.
Step 1: Define Account or Strategy Capital
Use the capital actually assigned to the strategy, not every rupee you own.
For example, a person may have ₹12 lakh in total financial assets but only ₹4 lakh allocated to active equity trades. The position-size calculation should use the relevant ₹4 lakh strategy capital, while the broader financial plan still controls whether that allocation is suitable.
Do not include emergency funds, near-term obligations or money required for essential expenses.
Step 2: Choose a Maximum Planned Loss
Assume strategy capital is ₹5,00,000 and the learner selects an illustrative 0.5% risk budget.
Maximum planned rupee loss:
₹5,00,000 × 0.5% = ₹2,500
This does not mean 0.5% is correct for everyone. It is only a worked example. A suitable limit depends on financial capacity, strategy, experience, drawdown tolerance, liquidity, volatility and the total number of open positions.
The frequently discussed “1% rule” and “2% rule” are conventions, not laws. Copying a percentage without considering the portfolio can create false confidence.
Step 3: Define Invalidation Before Quantity
The invalidation level is the price or evidence that makes the original decision wrong.
For a technical trade, it may be below a meaningful support level or above resistance for a short position. For a long-term investment, invalidation may be fundamental rather than a narrow price point—for example, governance deterioration, structural business damage or a portfolio allocation breach.
Do not select the quantity first and then move the stop-loss merely to make the numbers fit. The correct sequence is:
- analyse the setup or thesis;
- define invalidation;
- measure the distance;
- calculate the quantity;
- reduce further for costs, slippage and portfolio limits.
Review Market Order, Limit Order, Stop-Loss and Stop-Limit Order before assuming that a stop trigger guarantees the intended selling price.
Step 4: Calculate Risk per Share
Suppose:
- planned entry: ₹250;
- intended exit if invalidated: ₹242.50.
Risk per share:
₹250 − ₹242.50 = ₹7.50
Step 5: Calculate and Round Down the Quantity
Maximum planned rupee loss: ₹2,500 Risk per share: ₹7.50
Position quantity:
₹2,500 ÷ ₹7.50 = 333.33 shares
Rounded down quantity: 333 shares
Approximate position value:
333 × ₹250 = ₹83,250
Approximate planned price risk:
333 × ₹7.50 = ₹2,497.50
Notice the distinction:
- portfolio capital: ₹5,00,000;
- position value: ₹83,250;
- planned price risk: ₹2,497.50.
The position uses about 16.65% of account capital, but its planned loss up to the intended exit is about 0.5% before costs and slippage.
Step 6: Adjust for Costs and Slippage
The basic formula excludes:
- brokerage;
- Securities Transaction Tax;
- exchange transaction charges;
- SEBI turnover fees;
- GST on applicable charges;
- stamp duty;
- bid–ask spread;
- slippage;
- gap risk.
Use the RegalTicker Brokerage Calculator to estimate delivery or intraday charges and the break-even price. If the all-in estimated loss exceeds the risk budget, reduce the quantity.
A more conservative formula is:
Adjusted quantity = Maximum planned loss ÷ (Price risk per share + Estimated cost and slippage per share)
Because slippage is uncertain, it should be treated as an assumption rather than a precise promise.
Worked Position Sizing Examples
Example 1: Same Risk Budget, Different Stop Distances
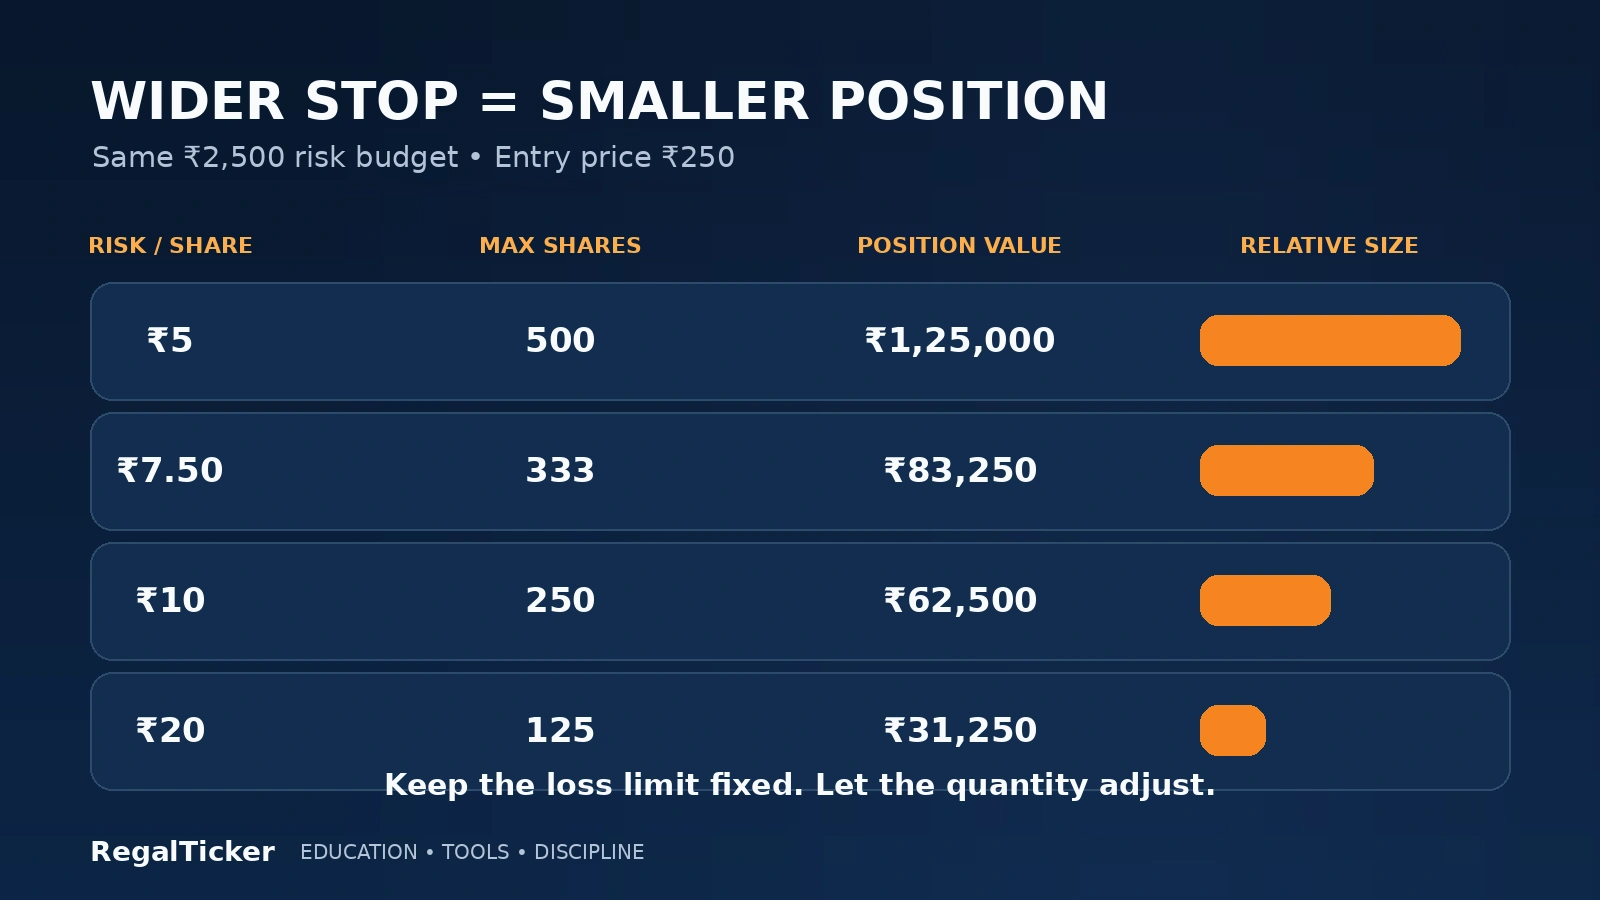
Assume:
- account capital: ₹5,00,000;
- illustrative maximum planned loss: ₹2,500;
- entry price: ₹250.
| Planned exit | Risk per share | Maximum quantity | Position value | Planned price risk |
|---|---|---|---|---|
| ₹245 | ₹5 | 500 shares | ₹1,25,000 | ₹2,500 |
| ₹242.50 | ₹7.50 | 333 shares | ₹83,250 | ₹2,497.50 |
| ₹240 | ₹10 | 250 shares | ₹62,500 | ₹2,500 |
| ₹230 | ₹20 | 125 shares | ₹31,250 | ₹2,500 |
The table shows the central position-sizing relationship:
When the risk budget stays fixed, a wider stop requires a smaller quantity.
A wide invalidation level is not automatically wrong. It may be appropriate for a more volatile instrument or a longer timeframe. The error is keeping the same quantity while widening the stop, because that silently increases the maximum planned loss.
Example 2: Entry, Stop, Target and Risk-Reward
Assume:
- entry: ₹820;
- stop-loss: ₹780;
- target: ₹940;
- maximum planned loss: ₹6,000.
Risk per share:
₹820 − ₹780 = ₹40
Position quantity:
₹6,000 ÷ ₹40 = 150 shares
Position value:
150 × ₹820 = ₹1,23,000
Potential reward per share:
₹940 − ₹820 = ₹120
Total potential reward:
150 × ₹120 = ₹18,000
Reward-to-risk ratio:
₹120 ÷ ₹40 = 3
The planned ratio is 1:3 before costs and slippage.
Enter these values in the Risk-Reward Calculator to see risk per share, total risk, total potential reward and the price relationship together. The calculator checks arithmetic; it does not decide whether the stop or target is analytically valid.
Example 3: Gap Risk Makes the Actual Loss Larger
Suppose the same 150-share position is entered at ₹820 with an intended stop at ₹780. Unexpected news causes the share to open at ₹755.
If the exit occurs at ₹755:
Actual loss per share:
₹820 − ₹755 = ₹65
Actual price loss:
₹65 × 150 = ₹9,750
The intended price risk was ₹6,000, but the actual price loss becomes ₹9,750 before charges.
This is why position size must also consider:
- overnight event exposure;
- earnings and regulatory announcements;
- liquidity;
- lower circuits or price bands;
- market depth;
- leverage;
- whether the position can be reduced before a known event.
A stop-loss is a control, not insurance.
Example 4: Long-Term Investor Using an Allocation Cap
A long-term investor may not use a tight trading stop. Position size can instead come from a portfolio allocation rule.
Assume:
- equity portfolio: ₹10,00,000;
- illustrative initial allocation cap: 3%;
- share price: ₹750.
Maximum initial position value:
₹10,00,000 × 3% = ₹30,000
Maximum initial quantity:
₹30,000 ÷ ₹750 = 40 shares
If the investor has a separate total allocation cap of 6%, the maximum eventual exposure would be ₹60,000, but any increase should depend on new evidence, valuation, portfolio concentration and the original thesis—not merely on a falling price.
The percentage is illustrative, not a recommendation.
Example 5: Averaging Down Changes Position Risk
Assume an investor owns:
- 100 shares bought at ₹500;
- then adds 100 shares at ₹400.
The new weighted average price is:
(100 × ₹500 + 100 × ₹400) ÷ 200 = ₹450
The Stock Average Calculator will calculate the weighted average correctly.
However, the more important risk facts are:
- original capital committed: ₹50,000;
- additional capital committed: ₹40,000;
- total capital committed: ₹90,000;
- quantity doubled from 100 to 200 shares.
A lower average price does not automatically improve the investment. It lowers the break-even price while increasing exposure to a position that has moved against the original entry.
Before adding, repeat the full position-size calculation using:
- current portfolio value;
- revised thesis;
- total shares after the addition;
- new allocation percentage;
- maximum acceptable loss;
- sector and factor concentration.
Position Sizing Methods for Different Decisions
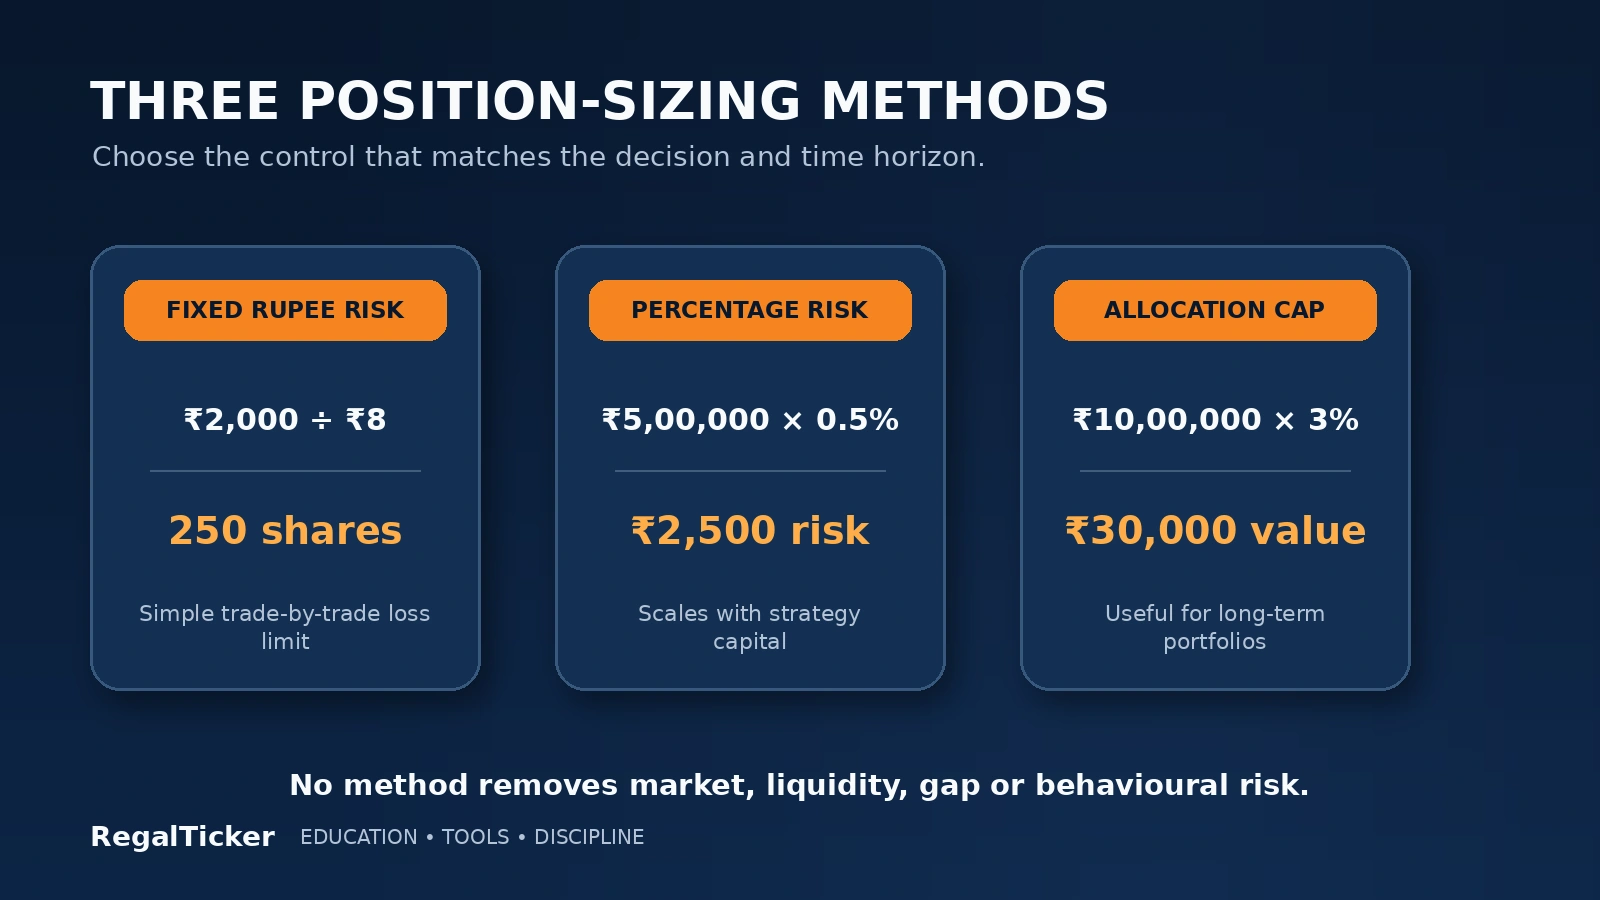
There is no single formula suitable for every investment and trading style. The method should match the time horizon, evidence and exit process.
Fixed Rupee Risk Method
The investor or trader chooses a maximum rupee loss per position.
Formula:
Quantity = Fixed rupee risk ÷ Risk per share
💡 Real example
Simple example
fixed risk: ₹2,000; risk per share: ₹8; quantity: 250 shares.
Advantages:
simple to understand; keeps nominal loss similar across trades; easy to journal.
Limitations:
the same rupee amount becomes too large or too small as account capital changes; it may ignore portfolio concentration; it may not suit long-term investments without price stops.
Percentage Risk Method
The risk budget changes with account capital.
Formula:
Risk budget = Account capital × Chosen risk percentage
Then:
Quantity = Risk budget ÷ Risk per share
Advantages:
- automatically scales down after losses;
- automatically scales up as capital grows;
- keeps risk proportionate to strategy capital.
Limitations:
- the chosen percentage can be arbitrary;
- several correlated positions can still create excessive combined risk;
- gap risk can exceed the planned percentage;
- frequent recalculation is necessary.
Portfolio Allocation Method
The position is limited to a percentage of portfolio value.
Formula:
Maximum position value = Portfolio value × Allocation cap
Then:
Quantity = Maximum position value ÷ Share price
This method is often more suitable for long-term investors whose exit process is based on thesis, valuation and rebalancing rather than a narrow price stop.
Advantages:
- directly controls concentration;
- works for long holding periods;
- supports sector and asset-allocation rules.
Limitations:
- a position can still be risky even when its weight is small;
- allocation alone does not measure downside;
- overlapping holdings can create hidden concentration.
Volatility-Adjusted Position Sizing
A more volatile stock receives a smaller position, while a less volatile stock may receive a larger position under the same risk budget.
A trader may use a volatility measure such as Average True Range to define an invalidation distance. For example:
Risk distance = ATR multiple
Then:
Quantity = Maximum planned loss ÷ Risk distance
This method adapts quantity to normal price movement, but it has limitations:
- historical volatility can change suddenly;
- an ATR-based stop is not automatically a valid technical invalidation;
- illiquid shares may show misleading volatility;
- overnight gaps can exceed the measured range.
The volatility measure should support the analysis, not replace it.
Staged or Pyramid Position Sizing
Instead of entering the full position at once, capital is divided into planned tranches.
A staged plan may specify:
- initial starter quantity;
- evidence required before adding;
- maximum total allocation;
- price or thesis condition that blocks further additions;
- revised stop or invalidation after each stage.
Adding only because price has fallen is not a staged plan. A valid staged plan defines the conditions before the first purchase.
For multiple purchases, use the Stock Average Calculator to update the weighted average, but separately recalculate the total portfolio exposure and maximum loss.
Use RegalTicker Calculators Before and After a Position
Position sizing is not an isolated calculation. A complete workflow connects risk, costs, average price and actual performance.
Before Entry: Risk-Reward Calculator
Use the Risk-Reward Calculator after selecting:
- entry price;
- stop-loss or planned exit;
- target;
- proposed quantity.
It shows:
- risk per share;
- reward per share;
- total potential risk;
- total potential reward;
- reward-to-risk ratio;
- risk as a percentage of entry price.
The calculator is most useful as a final arithmetic check. Do not begin with a desired ratio and invent an unrealistic target merely to make the result attractive.
Before Entry: Brokerage Calculator
Use the Brokerage Calculator to estimate charges, net profit and break-even price.
This matters because a trade with a narrow target may look acceptable before costs but become unattractive after:
- brokerage;
- STT;
- GST;
- exchange charges;
- stamp duty;
- repeated turnover.
Position size should be reduced when expected costs and slippage would push the total loss beyond the chosen risk budget.
While Building a Position: Stock Average Calculator
Use the Stock Average Calculator when the same stock is bought at different prices.
The calculator gives the weighted average purchase price, but each addition should also trigger four questions:
- Has the thesis improved, weakened or remained unchanged?
- What is the new total allocation?
- What is the revised loss if invalidation occurs?
- Does the position now create sector or portfolio concentration?
Averaging is an arithmetic event and a risk-management event.
After Exit: Stock Return Calculator
Use the Stock Return Calculator after a position is closed—or when reviewing a long-term holding—to calculate:
- initial investment;
- current or final value;
- dividends received;
- total profit or loss;
- total return;
- annualised return.
Post-trade review should compare planned and actual outcomes:
| Review item | Planned | Actual |
|---|
A profitable result does not prove the position size was appropriate. A rule-breaking oversized trade can profit through luck. A controlled loss can reflect a sound process when the analysis, quantity and exit followed the written plan.
Use the Complete Investor Tools Hub
The RegalTicker Investor Tools hub contains calculators for risk-reward, brokerage, stock averages, returns, taxes, mutual-fund planning and corporate actions.
For this lesson, the most relevant sequence is:
- calculate weighted average if multiple entries exist;
- define entry, stop and target;
- calculate risk-reward and total proposed risk;
- estimate brokerage and break-even;
- reduce quantity if the all-in risk is too high;
- calculate actual return after exit.
This sequence turns the calculators into one practical workflow, helping you check average cost, planned risk, trading costs and actual return at the appropriate stage.
Portfolio-Level Position Sizing
A position can look controlled on its own and still create excessive portfolio risk.
Total Open Risk
For price-defined trades:
Total open risk = Sum of planned risk across all open positions
Suppose four trades each have a planned risk of ₹2,500.
Total open risk:
4 × ₹2,500 = ₹10,000
If strategy capital is ₹5,00,000, total planned open risk is 2% before gaps, costs and correlation.
The combined number matters because several trades can fail on the same day.
Correlated Positions
Five banking stocks are five securities but may be one major risk driver. They can react together to:
- interest-rate expectations;
- credit conditions;
- regulation;
- system liquidity;
- asset-quality concerns;
- a broad financial-sector sell-off.
Likewise, several metal companies may depend on the same commodity cycle. Several technology positions may respond to the same global valuation factor or currency move.
Position size should therefore be checked at three levels:
- individual position;
- sector, theme or factor group;
- total portfolio.
Position Weight After Price Changes
A position that performs well can grow beyond its original allocation.
Current position weight:
Current market value of position ÷ Current portfolio value × 100
Suppose a ₹50,000 position in a ₹10 lakh portfolio grows to ₹1,20,000 while the rest of the portfolio remains near ₹9,50,000.
New total portfolio value:
₹1,20,000 + ₹9,50,000 = ₹10,70,000
New position weight:
₹1,20,000 ÷ ₹10,70,000 × 100 = 11.21%
The original 5% position has become more than 11% of the portfolio. The investor should review whether the increased concentration still fits the risk policy.
Drawdown-Based Reduction
A drawdown is the decline from a previous peak in account or portfolio value.
After a meaningful drawdown, continuing with the same rupee risk can make recovery harder. Percentage-risk methods naturally reduce quantity as capital falls, but a written policy can go further by requiring:
- smaller position sizes after a defined drawdown;
- fewer simultaneous positions;
- no leverage;
- a review of recent rule violations;
- re-testing the strategy before normal size resumes.
The purpose is not to recover quickly. It is to prevent emotional attempts to recover from expanding the drawdown.
Liquidity and Position Size
A mathematically valid quantity may be too large for the instrument’s available liquidity.
Check:
- average traded volume;
- bid–ask spread;
- order-book depth;
- delivery volume where relevant;
- price bands or circuit limits;
- the likely impact of your own order;
- whether the full quantity can be exited during stress.
Position sizing should use the amount that can be managed and exited reasonably, not merely the amount the formula permits.
Common Position Sizing Mistakes
Buying a Round Number Without Calculation
Buying 10, 100 or 1,000 shares because the number feels convenient ignores price risk and portfolio capital.
The same 100 shares create very different exposure at ₹50, ₹500 and ₹5,000 per share.
Using All Available Cash
Cash availability is not a position-size rule. It ignores invalidation distance, portfolio concentration and future opportunities.
A broker allowing the purchase does not mean the portfolio can safely absorb the risk.
Treating the 1% Rule as Universal
A 1% risk convention may be too high for a strategy with many correlated positions, frequent gaps or leverage. It may be unnecessary for a long-term investor using allocation and thesis controls.
Use a percentage only after defining what capital it applies to and how total portfolio risk is controlled.
Moving the Stop to Increase Quantity
A trader wants 500 shares but the calculation permits only 250. Moving the stop closer merely to fit 500 shares can place it inside normal price noise. Moving it farther while keeping 500 shares increases the planned loss.
Invalidation comes first. Quantity adjusts to it.
Ignoring Charges and Slippage
A narrow-stop strategy may experience a meaningful difference between theoretical and actual loss.
Run the proposed trade through the Brokerage Calculator, include a realistic slippage allowance and round the final quantity down.
Averaging Down Without a Maximum Allocation
Repeated additions can turn a small position into the largest portfolio risk.
Before the first entry, define:
- whether additions are allowed;
- maximum number of tranches;
- evidence required for each addition;
- maximum final allocation;
- condition that cancels all further buying.
Use the Stock Average Calculator for cost arithmetic, not as justification to add.
Sizing by Confidence
Statements such as “this one cannot fail” or “I am 90% sure” are not position-sizing inputs.
Confidence is subjective and often rises after recent success or social confirmation. Quantity should come from written rules, not excitement.
Ignoring Correlation
Three positions with separate stop-losses can still behave like one large position if they depend on the same market driver.
Calculate grouped exposure before opening another similar trade.
Increasing Size to Recover a Loss
Revenge sizing converts emotional pressure into larger financial risk. A recent loss is not evidence that the next trade has a higher probability of success.
After a loss or drawdown, review the process and use the same or smaller risk—not a recovery target.
Confusing a Good Outcome With Good Sizing
An oversized trade that profits remains an oversized trade. The favourable outcome can reinforce dangerous behaviour.
Judge the process separately from the result.
Position Sizing Checklist
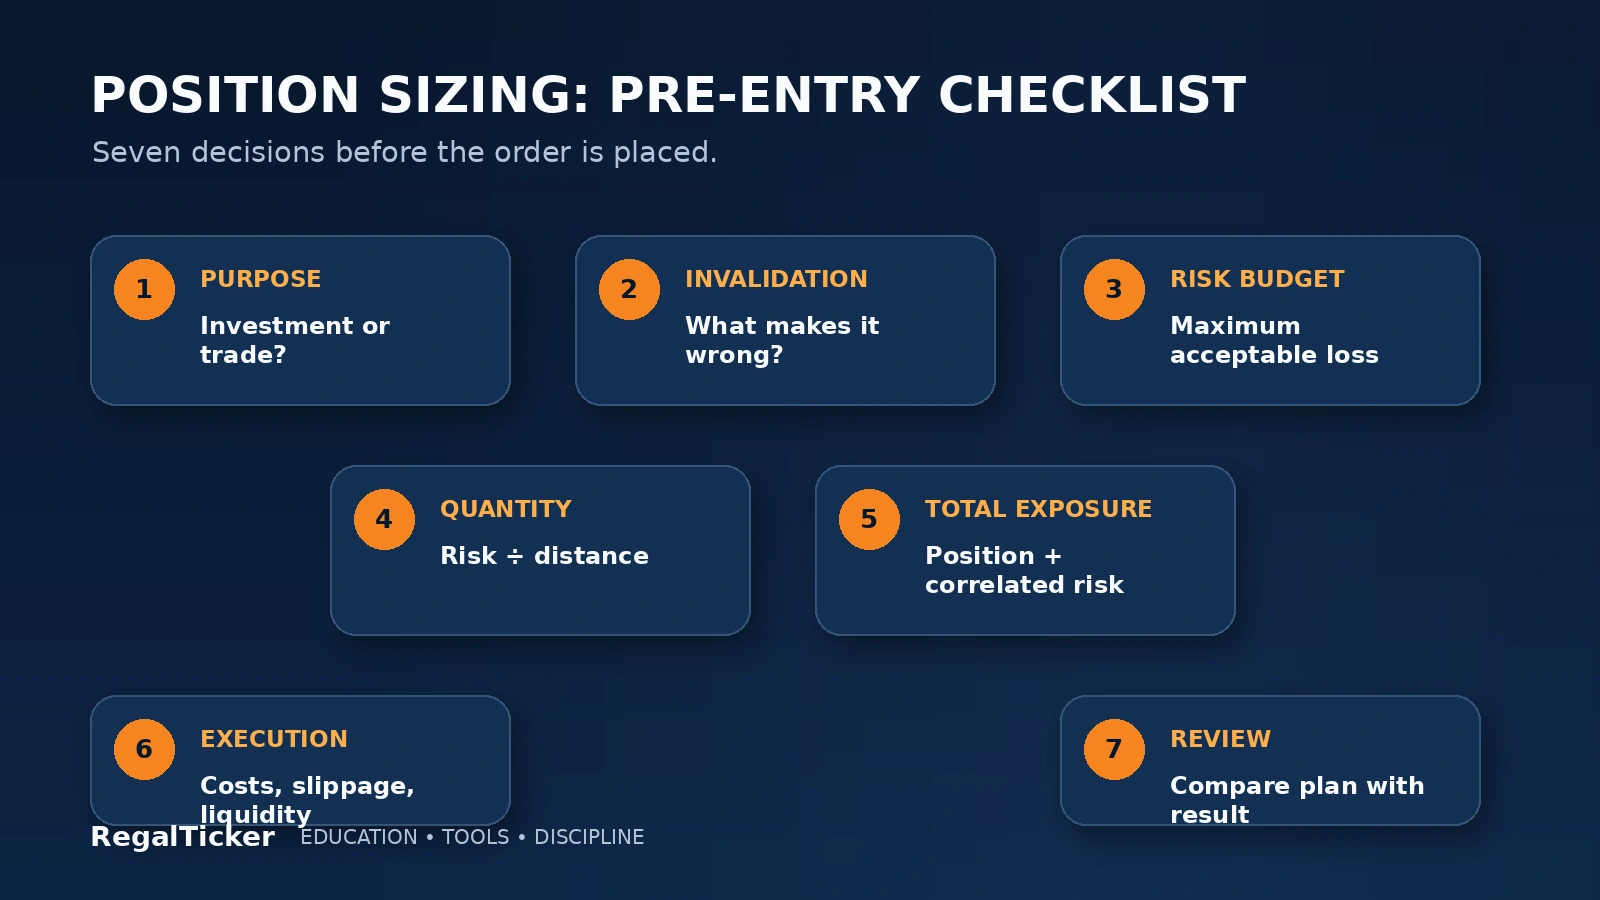
Before placing an order, record:
| Field | Decision |
|---|---|
| Purpose | Long-term investment, swing trade or intraday trade |
| Strategy capital | Capital actually assigned to this approach |
| Thesis or setup | Evidence supporting the decision |
| Invalidation | Price, event or evidence that makes it wrong |
| Maximum planned loss | Rupee amount and percentage, if used |
| Risk per share | Entry minus planned exit, adjusted where appropriate |
| Calculated quantity | Risk budget divided by risk per share |
| Position value | Entry price multiplied by quantity |
| Portfolio weight | Position value divided by portfolio value |
| Correlated exposure | Sector, theme, factor and event overlap |
| Costs and slippage | Brokerage, taxes, spread and execution allowance |
| Liquidity | Volume, spread, order depth and exit practicality |
| Review trigger | Date, event, price, thesis change or allocation breach |
Then follow this order:
- define whether the decision is an investment or a trade;
- identify the evidence and invalidation;
- choose the maximum acceptable loss or allocation;
- calculate risk per share;
- calculate and round down quantity;
- check position value and portfolio weight;
- combine risk with correlated open positions;
- estimate costs and slippage;
- use the Risk-Reward Calculator for an arithmetic check;
- use the Brokerage Calculator for an all-in cost check;
- record the plan before entry;
- compare planned and actual results after exit with the Stock Return Calculator.
If the quantity is too small to be practical, skip the position rather than forcing the risk plan to fit the trade.
Frequently Asked Questions
What is position sizing in stock market trading?
Position sizing is the process of deciding how many shares or how much capital to allocate to a trade or investment. It normally considers account capital, maximum acceptable loss, invalidation distance, costs, liquidity and total portfolio exposure.
What is the basic position size formula?
For a price-defined position:
Position quantity = Maximum planned rupee loss ÷ Risk per share
Risk per share is the absolute difference between entry price and the planned exit if the setup is invalidated. The result should generally be rounded down.
How do I calculate risk per trade?
An illustrative percentage method is:
Risk per trade = Strategy capital × Chosen risk percentage
For ₹5,00,000 of strategy capital and an illustrative 0.5% limit, the maximum planned loss is ₹2,500. The percentage is a personal policy input, not a universal recommendation.
Is the 1% risk rule compulsory?
No. It is a commonly discussed convention, not a regulation or universal standard. The appropriate limit depends on financial capacity, strategy, volatility, liquidity, leverage, number of open positions and correlation.
Does a stop-loss guarantee the calculated loss?
No. A stop can execute at a worse price during a gap, fast market or illiquid condition. Actual loss can exceed the planned amount, which is why quantity, liquidity and portfolio limits remain necessary.
Should long-term investors use the same formula as traders?
Not always. A long-term investor may use portfolio allocation caps, thesis invalidation, valuation discipline and rebalancing rather than a narrow price stop. The control must match the investment process.
How should I size a volatile stock?
Under a fixed risk budget, a wider valid stop or volatility range produces a smaller quantity. Volatility measures may help define the distance, but they do not replace analysis or protect against gaps.
Can I increase position size after a profit?
Account growth can increase the rupee amount produced by percentage-risk formulas, but size should rise only within a tested strategy and portfolio policy. Recent profit alone is not a reason to become aggressive.
What should I do before averaging down?
Reassess the thesis, calculate the new weighted average, measure total allocation, check the revised loss at invalidation and review sector concentration. A lower average price is not the same as lower risk.
Which RegalTicker calculators are most useful for position sizing?
Use the Risk-Reward Calculator for entry, stop, target and total proposed risk; the Brokerage Calculator for charges and break-even; the Stock Average Calculator for multiple purchases; and the Stock Return Calculator for post-position performance review.
Final Takeaway
Position sizing in stock market investing and trading is the bridge between analysis and capital protection. The correct question is not “How many shares can I buy?” It is “How much exposure can this decision receive without damaging the wider plan if I am wrong?”
For a price-defined trade, start with the maximum planned loss, define invalidation, calculate risk per share and let the formula determine the quantity. For long-term investments, use allocation caps, thesis rules and portfolio concentration controls. In both cases, account for costs, liquidity, correlation, gaps and behavioural risk.
Continue to Lesson 3: Risk-Reward Ratio Explained, where entry, stop, target, probability, break-even win rate and expectancy will be examined in depth. Until then, use the RegalTicker Risk-Reward Calculator to test the arithmetic of a planned position.
Educational disclaimer: This article is for education and general information only. It does not provide personalised investment advice, a recommended risk percentage, a trading strategy or a buy/sell call. Market investments involve risk, and actual losses can exceed planned amounts because of gaps, liquidity, costs, slippage and execution conditions. Consider your financial circumstances and seek advice from a qualified professional where required.