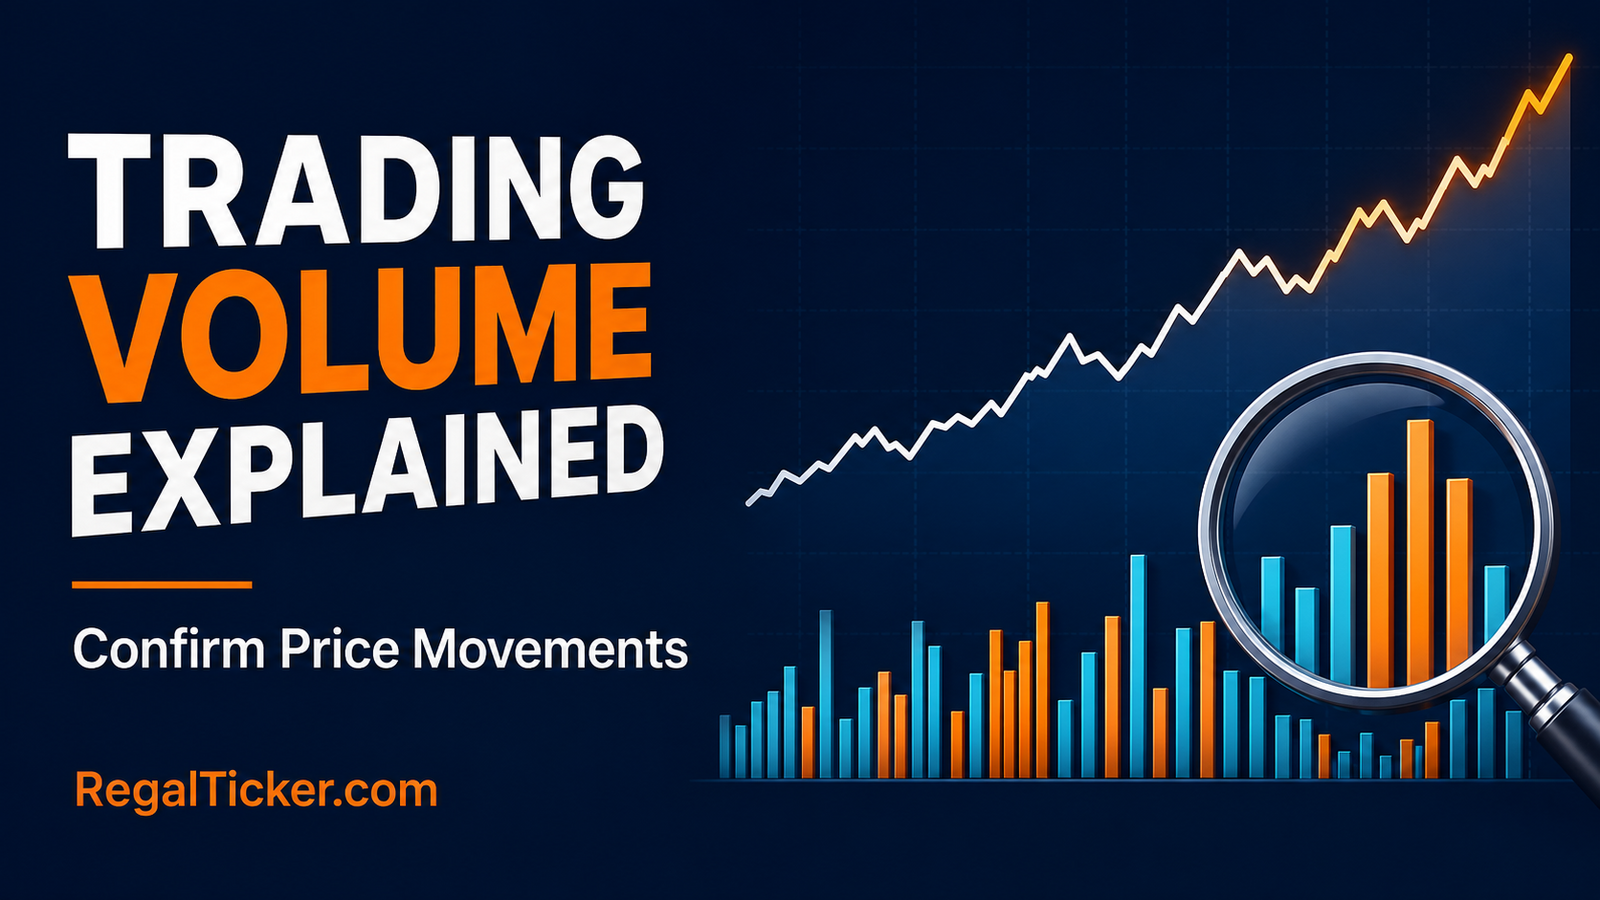
Price tells you where a share traded. Trading volume in stock market analysis tells you how much of it changed hands during the selected period. Read together, price and volume can show whether a move attracted broad participation or developed with relatively little activity.
Suppose a share rises above an important resistance area. The price breakout is the event. If volume also expands well above its recent normal level, participation supports the move. If the price crosses resistance on unusually low volume and quickly returns below it, the evidence is weaker.
This does not mean high volume guarantees continuation or low volume guarantees failure. Volume is a confirmation tool, not a prediction machine. It becomes useful only when you compare it with the stock’s own recent activity, market structure, liquidity, news and timeframe.
Before studying volume, understand How to Read Candlestick Charts: A Beginner’s Guide, Support and Resistance in the Stock Market: Beginner’s Guide and Trend Analysis: Uptrend, Downtrend and Sideways Market. Volume cannot repair a chart analysis that has no clear context.
What Is Trading Volume in Stock Market?
Trading volume is the total quantity of shares, contracts or other units traded during a defined period. In simple terms, trading volume in stock market data measures completed market activity—not the number of people watching a share.
On a daily equity chart, the volume bar normally represents shares traded during that trading session. On a 15-minute chart, each bar represents the quantity traded during that 15-minute interval. In derivatives, platforms may display volume in contracts or another contract-related unit, so always check the instrument and data definition.
A Simple Volume Example
Assume one investor sells 500 shares and another investor buys those same 500 shares. The executed trade adds 500 shares to volume—not 1,000.
Every completed trade has a buyer and a seller. Therefore, a basic volume bar does not tell you that “only buyers” or “only sellers” were present. It measures completed activity. Price behaviour helps show which side was more aggressive.
This distinction connects directly with the order book. A transaction occurs only when compatible buy and sell orders match. Read Bid Price, Ask Price, Spread and Order Book Explained for the mechanics behind an executed trade.
What a Volume Bar Does—and Does Not—Reveal
| Volume can help show | Volume alone cannot prove |
|---|---|
| How active trading was during a period | Why every participant traded |
| Whether activity expanded or contracted | That price must continue in the same direction |
| Whether a breakout attracted participation | That a high-volume candle is a safe entry |
| Whether liquidity may be improving or deteriorating | Whether the company is fundamentally strong |
| Whether current activity is unusual versus recent history | Whether all volume represents delivery buying |
Many charting platforms colour a volume bar green or red according to the associated candle or a platform-specific rule. That colour is a visual convention. It does not mean a green bar contains purchases without sales, because every executed trade still has both sides.
SEBI’s investor-education overview includes trading volume among the inputs studied in technical analysis: SEBI Investor — Technical vs Fundamental Analysis. NSE also makes security-wise historical price and volume information available through its Equity Security-wise Archives.
How to Read Trading Volume in Stock Market
Absolute volume is rarely meaningful by itself. Ten lakh shares may be extraordinary for one company and routine for another. To read trading volume in stock market charts correctly, compare a stock with its own recent volume, using the same exchange, instrument and timeframe.
A common starting point is a 20-session or 50-session average volume. The exact lookback is not a universal rule; it is simply a reference. What matters is whether current participation is ordinary, expanding or unusually weak relative to an appropriate baseline.
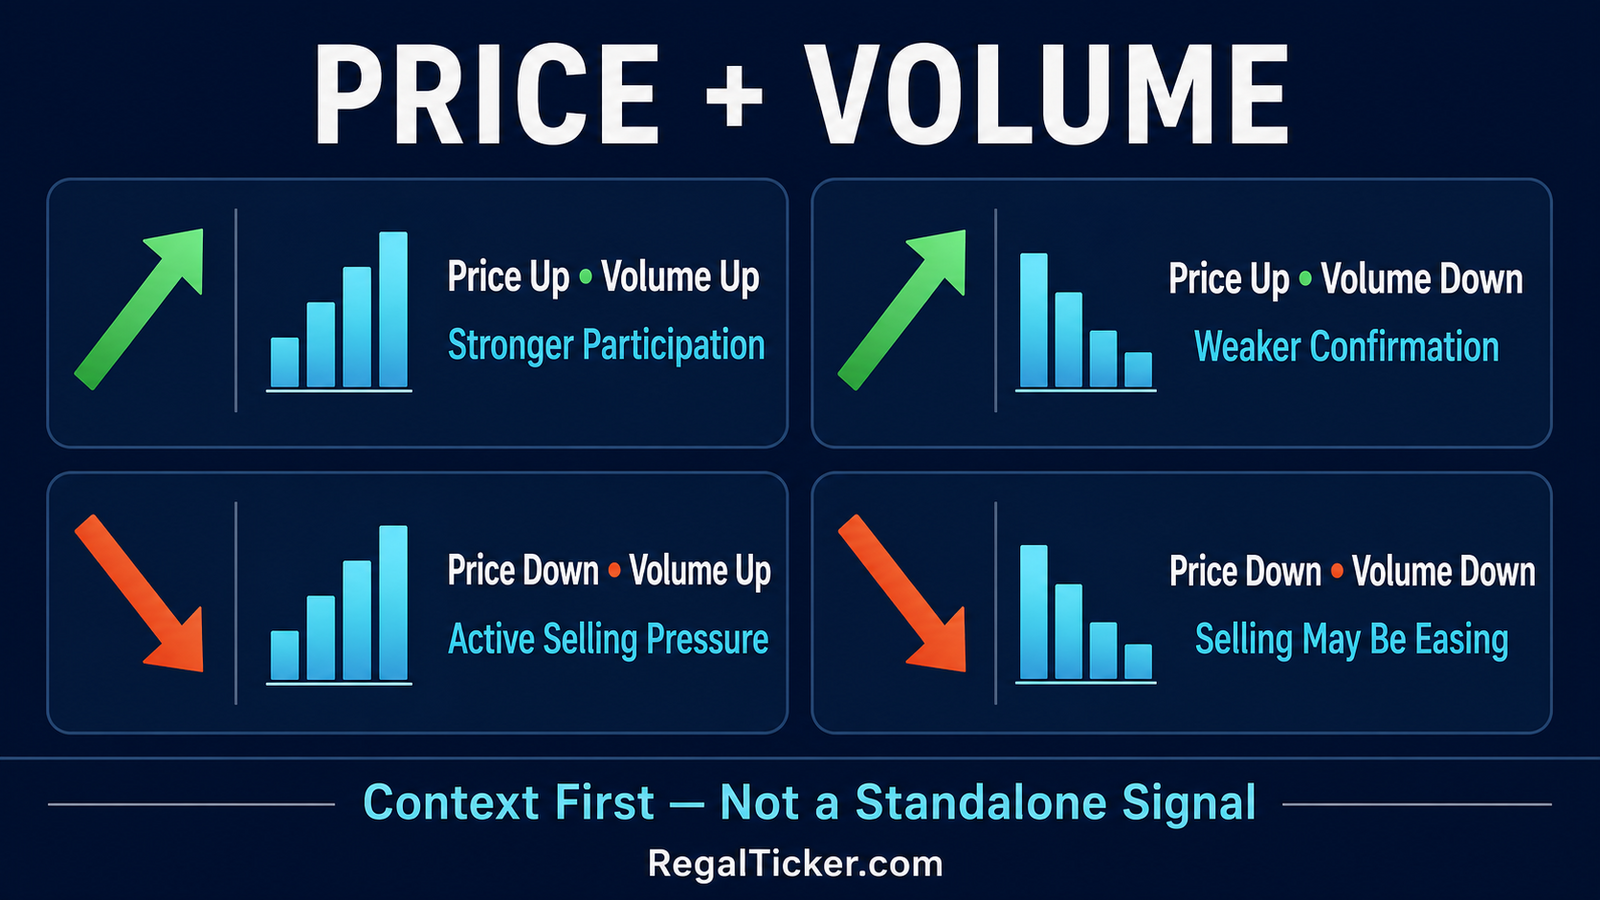
The Basic Price–Volume Matrix
| Price behaviour | Volume behaviour | Possible reading | What it does not mean |
|---|---|---|---|
| Price rising | Volume rising | Buying interest and participation are expanding | The rise cannot reverse |
| Price rising | Volume falling | The advance has weaker participation | Sell immediately |
| Price falling | Volume rising | Selling pressure or urgent repositioning is active | The company has become worthless |
| Price falling | Volume falling | Selling participation may be contracting | A bottom is confirmed |
| Price flat | Volume rising | A larger battle is occurring inside the range | Breakout direction is known |
| Price flat | Volume falling | Participation and volatility may be contracting | A breakout is imminent |
These are starting interpretations, not mechanical rules. For example, a price rise on declining volume can continue for longer than expected. A price fall on very high volume can mark aggressive selling, panic, capitulation or event-driven repositioning. The next candles and surrounding structure decide which explanation gains evidence.
Relative Volume Is More Useful Than a Raw Number
Relative volume asks how current activity compares with normal activity for that stock at that time.
If a share normally trades 4 lakh shares daily and suddenly trades 20 lakh, volume is five times its recent norm. If another share regularly trades 3 crore shares, a 20-lakh-share session would be unusually quiet. The same raw number has opposite meanings.
Intraday comparisons also need care. Activity is often higher near the opening and closing periods than in the middle of the session. Comparing the first 15 minutes with a quiet midday interval can create a misleading “spike.” A fair intraday comparison uses similar time-of-day periods.
Volume, Turnover and Number of Trades Are Different
- Volume or traded quantity measures shares or contracts traded.
- Turnover or traded value measures the monetary value of those trades.
- Number of trades counts executed transactions.
A high-priced share can generate substantial turnover with modest share volume. A low-priced share can show very large share volume without equally large traded value. Never use these terms interchangeably.
Reading Volume in Trends, Pullbacks and Key Levels
Trading volume in stock market analysis becomes clearer when placed inside a trend, consolidation or important price zone.
Volume During an Uptrend
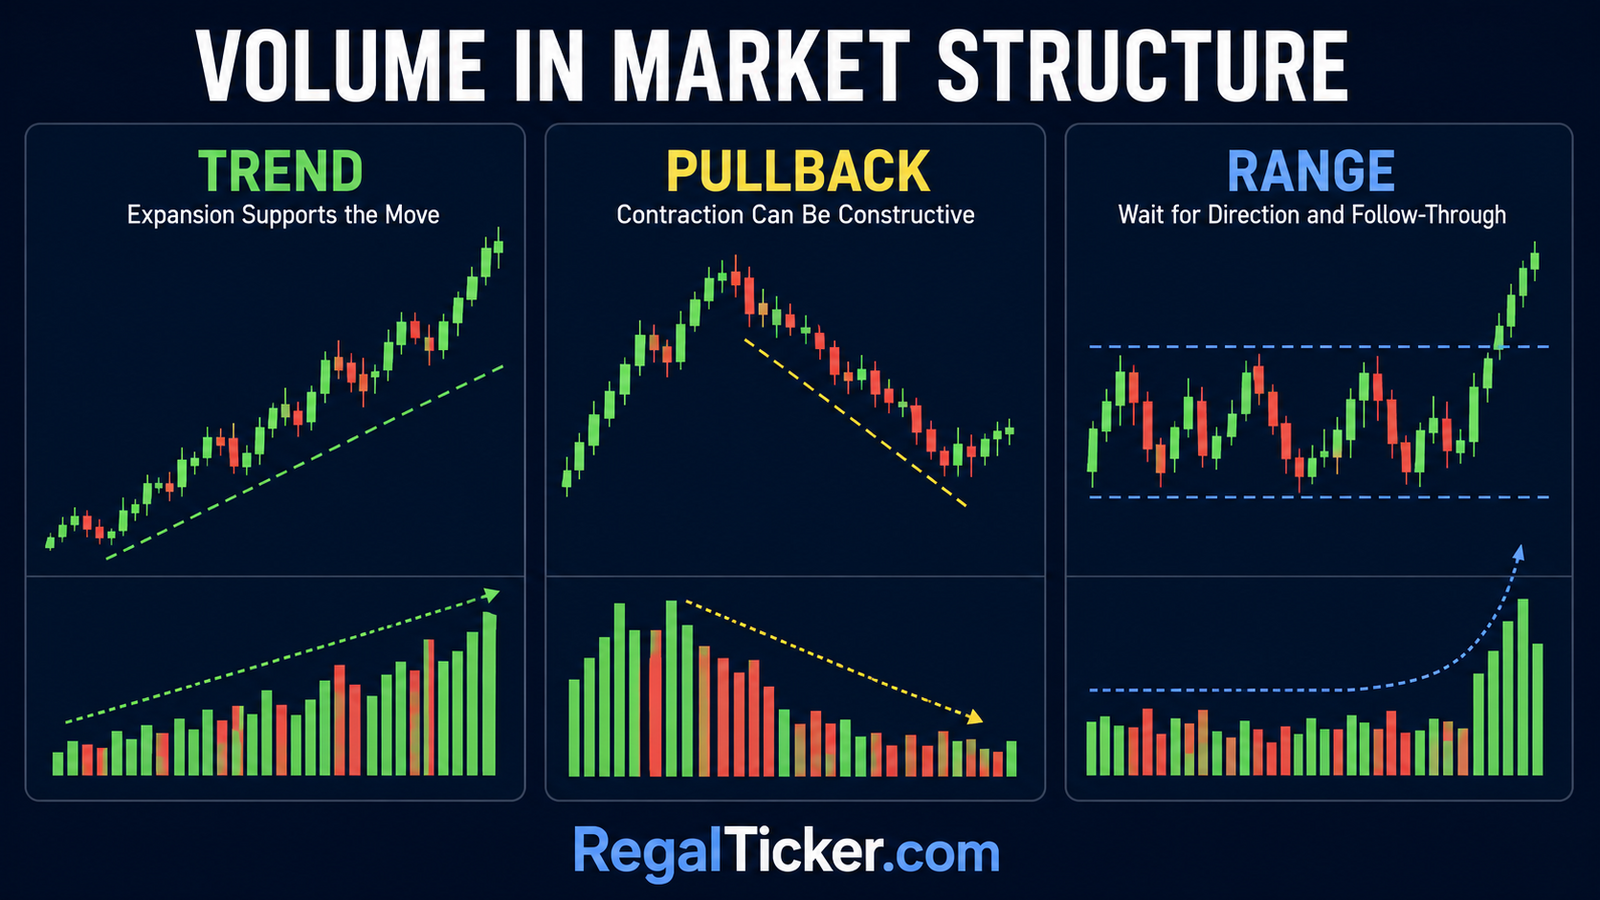
A constructive uptrend often shows stronger participation during advances and quieter activity during routine pullbacks. This suggests that buyers become more active when price moves with the trend, while selling during pauses is less urgent.
However, the pattern will not be perfect. Results, news, index changes and market-wide volatility can create exceptions. Focus on the repeated relationship across several swings, not one isolated bar.
If price keeps making higher highs while volume steadily contracts, the trend may be losing participation. That is a warning to examine structure more closely—not proof of an immediate reversal.
Volume During a Downtrend
In a downtrend, increasing volume during declines can confirm active selling pressure. Rallies on weak volume may represent temporary relief rather than a durable trend change.
Later, declining volume during new price lows can suggest that sellers are becoming less aggressive. Still, a reduction in selling is not the same as confirmed buying. Look for a change from lower highs and lower lows to stronger structure before declaring a reversal.
Volume During Pullbacks
A pullback is a temporary move against the prevailing trend. In an uptrend, a controlled decline on below-average volume may be less concerning than a sharp break of support on heavy volume.
Ask:
- Is the pullback holding an important higher low or support zone?
- Is volume contracting during the pullback?
- Does volume expand when price resumes the original direction?
- Has the underlying swing structure remained intact?
This is why volume should be combined with Trend Analysis: Uptrend, Downtrend and Sideways Market, not read separately.
Volume Inside a Sideways Range
Volume often contracts as a range matures, but it can also expand near its boundaries as buyers and sellers compete. High volume inside the centre of a range does not provide a clear direction.
More useful evidence appears when price tests support or resistance:
- Rejection from support with expanding activity may show stronger demand.
- Rejection from resistance with expanding activity may show stronger supply.
- Repeated tests can weaken a level even when volume is mixed.
- A decisive exit from the range needs price confirmation and follow-through.
Volume and Chart Patterns
Patterns represent organised price behaviour, while volume adds evidence about participation. A flag may contract on lighter volume during its pause and expand when the trend resumes. A head-and-shoulders breakdown may carry more weight if participation increases beneath the neckline.
These are tendencies, not mandatory textbook conditions. First confirm that the formation is valid using Chart Patterns Explained: Reversal and Continuation Patterns. A large volume bar cannot transform a poorly defined shape into a reliable pattern.
Volume at a Breakout or Breakdown
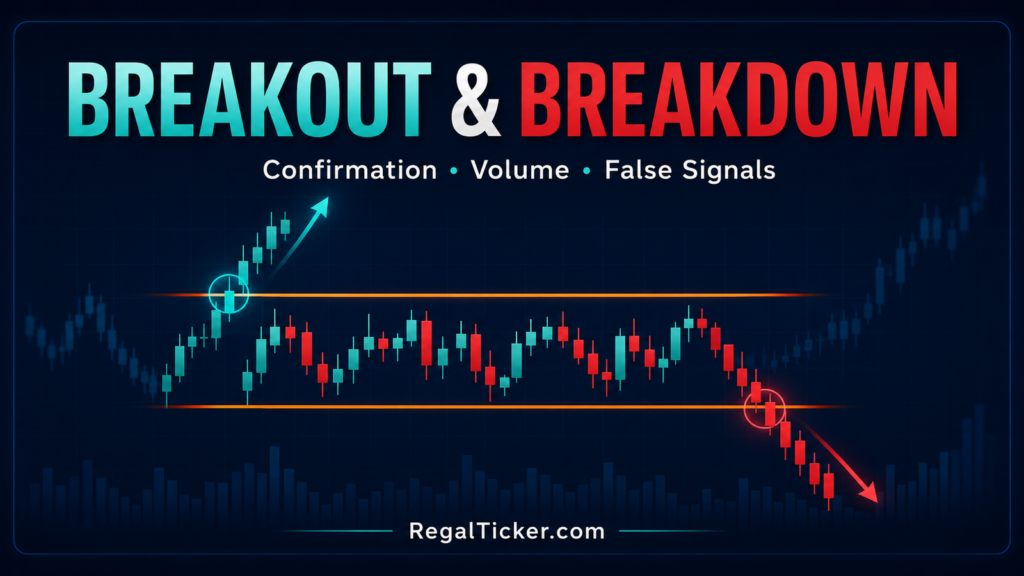
A breakout occurs when price moves above a meaningful resistance area or pattern boundary. A breakdown occurs below support.
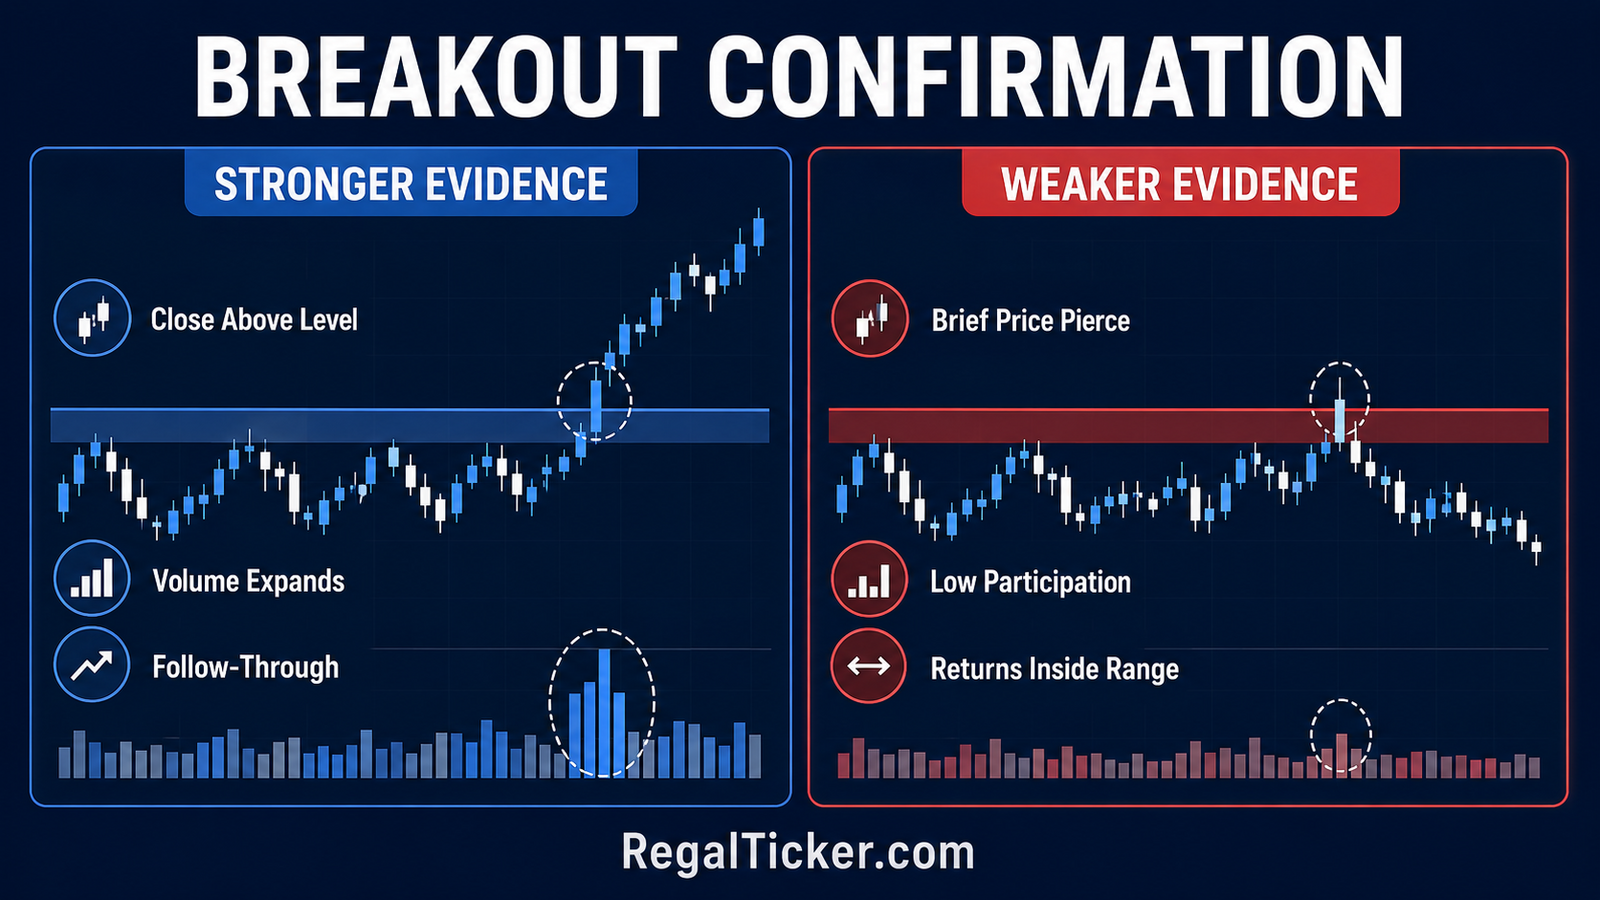
Expanding volume can strengthen the evidence because more quantity participated in the move. But confirmation should also consider:
- whether price closed beyond the level,
- the size and quality of the candle,
- nearby higher-timeframe barriers,
- follow-through in later periods,
- whether a retest holds,
- and whether the move is caused by a one-off event.
A low-volume breakout is not automatically false, particularly in a lightly traded period. It simply deserves more caution. Conversely, high volume cannot prevent a failed breakout if the move is absorbed and price returns inside the old range.
Volume Spikes, Liquidity and Event-Driven Activity
A volume spike means activity is unusually high relative to a suitable recent comparison. It draws attention, but it does not provide its own bullish or bearish conclusion.
Why Trading Volume Can Spike
Common causes include:
- quarterly or annual results,
- management guidance or corporate announcements,
- mergers, acquisitions and stake transactions,
- dividend, bonus, split or rights-related events,
- inclusion in or removal from an index,
- institutional rebalancing,
- bulk or block transactions,
- derivatives expiry,
- regulatory action,
- rumours or sudden news,
- and market-wide risk events.
Check exchange filings and official announcements before inventing a chart-based story. SEBI’s trading framework distinguishes disclosed bulk and block activity, and the latest official rules should be checked when such transactions are relevant. The NSE Price, Volume and Delivery Archives can help verify historical activity.
A Volume Spike at the Top or Bottom
Very high volume after an extended rise can mean fresh demand, profit-taking, distribution, index activity or a transfer between large participants. Very high volume after a prolonged fall can mean aggressive selling, forced exits, value buying or capitulation.
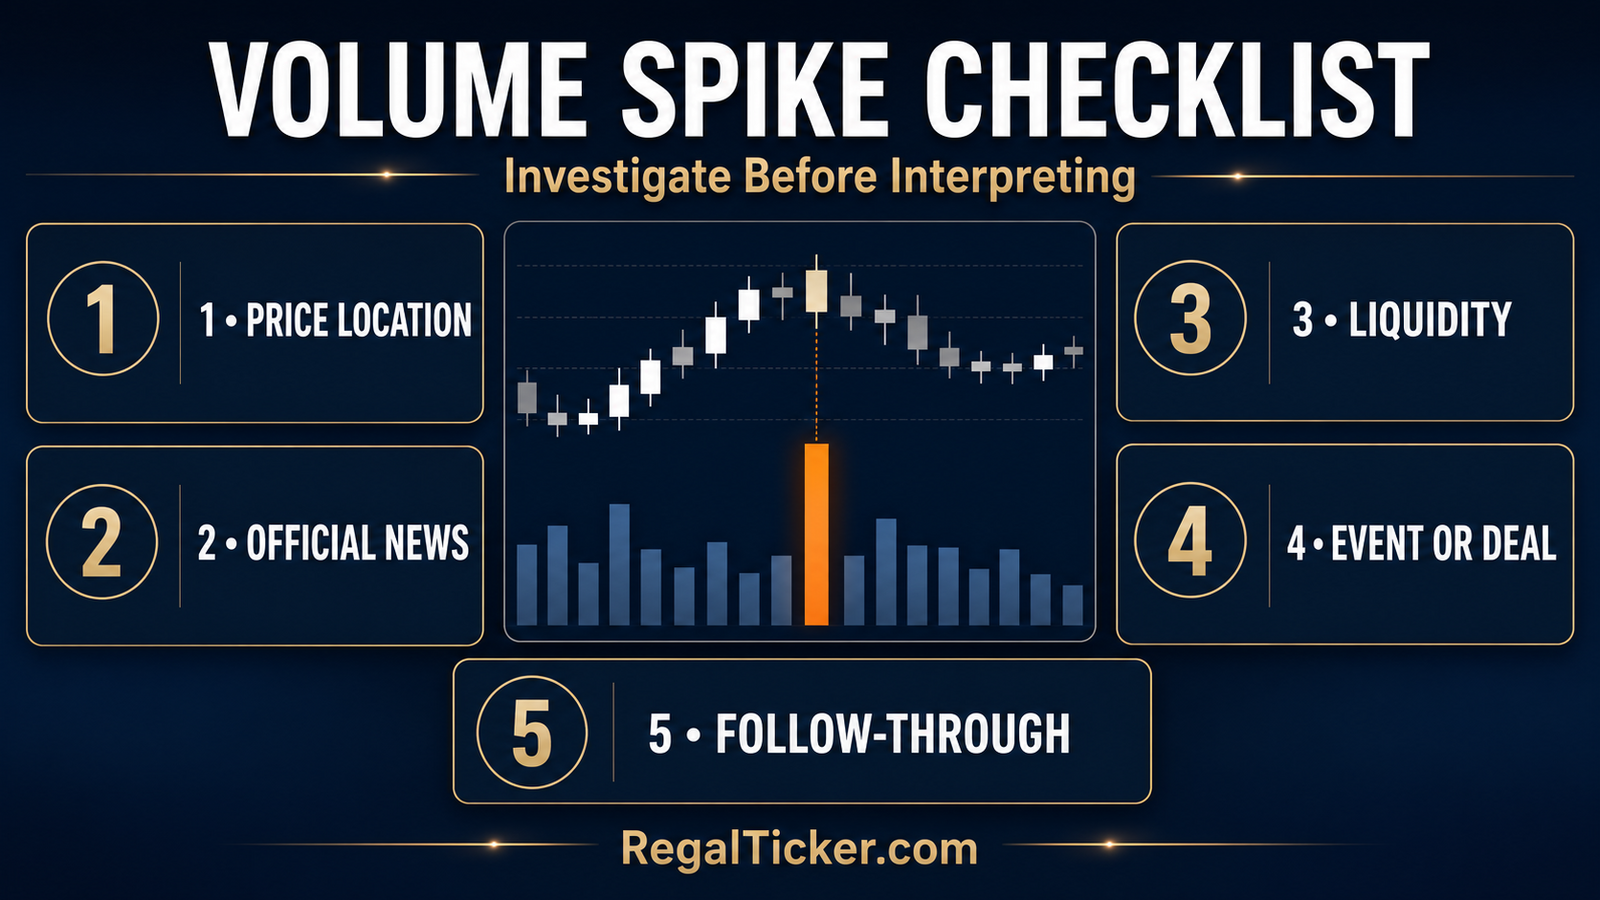
The location matters, but the close and follow-through matter more:
- Did price close near the session high or low?
- Was there a long upper or lower wick?
- Did the next session continue or reverse the move?
- Did an important level hold or fail?
- Was there an official announcement?
One bar describes an event. Several bars reveal how the market absorbed it.
Volume and Liquidity
Higher typical volume often supports liquidity, but volume is not the only measure. Spread, order-book depth, volatility and the size of your order also matter.
A low-volume share may have:
- a wider bid–ask spread,
- fewer orders near the current price,
- greater slippage,
- abrupt price gaps,
- and difficulty exiting a large position.
This is particularly important for market orders. Learn how execution and slippage work in Market Order, Limit Order, Stop-Loss and Stop-Limit Order.
Unusual volume in an illiquid share deserves extra scepticism. A large percentage increase from a very low base may still represent limited actual participation.
Volume Indicators and Related Market Data
Raw volume bars should come first. Indicators can summarise or transform the same data, but they do not create new certainty.
| Tool or data point | What it measures | Main use | Important limitation |
|---|---|---|---|
| Volume moving average | Average volume over a selected lookback | Compare current activity with recent normal | Sensitive to lookback and old spikes |
| On-Balance Volume (OBV) | Cumulative volume added or subtracted by price direction | Compare volume trend with price trend | Simplifies an entire period into up or down |
| VWAP | Average traded price weighted by volume, usually intraday | Execution benchmark and intraday reference | Resets by session and is not a prediction |
| Delivery data | Quantity or percentage marked for delivery | Compare delivery-related activity with total trading | High delivery does not guarantee accumulation |
| Open interest | Outstanding derivative contracts | Assess participation in futures/options positions | Different from daily trading volume |
Volume Moving Average
A volume moving average places a reference line over volume bars. If current volume is substantially above the line, activity is elevated relative to the selected period.
Do not treat “above average” as automatically bullish. Direction comes from price and context. The average can also be distorted temporarily by one exceptional event.
OBV and Other Cumulative Indicators
On-Balance Volume adds a period’s volume when price closes higher and subtracts it when price closes lower. Analysts often compare the direction of OBV with the direction of price.
A divergence may be worth investigating, but it is not a guaranteed reversal signal. OBV also ignores how large the price change was and reduces the entire period to whether the close was higher or lower.
VWAP Is Not the Same as Volume
VWAP combines price and volume to estimate the average price at which an instrument traded during a session. It is widely used as an execution reference, especially intraday.
It should not be confused with the volume bar itself. Price above or below VWAP can provide context, but VWAP remains derived from historical session data and can lag sharp changes.
Volume, Delivery and Open Interest
Total equity volume can include intraday activity. Delivery data attempts to separate shares resulting in delivery, but a high delivery percentage does not reveal the investor’s motive or guarantee long-term accumulation.
In derivatives, open interest counts positions that remain open, whereas volume counts trading activity during the period. Volume can be high while open interest falls if participants are closing positions. Do not apply an equity-volume interpretation mechanically to futures or options.
The distinction between intraday and delivery activity is explained further in Delivery Trading vs Intraday Trading.
A Practical Volume-Analysis Workflow
Use the following sequence to keep trading volume in stock market analysis subordinate to price structure.
Step 1: Define the Instrument and Timeframe
Confirm whether you are analysing cash-market shares, futures, options, ETFs or an index. Then choose a timeframe that matches your decision. Do not compare a daily volume bar with a weekly average without adjusting the data.
Step 2: Mark Price Structure First
Identify the trend, swing highs and lows, support, resistance and any valid pattern. Volume has meaning only after you know where the price is.
Step 3: Establish Normal Activity
Compare current volume with a relevant recent average and with similar periods. Note whether participation is ordinary, contracting or expanding.
Step 4: Read the Price–Volume Relationship
Ask:
- Is volume expanding with the move or against it?
- Does a pullback occur on lighter activity?
- Is a key level being accepted or rejected?
- Did price close strongly or leave a large wick?
Step 5: Check the Reason for Abnormal Volume
Review exchange filings, company announcements, results, corporate actions and market-wide events. Technical interpretation should not replace basic fact-checking.
Step 6: Wait for Follow-Through
One high-volume candle can be noisy. Observe whether price continues, consolidates constructively, retests the level or reverses sharply.
Step 7: Define Invalidation and Risk
Write down what price behaviour would prove your interpretation wrong. Use position size and order type appropriate to liquidity. A valid volume signal cannot eliminate gap risk or poor execution.
Worked Example: Resistance Break With Volume
Imagine a share has traded between ₹240 support and ₹260 resistance for six weeks. Its 20-session average volume is 8 lakh shares.
It closes at ₹264 on volume of 22 lakh shares.
The evidence is:
- Price closed above a well-tested resistance zone.
- Volume was approximately 2.75 times the recent average.
- The candle closed near its high.
This is stronger than a brief intraday move to ₹264 that closes back at ₹257 on 4 lakh shares. Even so, the high-volume close is not guaranteed to continue. The analyst should still check news, the next resistance area, market direction and whether price holds above the former ₹260 zone.
The correct conclusion is “the breakout has stronger participation”, not “the share must rise.”
Common Volume Mistakes and Important Limitations
Treating Every High-Volume Candle as Bullish
High volume means high activity. If price falls sharply on high volume, selling pressure may be dominant. If price rises but closes with a large upper wick, heavy supply may have absorbed demand.
Reading Green Volume as Pure Buying
Every executed trade has both a buyer and seller. Bar colour usually follows price direction; it does not reveal every participant’s intent.
Comparing Unrelated Stocks by Raw Volume
Share price, free float, liquidity, lot size and normal activity differ. Compare volume with the stock’s history before comparing it with another company.
Ignoring Corporate Actions and Data Adjustments
Stock splits, bonuses and other changes can alter share quantities and historical comparisons. Ensure charts and averages are properly adjusted.
Confusing Volume With Delivery
Heavy trading can include intraday turnover. Delivery percentage is separate and still does not prove whether delivery buyers intend to hold.
Using Volume Without Price Structure
A volume spike in the middle of a noisy range has less analytical value than volume appearing at a recognised support, resistance or pattern boundary.
Assuming Technical Confirmation Removes Risk
Technical analysis uses historical market data. It cannot know future announcements, overnight gaps or changes in liquidity. SEBI cautions investors against unrealistic return claims and unregistered advice. Verify any person offering securities-market recommendations through the official SEBI Intermediary Portal.
For beginners, trading volume in stock market research should answer one disciplined question: does participation support, weaken or complicate the price story already visible on the chart?
Frequently Asked Questions
What Is a Good Trading Volume for a Stock?
There is no universal number. A useful level depends on the company, free float, price, exchange, timeframe and your order size. Compare current activity with the stock’s own recent average and also examine spread and order-book depth.
Is High Volume Bullish or Bearish?
Neither by itself. High volume confirms strong activity. Its meaning depends on whether price is rising, falling, breaking a level, rejecting a level or reacting to an event.
Does Low Volume Mean Nobody Is Buying?
No. Every completed trade has a buyer and a seller. Low volume means fewer shares or contracts changed hands than the chosen comparison, not that one side disappeared.
Can Volume Predict a Breakout?
Volume can support a breakout after price crosses a meaningful boundary, but it cannot guarantee the move or reliably predict direction on its own. Price confirmation, follow-through and invalidation remain necessary.
What Is the Difference Between Volume and Open Interest?
Volume counts trading activity during a period. Open interest counts derivative contracts that remain open. The two measures answer different questions and should not be substituted for each other.
Should Investors Use Volume or Only Traders?
Long-term investors can use volume to understand liquidity, unusual activity and market reaction to information. However, company quality, financial statements, valuation and risk remain central. Start with What Is Fundamental Analysis? if the objective is long-term company analysis.
What Should I Learn After Trading Volume?
The next step is breakout and breakdown confirmation, where volume is combined with price closes, retests, false moves and invalidation. Before that, make sure you can identify trends, support/resistance and valid chart patterns without relying on indicators.
Trading volume becomes powerful when it improves a structured analysis. It becomes dangerous when a single tall bar is treated as a shortcut to certainty.