
Skip to content
Start Learning
HomeRegalTicker LearnTechnical Analysis
Chart Reading Path

Technical Analysis

Learn technical analysis for beginners through an ordered path covering charts, price, volume, trends, levels, patterns, indicators, confirmation and risk.

Market observer studying candlestick trends, support and resistance zones, volume, momentum and breakout confirmation
Beginner Roadmap

Read Market Action in Context

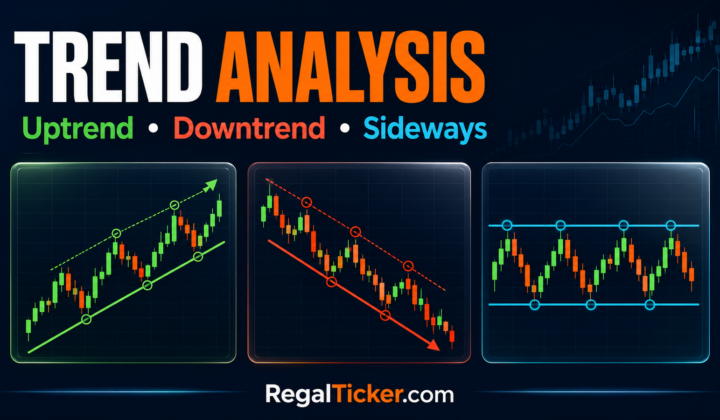
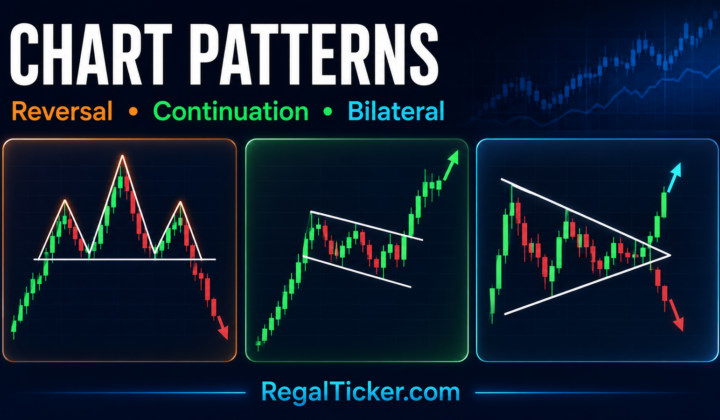
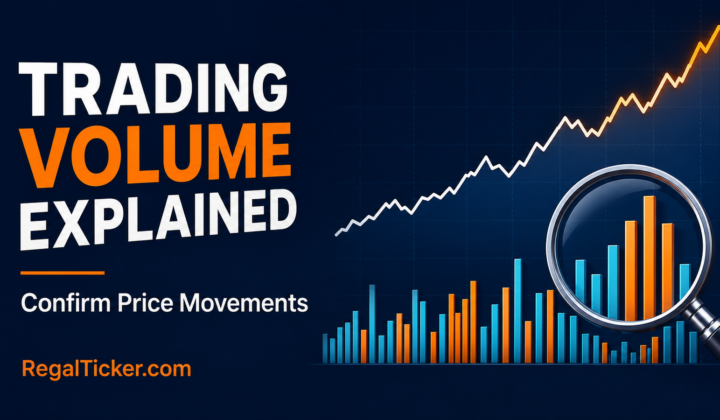
Technical analysis examines market action through price, volume and time. This path begins with chart and candlestick structure, then builds through support and resistance, trends, patterns and volume before introducing moving averages, momentum indicators, breakouts and a complete analysis checklist.

Use the lessons as a decision framework rather than a signal library. Keep the instrument, timeframe and data basis consistent, look for confirmation from more than one form of evidence, define invalidation before acting and connect every setup to risk control. A chart pattern or indicator cannot predict a future price with certainty.

Course Curriculum

Learn in the Recommended Order

Use the recommended learning order, or jump directly to the guide you need.

Relevant Calculators

Test the Setup Before the Trade

Use these calculators after defining an entry, invalidation level and target. They quantify parts of a plan but cannot validate the chart interpretation itself.

Brokerage Calculator

Estimate brokerage and common transaction charges when checking whether trading costs change a setup’s expected break-even outcome. Actual execution can differ.

Open calculator
Newest From This Topic

Latest Article

Primary References

Official Sources

Use official education and exchange data sources to verify concepts and historical price-volume observations. Charts derived from different adjustment methods or timeframes may not match exactly.

Quick Clarifications

Technical Analysis FAQs

Can technical analysis predict the next market move?

No. Technical analysis organises observations about price, volume and market behaviour. It can define scenarios and invalidation points, but every pattern and signal can fail.

Which chart timeframe is best for beginners?

There is no universal best timeframe. Choose one that matches the intended holding period, use it consistently and check a higher timeframe for broader context.

Are support and resistance exact prices?

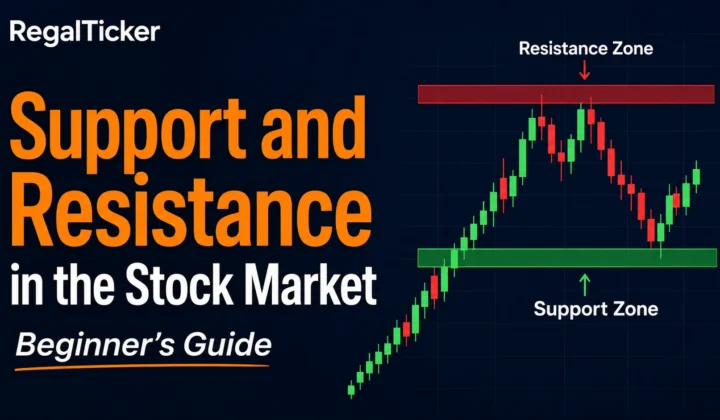
They are usually better treated as zones rather than perfectly precise prices. Reactions can occur around an area, and brief moves beyond it do not always confirm a breakout.

Should an indicator be used by itself?

No indicator should replace context. Trend, price structure, levels, volume, timeframe and risk should be considered together, while avoiding multiple indicators that repeat the same information.