
⚡ Quick answer
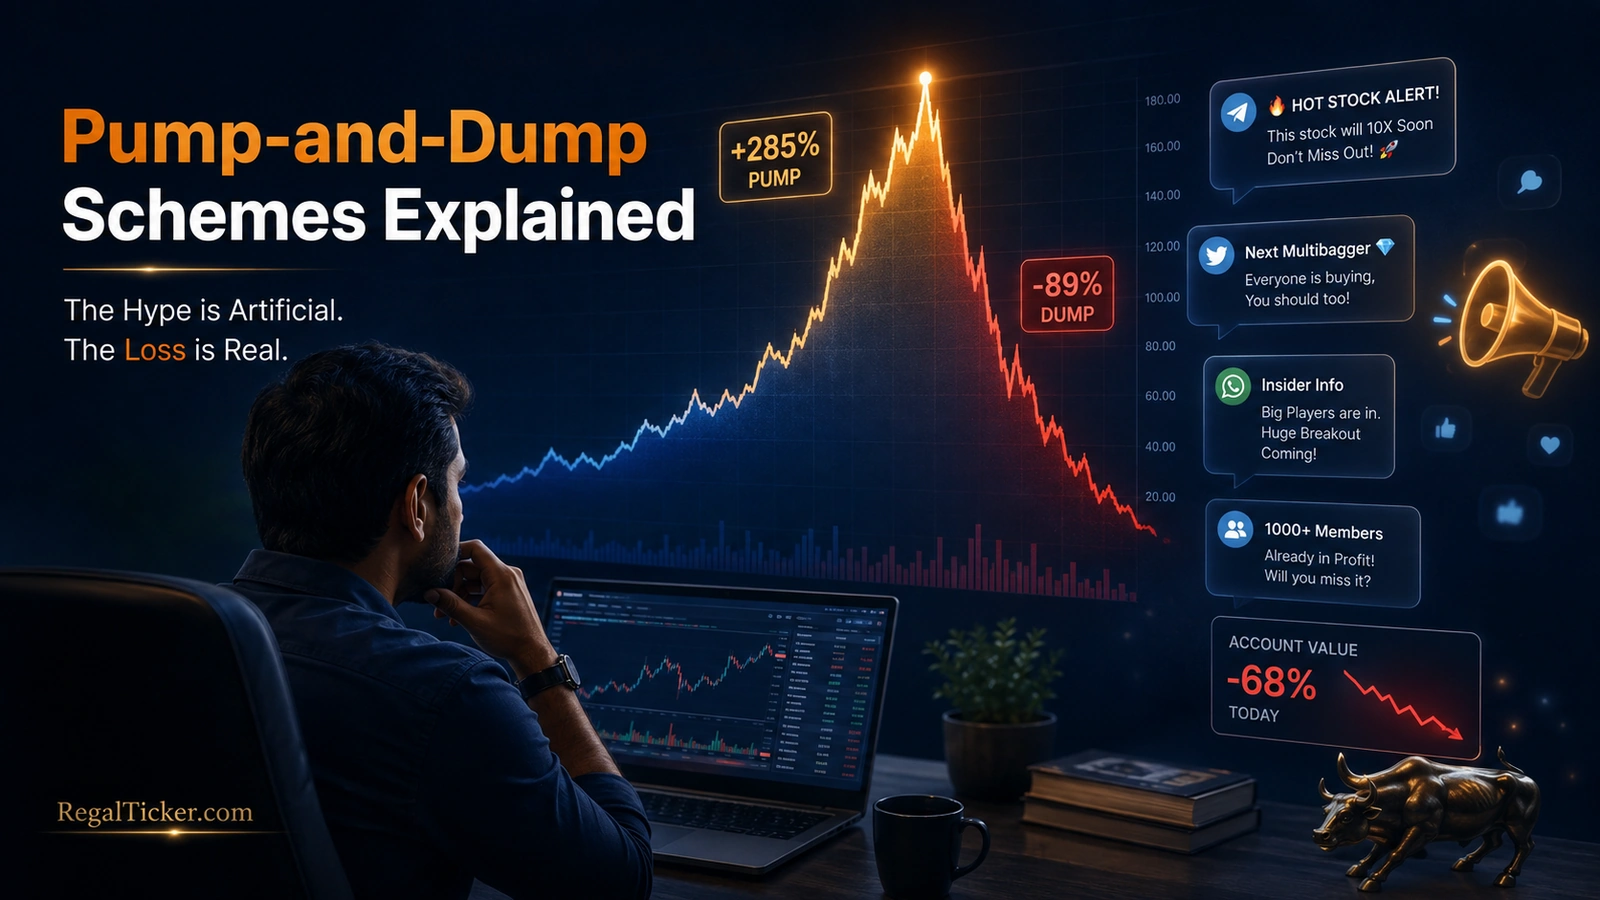
A pump-and-dump scheme is a form of stock-market manipulation in which operators first acquire shares, create artificial interest through misleading promotion or coordinated activity, and then sell their holdings after the price rises. Once the operators exit and promotional demand disappears, the stock may fall sharply, leaving late retail investors with heavy losses and limited liquidity.
Common warning signs include sudden social-media excitement, unusually high volume, repeated upper circuits, vague business announcements, low public liquidity, unrealistic price targets and recommendations from people who do not disclose that they already own the stock.
What Is a Pump-and-Dump Scheme?
A pump-and-dump scheme is a manipulation strategy designed to create artificial demand for a stock.
The people behind the scheme may be promoters, connected traders, social-media operators, tip providers or other beneficiaries. They typically acquire shares before the public promotion begins.
The “pump” is the process of increasing attention, demand and price. The “dump” occurs when the operators sell their holdings into the demand created among outside investors.
The promotion may rely on:
- exaggerated business claims;
- selective financial information;
- fake price targets;
- rumours of major contracts or corporate actions;
- claims of institutional buying;
- coordinated social-media recommendations;
- messaging-group campaigns;
- fabricated profit screenshots;
- repeated statements that the stock will hit upper circuits.
A legitimate company can rise rapidly because its earnings, order book or business outlook improves. A pump-and-dump scheme is different because the price movement is driven by manipulation, misleading promotion or coordinated trading rather than genuine investment merit.
SEBI treats coordinated stock recommendations followed by contrary selling by connected beneficiaries as potentially fraudulent and manipulative conduct. In a May 2026 interim order involving recommendations across multiple social-media platforms, SEBI described evidence relating to 82 scrips and identified prima facie wrongful gains of ₹20.25 crore.
This lesson continues the verification framework explained in How to Identify Stock Market Scams and Investor Safety in the Stock Market.
How a Pump-and-Dump Scheme Works
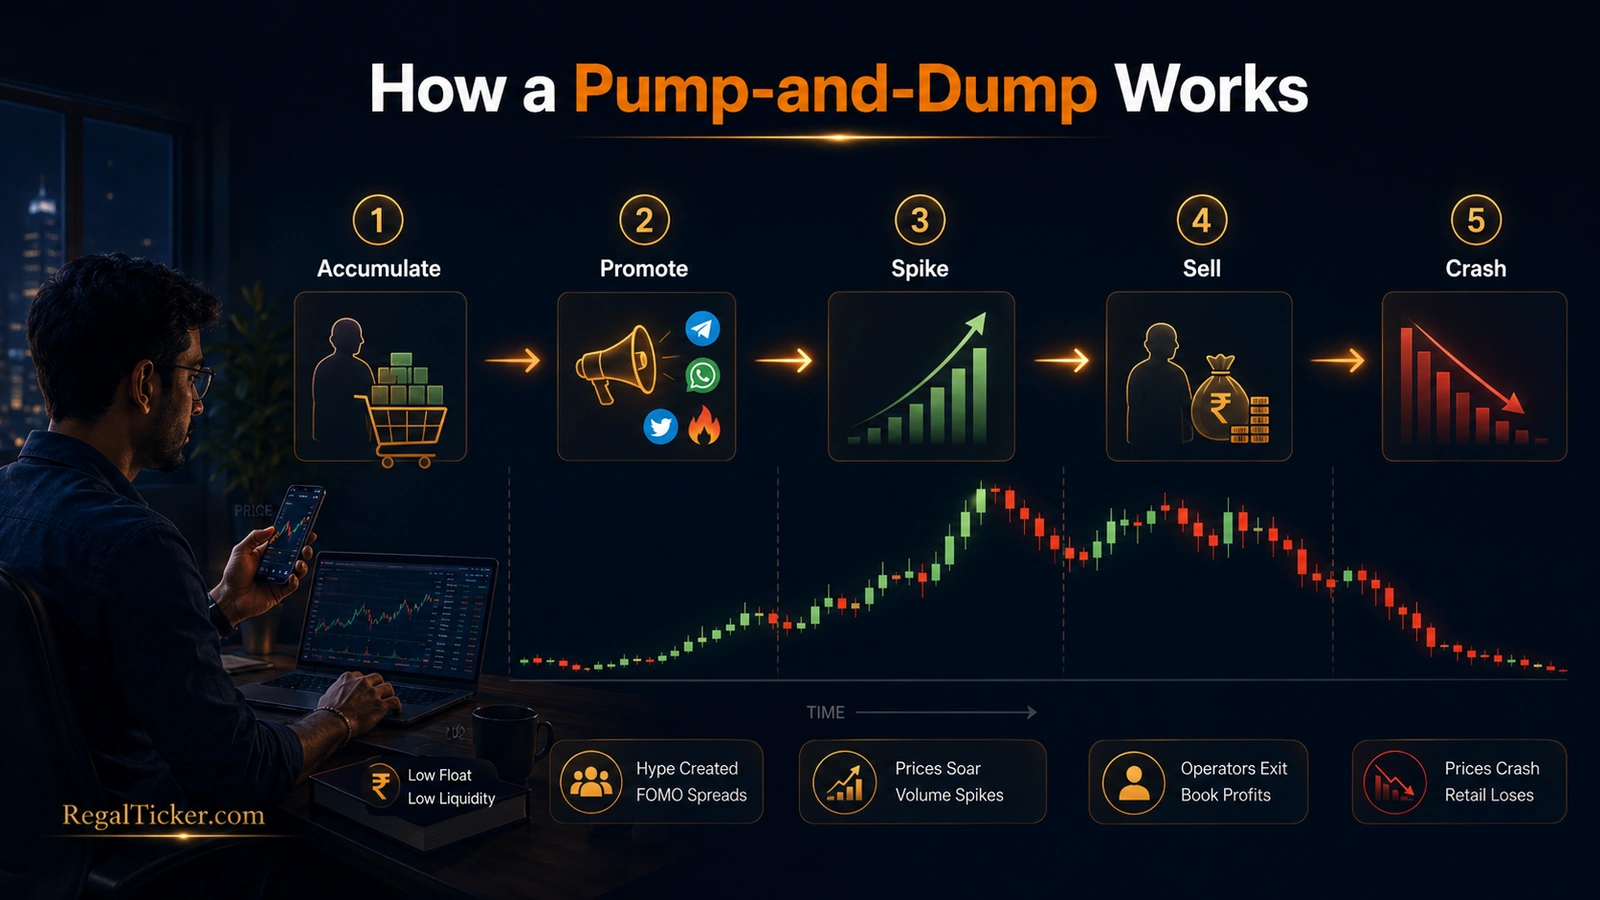
Most pump-and-dump operations follow five broad stages.
Stage 1: Accumulation
The operators quietly acquire shares before the campaign begins.
They may prefer a stock with:
- low daily trading volume;
- limited public shareholding;
- a small market capitalisation;
- a wide bid-ask spread;
- weak analyst coverage;
- low institutional participation.
A relatively small amount of buying can have a larger price impact in an illiquid stock.
Stage 2: Promotion
The stock is promoted through public or private channels.
The promotion may appear on:
- YouTube;
- Instagram;
- X;
- WhatsApp;
- Telegram;
- online forums;
- bulk messages;
- paid newsletters;
- fake research reports.
Promoters often use phrases such as “hidden gem,” “next multibagger,” “operator-backed stock,” “upper circuit candidate” or “institutional accumulation.”
Stage 3: Price and Volume Expansion
New buyers enter because they fear missing the opportunity.
The stock may show:
- rapidly increasing volume;
- consecutive positive sessions;
- upper circuits;
- a breakout above previous resistance;
- large percentage gains from a low base.
The rising price itself becomes part of the advertisement. New investors assume that the movement confirms the original story.
Stage 4: Operator Distribution
The early holders begin selling into the public demand.
This selling may be gradual so that the stock continues to appear strong. Promotional messages may become even more aggressive during this stage.
The public sees a rising chart, while the operators use that liquidity to exit.
Stage 5: Collapse
Once major operators have sold and the promotional campaign weakens, demand can disappear.
The stock may enter repeated lower circuits. Investors who want to exit may find very few buyers.
The loss is not caused only by the falling price. Illiquidity may prevent investors from selling at the displayed market price.
Why Low-Liquidity and SME Stocks Can Be More Vulnerable
Pump-and-dump activity can occur in different market segments, but low-liquidity shares are easier to influence.
Limited Available Supply
When relatively few shares are available for regular trading, coordinated buying can move the price quickly.
Small Order Book
A thin order book may have large gaps between available buy and sell prices. A few orders can create a dramatic chart.
Limited Public Information
Smaller companies may receive less analyst coverage and media scrutiny. Investors may depend heavily on company announcements and social-media interpretations.
Retail FOMO
Large percentage movements attract attention. A stock rising from ₹20 to ₹40 appears to have doubled, even though the underlying business may not have changed meaningfully.
Corporate-Action Excitement
Bonus issues, stock splits, preferential allotments or other announcements can be used to create optimism. The corporate action itself does not automatically improve business value.
SEBI’s SME-segment advisory notes that exaggerated claims may be followed by corporate actions that generate positive sentiment, after which promoters may offload holdings at higher prices. Investors should therefore verify whether the announcement changes the company’s actual earnings capacity or merely changes the share count or market narrative.
How Social Media Amplifies a Pump-and-Dump Campaign
Social media allows a stock story to spread quickly and repeatedly.
Coordinated Posting
Multiple accounts may post the same stock name, target and narrative within a short period.
This creates the impression that many independent analysts have reached the same conclusion.
Selective Performance Screenshots
The promoter may highlight only successful past calls while hiding failed recommendations and deleted posts.
Private VIP Groups
Public posts attract followers, while private groups create exclusivity and urgency.
Members may be told that:
- the stock is being accumulated;
- a major announcement is coming;
- institutions are entering;
- only early buyers will benefit;
- the target must not be shared publicly.
Artificial Social Proof
Fake members or connected accounts may post purchase screenshots and profit updates.
Disappearing Disclosures
The person recommending the stock may not disclose existing holdings, compensation or links with beneficiaries.
SEBI’s April 2025 social-media caution warned investors about deceptive testimonials, fake affiliations, private groups and fraudulent trading or advisory platforms. A recommendation should never be treated as independent merely because it appears across several accounts.

Pump-and-Dump Rally vs Genuine Stock Rally
A rapid rise is not automatically manipulation. Investors should compare the market move with verifiable business evidence.
Genuine Rally
A genuine rally may be supported by:
- higher revenue and profit;
- improved margins;
- a confirmed order or contract;
- debt reduction;
- regulatory approval;
- a credible turnaround;
- industry-wide improvement;
- transparent exchange disclosures.
Even then, the valuation may become excessive. Genuine news does not guarantee that every price is reasonable.
Pump-and-Dump Rally
A suspicious rally may depend on:
- vague rumours;
- social-media targets;
- unexplained volume;
- repeated upper circuits without material disclosures;
- unrelated or low-impact announcements;
- exaggerated interpretation of a stock split or bonus issue;
- aggressive promotion by undisclosed holders.
Use What Is Fundamental Analysis? to examine whether the business performance supports the market story.
Price and Volume Warning Signs
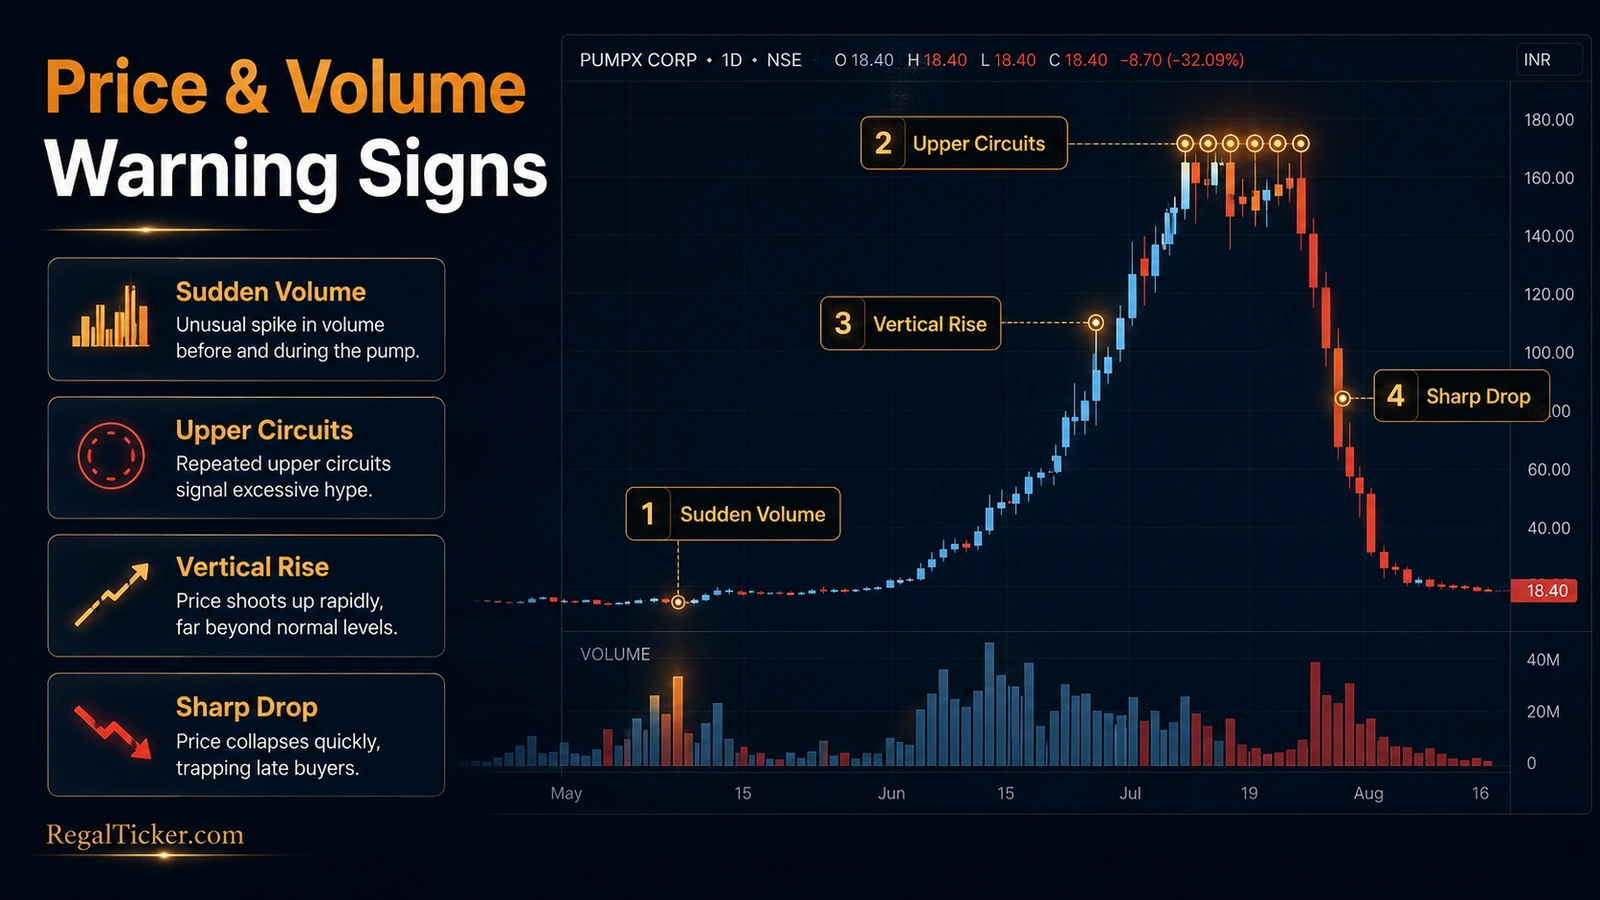
Charts cannot prove manipulation, but they can reveal patterns that require deeper investigation.
Sudden Volume Without Clear News
A sharp increase in volume may indicate genuine information or speculative activity. Check exchange disclosures before assuming the move is justified.
Repeated Upper Circuits
Repeated circuits can create the impression that buying is easy and selling will remain possible.
The real risk appears when the direction reverses and the stock enters lower circuits.
Vertical Price Movement
A near-vertical chart after a long period of inactivity may indicate concentrated buying.
Breakout Followed by Immediate Failure
A promoted stock may move above a visible resistance level and then collapse once distribution begins.
Readers can review Support and Resistance in the Stock Market to understand why a breakout alone is not proof of investment quality.
Large Intraday Reversals
A stock that rises sharply and closes weak may be experiencing heavy selling into public demand.
Widening Bid-Ask Spread
A wide spread is a sign of weak liquidity. The displayed last-traded price may not represent the price at which a large position can actually be sold.
Price Rise Without Earnings Support
Compare the chart with revenue, profit, cash flow and debt. A rising price cannot permanently replace business performance.
How to Read Candlestick Charts can help identify price behaviour, but technical patterns must be combined with disclosure and fundamental checks.
Fundamental and Disclosure Warning Signs
Investors should look beyond the price chart.
Vague Business Announcements
Statements such as “exploring opportunities,” “planning expansion” or “considering strategic initiatives” may sound positive without creating measurable value.
Frequent Changes in Business Direction
A company that repeatedly moves into fashionable sectors may be using market themes to attract attention.
Weak Cash Flow
Reported profit should be compared with operating cash flow. Persistent differences require investigation.
High Related-Party Activity
Large transactions with connected parties can make the business harder to evaluate.
Promoter Selling or Pledging
Check whether promoters are reducing holdings or increasing pledges while public excitement grows.
Auditor or Governance Concerns
Auditor resignations, delayed results, qualifications, regulatory actions and repeated compliance issues should not be ignored.
Corporate Actions Without Business Improvement
A bonus issue or stock split changes the number of shares but does not automatically create operating profit.
A rights issue or preferential allotment should be examined for purpose, pricing and beneficiary details.
How Operators Profit and Retail Investors Lose
The operator’s advantage is timing and information.
The operator may:
- buy before the campaign;
- know when promotion will begin;
- influence the promotional narrative;
- sell while public demand is strongest;
- stop supporting the stock after exiting.
The late investor may:
- discover the stock after a large rise;
- buy because of FOMO;
- assume the promoter’s target is reliable;
- ignore liquidity risk;
- hold through lower circuits;
- average down without re-evaluating manipulation risk.
A falling price does not make a manipulated stock automatically cheap. Price is meaningful only when the underlying business and available information can support valuation.
Pump-and-Dump Example With Numbers
Assume an operator accumulates 100,000 shares at an average price of ₹20.
The initial cost is:
100,000 × ₹20 = ₹20,00,000
After a promotional campaign, the price rises to ₹55.
If the operator sells the full position at an average price of ₹50, the proceeds are:
100,000 × ₹50 = ₹50,00,000
The gross gain before charges is:
₹50,00,000 − ₹20,00,000 = ₹30,00,000
The percentage return is:
(₹30 ÷ ₹20) × 100 = 150%
Use the Regal Ticker Stock Return Calculator to test the percentage gain shown in promotional screenshots.
Now assume a retail investor buys 1,000 shares at ₹50 and the price later falls to ₹15.
The investment falls from ₹50,000 to ₹15,000, producing an unrealised loss of ₹35,000 or 70%.
If the stock is locked in lower circuits, the investor may not be able to sell immediately even at ₹15.
What to Check Before Buying a Promoted Stock
Use a repeatable verification process.
Identify the Original Source
Ask who first recommended the stock and whether that person is registered for the service being offered.
Read Exchange Disclosures
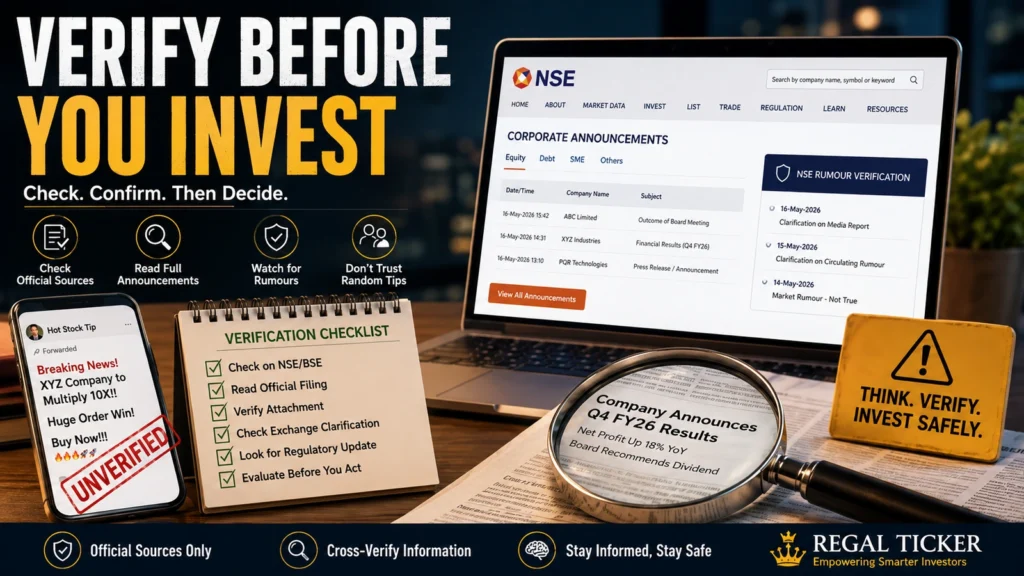
Do not rely on screenshots or summaries. Read the company’s actual announcements.
Compare Price With Business Performance
Check whether revenue, profit, cash flow and debt justify the movement.
Check Shareholding Changes
Review promoter holdings, pledges and recent allotments.
Review Liquidity
Examine daily volume, delivery activity, bid-ask spread and circuit history.
Calculate Position Risk
Before entering, use the Risk–Reward Calculator to compare the planned entry, stop-loss and target.
A calculated ratio does not make a manipulated stock safe, but it prevents an undefined-risk trade.
Avoid Oversized Positions
Apply the position-control principles in Risk Management in the Stock Market.
Delay the Decision
A stock that requires immediate action is often being sold through urgency rather than analysis.
Should You Average Down After the Stock Crashes?
Averaging down reduces the mathematical average purchase price, but it increases the amount exposed to the company.
Use the Stock Average Calculator to see the new average price before adding more shares.
However, do not confuse a lower average with lower risk.
Before averaging, ask:
- Was the original recommendation manipulated?
- Has the business deteriorated?
- Is the stock liquid enough to exit?
- Have promoters or connected parties sold?
- Are the disclosures reliable?
- Would you buy the stock today without considering the earlier purchase?
If the investment thesis came only from social-media promotion, adding more money may deepen the loss rather than repair it.
What to Do If You Are Trapped in a Manipulated Stock
Stop Following the Promoter’s Targets
The same person who encouraged the purchase may continue raising targets to prevent followers from selling.
Preserve Evidence
Save messages, videos, group links, screenshots, payment records and recommendation dates.
Review Official Disclosures
Separate verified company information from promotional claims.
Assess Liquidity
Determine whether an exit is possible and avoid placing impulsive orders without understanding circuit limits and the order book.
Avoid Recovery Scams
Do not pay another person who promises to recover the loss through a special trade or managed account.
Report Suspicious Conduct
Potential manipulation, unregistered advice or fraudulent promotion may be reported through relevant SEBI, exchange and cybercrime channels depending on the facts.
Do not publicly accuse a company or individual without evidence. Preserve records and use official reporting mechanisms.
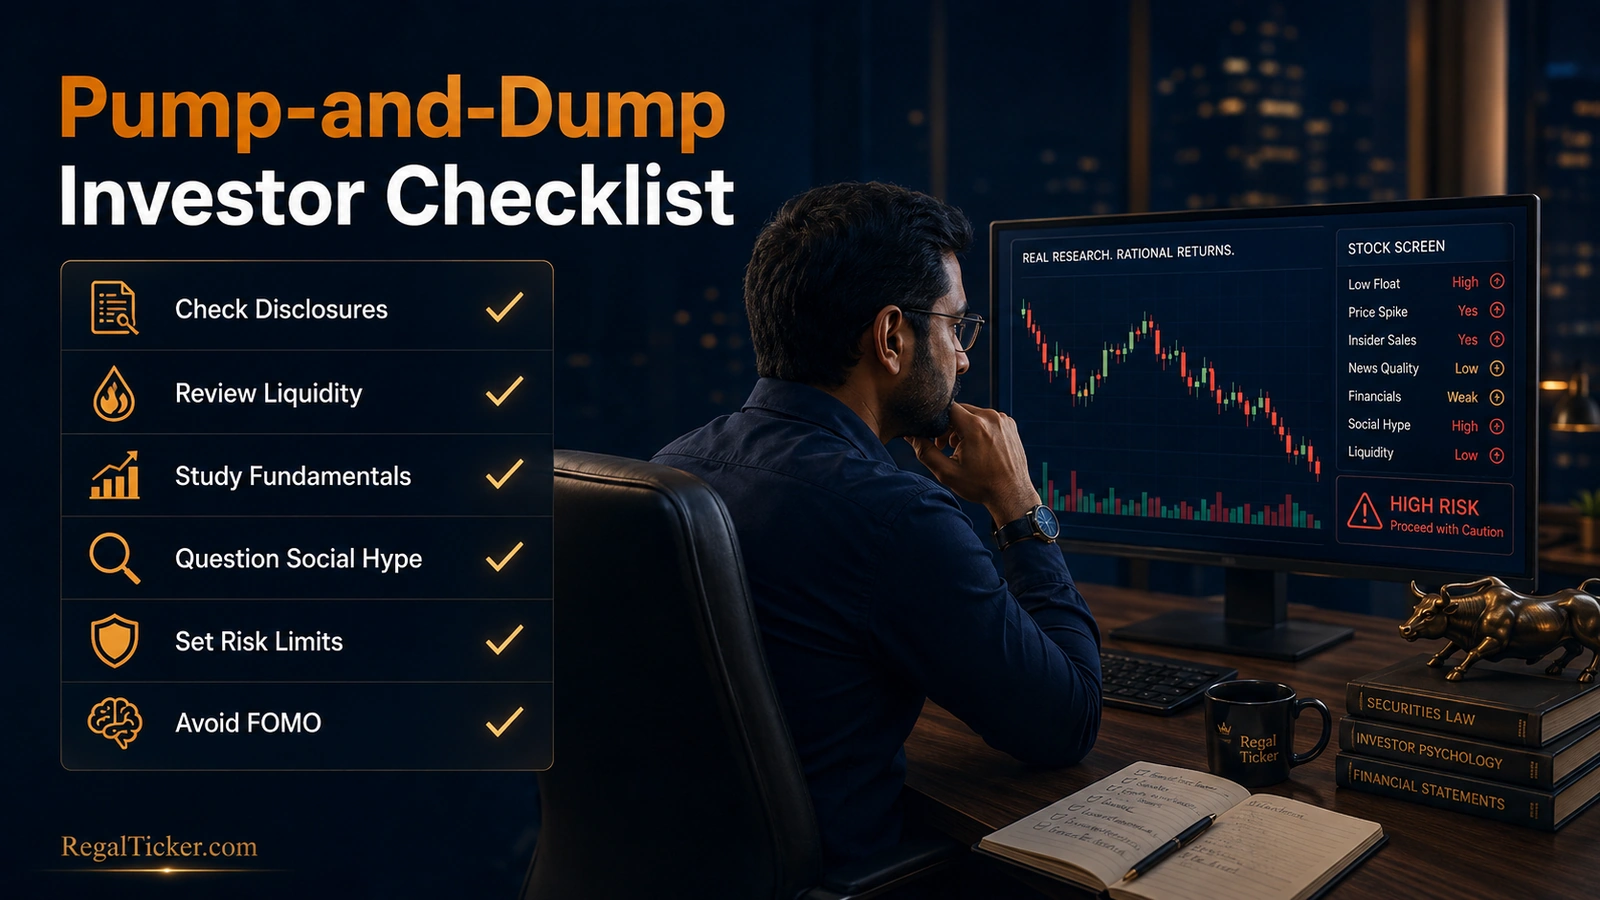
Pump-and-Dump Investor Checklist
Before buying a rapidly promoted stock, confirm:
- I know who is recommending the stock.
- I have checked whether the adviser or analyst is registered.
- I have read the original exchange disclosures.
- I can explain how the company earns money.
- Revenue and profit support the story.
- Cash flow does not contradict reported profit.
- Promoters are not quietly reducing holdings.
- The stock has sufficient liquidity.
- The price rise is not based only on social media.
- The recommendation includes risk, not only targets.
- I have checked the entry, stop-loss and position size.
- I am not buying because of upper circuits or FOMO.
- I understand that a stock split or bonus issue does not create operating value.
- I will not share credentials or transfer money to a tip provider.
- I can afford the potential loss.
The Regal Ticker Investor Tools hub contains calculators that can help test return, average-price and risk assumptions before acting.
Final Takeaway
A pump-and-dump scheme succeeds by turning attention into liquidity for early operators.
The stock is accumulated first, promoted second and sold to late buyers third. Once the artificial demand disappears, the price can collapse and liquidity can vanish.
Investors should not assume that every fast-rising small-cap or SME stock is manipulated. The correct response is verification:
- compare the price movement with business performance;
- read official disclosures;
- examine liquidity and shareholding;
- question social-media urgency;
- calculate return and position risk;
- avoid averaging down without a fresh thesis;
- report suspicious conduct through official channels.
The most dangerous point is often not the first rise. It is the moment when a rising chart convinces the investor to stop asking questions.
Frequently asked questions
What is a pump-and-dump scheme?
It is a manipulation scheme in which operators accumulate a stock, promote it to create demand, sell their holdings at higher prices and leave late investors exposed to the subsequent fall.
Are pump-and-dump schemes illegal in India?
Fraudulent and manipulative trading practices can violate securities laws and SEBI regulations. The legal conclusion depends on evidence and the facts of each case.
Are all upper-circuit stocks pump-and-dump schemes?
No. A stock may hit upper circuits because of genuine demand or material information. Investors should compare the movement with verified disclosures, business performance and liquidity.
Why are low-liquidity stocks easier to manipulate?
When relatively few shares are available and the order book is thin, a smaller amount of coordinated buying can create a larger price movement.
Can technical analysis identify a pump-and-dump scheme?
Charts and volume can reveal warning signs, but they cannot prove manipulation. Investors must also check fundamentals, disclosures, shareholding and the source of the promotion.
Should I average down after a manipulated stock crashes?
Averaging down increases exposure. Reassess the business, liquidity and original investment thesis before adding money. A lower average price does not remove manipulation or governance risk.
How do pump-and-dump operators use social media?
They may coordinate posts, create private groups, show selective profits, use fake testimonials and circulate unrealistic targets to manufacture demand.
What should I do if I suspect stock manipulation?
Preserve evidence, stop acting on the promoter’s messages, review official disclosures and report suspicious conduct through the applicable SEBI, exchange or cybercrime channels.
Verify through official sources
Official references
- 1. SEBI Investor — Pump and Dump Scam
- investor.sebi.gov.in/pump-and-dump-scam.html
- 2. SEBI — Interim Order in the Matter of Trading in Certain Scrips through Stock Recommendations Given on Social Media Platforms, May 2026
- www.sebi.gov.in/sebi_data/attachdocs/may-2026/ORDER_1779429679.pdf
- 3. SEBI — Caution to Public Against Fraudulent or Manipulative Activities on Social Media Platforms, April 2025
- www.sebi.gov.in/sebi_data/attachdocs/may-2025/1746621138080.pdf
- 4. SEBI Investor — Advisory Regarding Investment in Companies Listed on the SME Segment
- investor.sebi.gov.in/advisory-investment-in-sme-segment.html
- 5. SEBI Investor — How to Spot a Scam
- investor.sebi.gov.in/spot-any-scam.html
- 6. NSE India — Advisory for Investors
- www.nseindia.com/invest/advisory-for-investors
Educational disclaimer: This article is for education and general information only. It does not provide investment, legal, trading or financial advice. A rapid price rise, high volume or social-media promotion does not by itself prove manipulation. Investors should verify company disclosures, intermediary registration, liquidity and business fundamentals independently before acting. Suspected misconduct should be reported through appropriate official channels.