Two companies may report the same profit but still be very different investments. One may earn that profit with a modest amount of capital and little debt. The other may need heavy borrowing, repeated capital expenditure and a much larger equity base.
Profit alone does not reveal this difference.
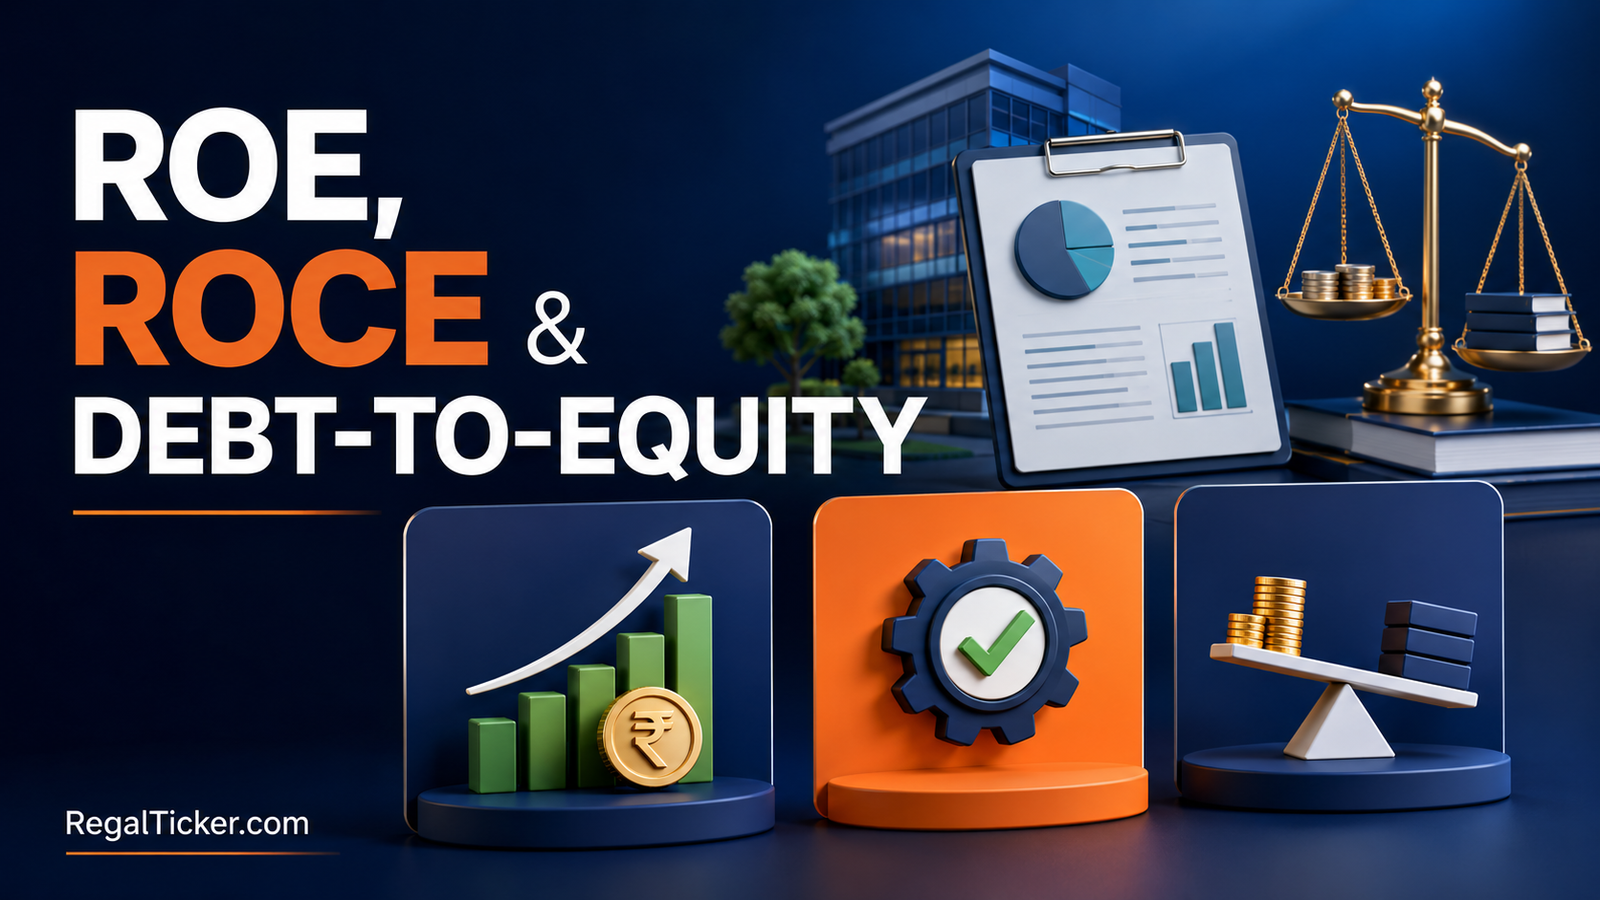
Return on equity (ROE), return on capital employed (ROCE) and the debt-to-equity ratio help investors examine three connected questions:
- How efficiently is the company using shareholders’ money?
- How efficiently is the business using its total long-term capital?
- How much debt is supporting—or inflating—those returns?
These ratios are most useful when they are studied together, compared across several years and checked against similar businesses. No single ratio should be treated as an automatic buy or sell signal.
Quick Answer
| Ratio | Main question | Basic formula |
|---|---|---|
| ROE | What return is the company generating for equity shareholders? | Profit after tax ÷ Average shareholders’ equity × 100 |
| ROCE | What operating return is the business generating from long-term capital? | EBIT ÷ Average capital employed × 100 |
| Debt-to-equity | How much interest-bearing debt supports each rupee of equity? | Interest-bearing debt ÷ Shareholders’ equity |
The key is not simply to search for the highest number. A strong-looking ROE supported by rising debt and weak cash flow may be less attractive than a slightly lower but more sustainable return.
What Is Return on Equity?
Return on equity (ROE) measures the profit attributable to equity shareholders relative to the equity invested in the business.
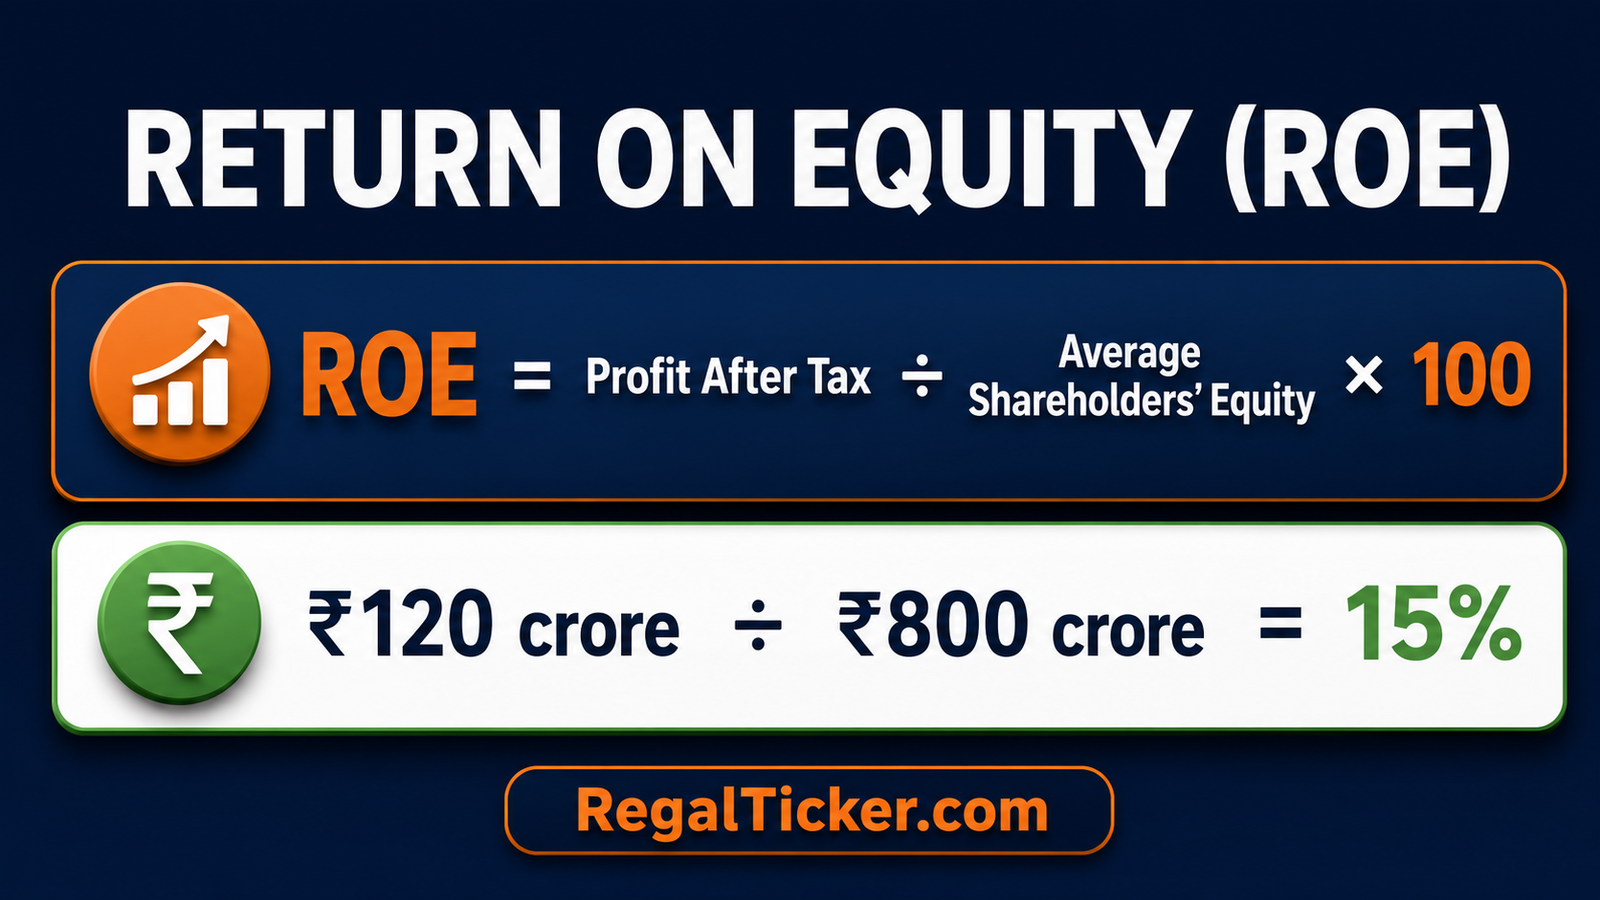
ROE = Profit after tax attributable to ordinary shareholders ÷ Average shareholders’ equity × 100
Suppose a company reports:
- Profit after tax: ₹120 crore
- Opening shareholders’ equity: ₹700 crore
- Closing shareholders’ equity: ₹900 crore
Average shareholders’ equity is:
(₹700 crore + ₹900 crore) ÷ 2 = ₹800 crore
Therefore:
ROE = ₹120 crore ÷ ₹800 crore × 100 = 15%
This means the company generated ₹15 of annual profit for every ₹100 of average shareholders’ equity during the period.
Why Average Shareholders’ Equity Is Better
Profit is earned throughout the year, while the balance sheet shows equity at a particular date. Using only closing equity may distort the ratio if the company issued shares, completed a large buyback, paid an exceptional dividend or experienced a major change in reserves during the year.
Average equity normally provides a better match:
Average equity = (Opening equity + Closing equity) ÷ 2
For a company with large intra-year changes, an analyst may use quarterly averages when reliable data is available.
To understand where shareholders’ equity appears, read How to Read a Balance Sheet. To understand the profit used in the numerator, revisit How to Read an Income Statement and Revenue, Profit and Profit Margins Explained.
How to Interpret ROE
A healthy and consistent ROE may indicate:
- Strong profitability
- Efficient use of shareholders’ funds
- A durable competitive advantage
- Disciplined reinvestment
- An asset-light business model
However, a high ROE is not automatically good.
High debt can lift ROE
Borrowing allows a company to operate with less equity. If borrowed money produces returns above its cost, ROE may rise. But the same leverage also increases interest obligations and financial risk.
A small equity base can distort ROE
Accumulated losses, large buybacks or exceptional distributions can reduce book equity. Dividing profit by a very small denominator can produce an unusually high ROE that does not reflect superior operating performance.
One-off profit can temporarily inflate ROE
A gain from selling land, an investment or a subsidiary may raise profit for one year. Investors should separate recurring business earnings from exceptional items.
Negative equity makes ROE difficult to interpret
If shareholders’ equity is negative, the usual ROE calculation may produce a number that is mathematically possible but economically misleading.
What Is Return on Capital Employed?
Return on capital employed (ROCE) measures operating profit relative to the long-term capital employed in a business.
ROCE = EBIT ÷ Average capital employed × 100
EBIT means earnings before interest and tax. It focuses on operating earnings before the effect of financing costs and tax.
Capital employed is commonly calculated in either of these ways:
Capital employed = Total assets − Current liabilities
or
Capital employed = Shareholders’ equity + Long-term interest-bearing debt
The two approaches may not always produce exactly the same answer because analysts can classify cash, lease liabilities, short-term borrowings and non-operating assets differently. The important rule is to use a clearly stated and consistent method.
Simple ROCE example
Suppose a company has:
- EBIT: ₹180 crore
- Average capital employed: ₹1,200 crore
ROCE = ₹180 crore ÷ ₹1,200 crore × 100 = 15%
The business generated an operating return of 15% on the long-term capital employed during the period.
Why ROCE Matters
ROCE is particularly helpful when analysing capital-intensive businesses such as manufacturing, utilities, cement, telecom and infrastructure. These companies may require large investments in plants, machinery, networks or working capital.
A business can report growing profits while producing weak returns if it must continually invest a disproportionate amount of new capital. ROCE helps reveal whether growth is creating economic value efficiently.
Investors should examine:
- Whether ROCE is stable or improving over five to ten years
- Whether the business maintains its ROCE during weak industry conditions
- Whether expansion projects eventually improve operating profit
- Whether high ROCE depends on underinvestment
- Whether acquisitions have increased capital without generating adequate returns
ROE vs ROCE: What Is the Difference?
ROE and ROCE are related, but they do not answer the same question.
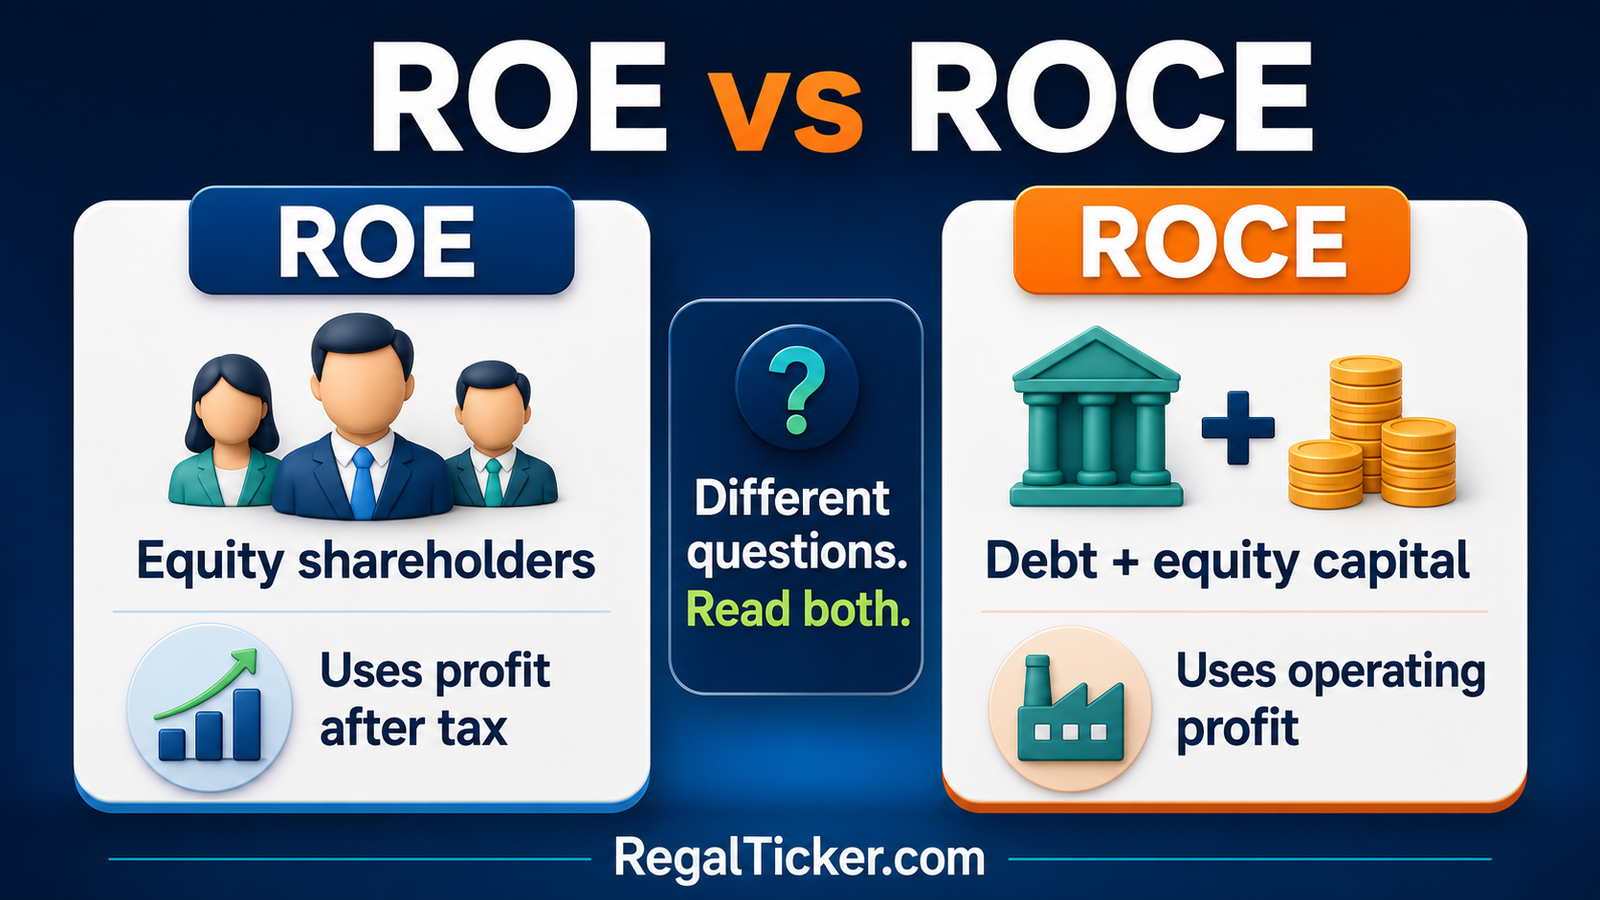
| Factor | ROE | ROCE |
|---|---|---|
| Return measured | Return available to equity shareholders | Operating return generated by long-term capital |
| Profit measure | Usually profit after tax | Usually EBIT |
| Capital base | Shareholders’ equity | Debt plus equity capital employed |
| Financing effect | Directly affected by interest and leverage | Examines operations before interest |
| Best use | Shareholder return and equity efficiency | Business-level capital efficiency |
If a company has little debt, ROE and ROCE may move in a broadly similar direction. In a highly leveraged company, ROE can look strong even when ROCE is ordinary.
A useful comparison signal
If ROE rises while ROCE remains flat and debt increases, leverage may be doing more work than the underlying business.
If ROCE improves, debt remains manageable and operating cash flow strengthens, the improvement is more likely to reflect better operating economics.
Profitability is still different from valuation. A high-quality business can be a poor investment at an excessive price. Read EPS, P/E Ratio and PEG Ratio Explained before moving to the next lesson on book value and enterprise value.
What Is the Debt-to-Equity Ratio?
The debt-to-equity ratio, or D/E ratio, compares a company’s interest-bearing debt with shareholders’ equity.
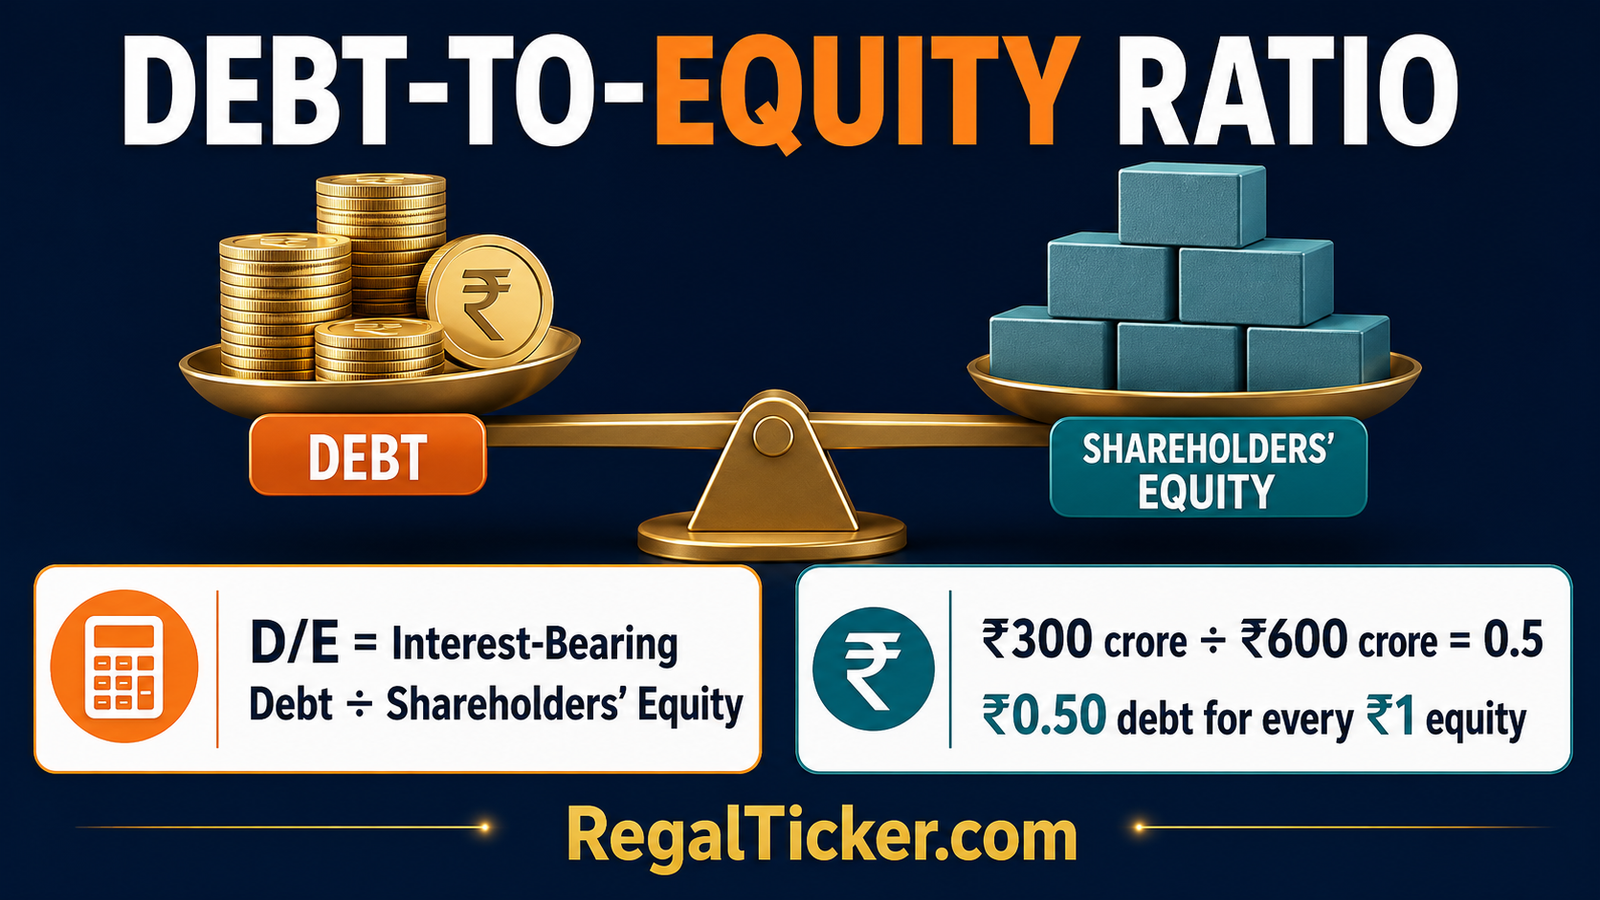
Debt-to-equity ratio = Total interest-bearing debt ÷ Shareholders’ equity
Suppose a company has:
- Interest-bearing debt: ₹300 crore
- Shareholders’ equity: ₹600 crore
D/E = ₹300 crore ÷ ₹600 crore = 0.5
The company has ₹0.50 of debt for every ₹1 of shareholders’ equity under this definition.
What Should Count as Debt?
Investors must check the definition used by the company or data provider. A practical gross-debt calculation may include:
- Short-term borrowings
- Current maturities of long-term debt
- Non-current borrowings
- Debentures and other interest-bearing obligations
- Lease liabilities, when material
Trade payables are normally operating liabilities rather than borrowings. However, unusually stretched supplier payments can still signal financial pressure.
Some analysts use net debt, which subtracts eligible cash and cash equivalents from gross debt:
Net debt = Gross debt − Cash and cash equivalents
Cash should not be deducted blindly. Restricted cash, customer funds or cash essential for daily operations may not be available to repay lenders.
What Is a Good Debt-to-Equity Ratio?
There is no universal good D/E ratio.
An acceptable level depends on:
- Industry economics
- Stability of cash flow
- Interest rates
- Debt maturity schedule
- Currency exposure
- Asset quality
- Business cycle
- Management’s capital-allocation policy
A regulated utility with predictable cash flow may safely carry more debt than a cyclical commodity company. Banks and non-banking financial companies use borrowing as part of their operating model, so their leverage should not be compared mechanically with that of manufacturers or software companies.
Peer comparison is useful only when the companies have similar businesses and the ratio definitions are consistent.
Debt-to-Equity Is Not Enough
Debt-to-equity shows the balance-sheet relationship between debt and equity, but it does not show whether the company can comfortably pay interest or repay principal.
Investors should also examine:
- Interest-coverage ratio
- Operating cash flow
- Free cash flow
- Debt-to-EBITDA
- Repayment schedule
- Fixed versus floating interest rates
- Secured versus unsecured debt
- Foreign-currency borrowings
- Loan covenants
Accounting profit does not repay debt; cash does. How to Read a Cash Flow Statement explains the difference between profit and cash generation. How the Three Financial Statements Are Connected shows how borrowing, interest expense, profit and cash move through the accounts.
How to Read ROE, ROCE and Debt-to-Equity Together
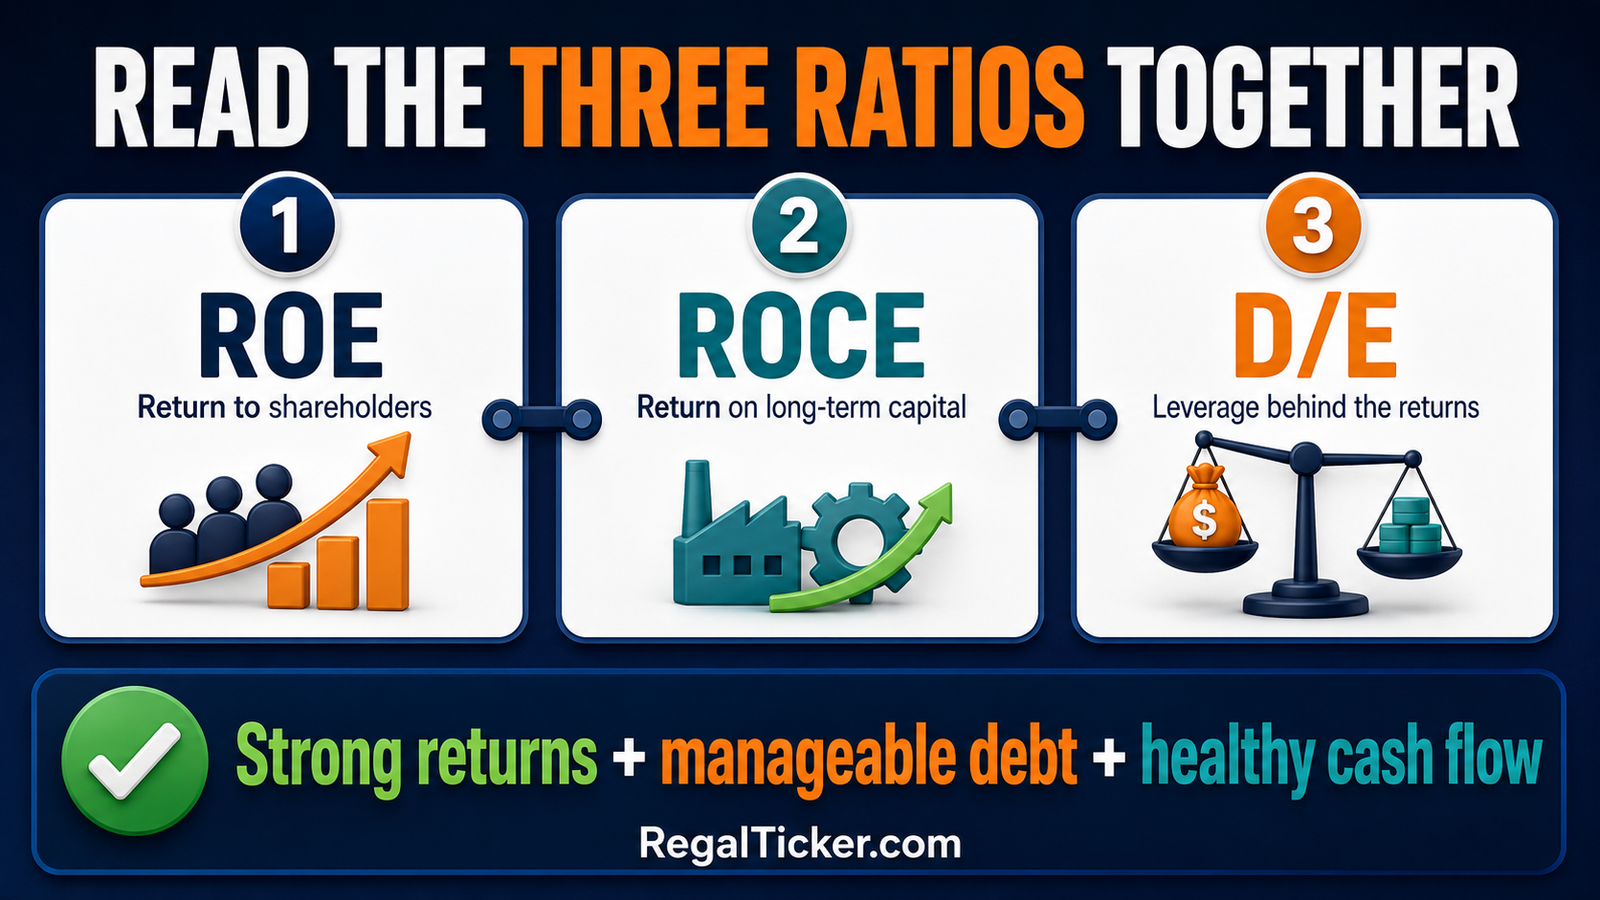
Use the ratios as a connected diagnostic rather than three independent scores.
Step 1: Examine shareholder returns
Check whether ROE is healthy, consistent and supported by recurring profit. Investigate any sudden jump.
Step 2: Examine operating capital efficiency
Compare ROCE across several years. Ask whether the core business is earning more from each rupee of long-term capital.
Step 3: Examine the leverage behind the returns
Check whether debt is stable, falling or rising. Study interest cost, maturity and cash-flow coverage.
Step 4: Compare the trend
A single year may reflect an economic rebound, commodity-price spike, acquisition, impairment or asset sale. A five- to ten-year history is more informative.
Step 5: Compare with suitable peers
Compare companies in the same sector and use consistent definitions. Even then, consider differences in product mix, asset ownership, geography and accounting choices.
Worked Comparison: Company A vs Company B
Assume two companies report the following ratios:
| Measure | Company A | Company B |
|---|---|---|
| ROE | 18% | 18% |
| ROCE | 17% | 9% |
| Debt-to-equity | 0.2 | 1.4 |
| Operating cash-flow trend | Stable | Weakening |
Both companies have the same ROE, but the quality of that return may be different.
Company A produces an ROCE close to its ROE, carries modest debt and generates stable cash flow. Company B produces much lower operating returns, uses substantially more debt and has weakening cash generation.
Company B’s leverage may be magnifying the return to equity holders. That does not automatically make it a bad business, but it clearly adds risk and demands deeper investigation.
Common Red Flags
- ROE rises sharply because equity fell after accumulated losses.
- ROE improves while ROCE stagnates and debt increases.
- ROCE rises because essential capital expenditure has been postponed.
- Debt grows faster than revenue, EBIT and operating cash flow.
- Interest expense rises much faster than operating profit.
- Short-term borrowing funds long-term projects.
- Management highlights adjusted ratios without reconciling them to reported numbers.
- A single strong year is presented as a permanent improvement.
- Cash flow repeatedly remains far below accounting profit.
- Ratios are compared across unrelated industries.
Where to Find the Numbers
Use the company’s:
- Audited annual report
- Consolidated financial statements
- Notes to accounts
- Quarterly and annual exchange filings
- Borrowing and lease-liability notes
- Statement of changes in equity
- Cash-flow statement
The SEBI Investor website offers investor-education material, while company filings on the stock exchanges provide the underlying disclosures. Always verify figures against the original financial statements rather than relying entirely on a summary website.
You can also use the Regal Ticker Investor Tools for calculation support, but the result is only as reliable as the inputs and definitions used.
Frequently Asked Questions
Is higher ROE always better?
No. A higher ROE can result from better profitability, but it can also come from high debt, unusually low equity or one-off profit. Study ROCE, leverage and cash flow before drawing a conclusion.
Is ROCE always better than ROE?
No. ROCE and ROE answer different questions. ROCE examines the operating return on long-term capital, while ROE focuses on the return generated for equity shareholders.
Can ROE be negative?
Yes. ROE can be negative when the company reports a loss. It can also become difficult to interpret when shareholders’ equity is negative.
Can ROCE be negative?
Yes. Negative EBIT can result in negative ROCE, indicating that operations did not generate a positive return on capital during the period.
Is zero debt always ideal?
No. Sensible debt can help finance productive growth. Investors should examine its cost, maturity, covenants and cash-flow coverage rather than assuming that all borrowing is harmful.
Should banks be judged using debt-to-equity?
Not in the same way as ordinary industrial companies. Borrowing is central to a bank’s business model, so banking analysis uses sector-specific measures such as capital adequacy, asset quality, margins and return ratios.
Final Takeaway
ROE shows the return generated for shareholders. ROCE shows how efficiently the broader business uses long-term capital. Debt-to-equity shows the leverage sitting behind those returns.
The most useful combination is not simply “high ROE, high ROCE and low debt.” Investors should look for sustainable returns, sensible financing, sound cash generation and consistency across a full business cycle.
Next, read Book Value, P/B Ratio, Enterprise Value and EV/EBITDA to move from business quality and leverage to valuation.
This article is for investor education only and is not investment advice.