

Two shares can trade at the same price and still represent companies with completely different values. One company may own valuable assets and carry little debt. Another may have a similar market capitalisation but also have heavy borrowings, surplus cash, intangible assets or very different operating earnings.
That is why investors need more than the share price.
Book value and the price-to-book ratio examine what equity investors are paying relative to the company’s accounting net worth. Enterprise value and EV/EBITDA examine the value of the whole operating business relative to an operating-earnings measure.
These measures are useful, but none of them can decide whether a stock is cheap or expensive on its own. They work best when compared with suitable peers, the company’s own history, asset quality, profitability, debt and cash flow.
Quick Answer
| Measure | What it represents | Basic formula |
|---|---|---|
| Book value | Accounting value attributable to shareholders | Total assets − Total liabilities |
| Book value per share | Book value attributable to each outstanding equity share | Equity attributable to ordinary shareholders ÷ Outstanding ordinary shares |
| P/B ratio | Price paid for each rupee of book value | Market price per share ÷ Book value per share |
| Enterprise value | Approximate market value of the whole operating business | Market capitalisation + Debt − Cash |
| EV/EBITDA | Enterprise value relative to operating earnings before interest, tax, depreciation and amortisation | Enterprise value ÷ EBITDA |
The most important distinction is this:
- P/B is an equity-value ratio.
- EV/EBITDA is a whole-business valuation ratio.
What Is Book Value?
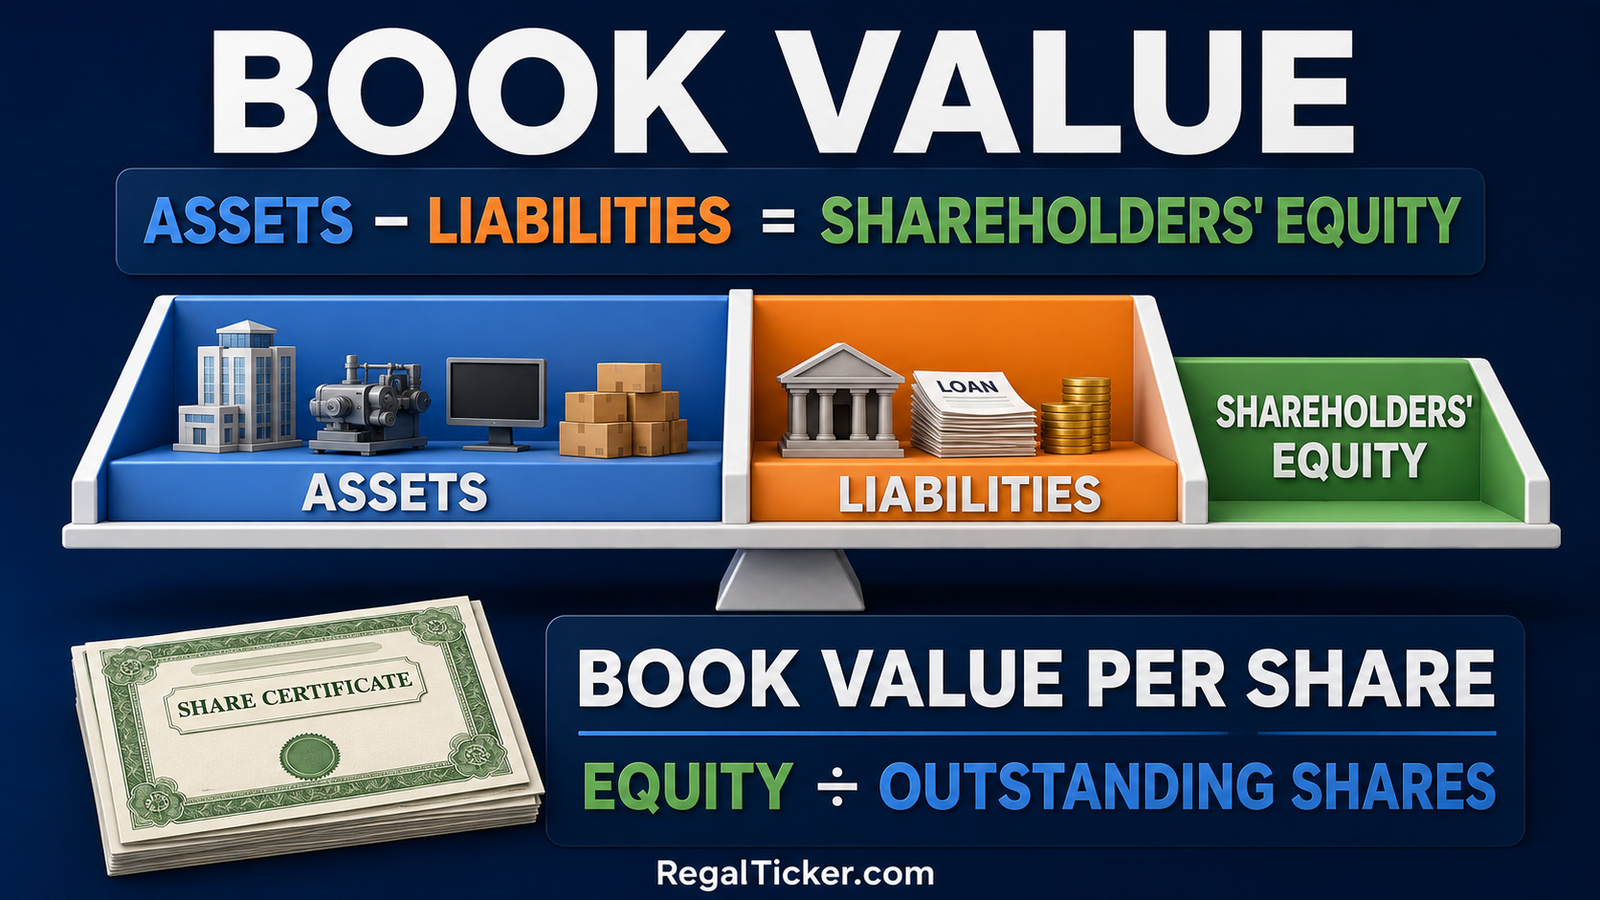
Book value is the accounting value of the company’s net assets attributable to shareholders.
At its simplest:
Book value = Total assets − Total liabilities
The same amount usually appears within shareholders’ equity or net worth on the balance sheet, subject to the exact line items and the class of shareholder being analysed.
Suppose a company reports:
- Total assets: ₹1,500 crore
- Total liabilities: ₹900 crore
Its accounting book value is:
₹1,500 crore − ₹900 crore = ₹600 crore
This ₹600 crore is not necessarily the amount shareholders would receive if the company closed today. It is an accounting measure based on recorded values, not a guaranteed liquidation value or current market value.
What Is Book Value Per Share?
Book value per share, or BVPS, expresses equity value on a per-share basis.
Book value per share = Equity attributable to ordinary shareholders ÷ Number of outstanding ordinary shares
If the company has book value of ₹600 crore and 10 crore outstanding ordinary shares:
BVPS = ₹600 crore ÷ 10 crore shares = ₹60 per share
If preference shareholders have a prior claim, the relevant preference equity is normally deducted before calculating the book value attributable to ordinary shareholders. Investors should also use the current number of outstanding shares and check whether a stock split, bonus issue, buyback or fresh issue has changed the share count.
To understand where assets, liabilities and equity appear, revisit How to Read a Balance Sheet. How the Three Financial Statements Are Connected explains how retained profit, dividends and losses change shareholders’ equity over time.
Book Value Is Not the Same as Market Value
Book value comes from the financial statements. Market value comes from the price investors are currently willing to pay.
Market capitalisation = Current market price per share × Outstanding shares
A company can trade far above book value because investors expect high future returns, valuable brands, intellectual property, network effects or growth that is not fully reflected as accounting assets.
A company can also trade below book value because the market doubts the quality of its assets, expects losses, fears dilution or believes the business will earn poor returns on its equity.
Read What Is Market Capitalisation? for the complete difference between a company’s share price and its equity market value.
Why Reported Book Value Needs Investigation
Two companies with identical reported book value may not have equally valuable assets.
Historical cost can differ from economic value
Land or property purchased many years ago may be recorded at an amount very different from its present value. Machinery may have limited resale value even though it remains on the books.
Intangible assets can change the picture
Goodwill, acquired brands and other intangibles may form a large part of reported equity. Some investors therefore calculate tangible book value:
Tangible book value = Book value − Goodwill − Other intangible assets
This adjustment can be useful, but it is not automatically superior. Internally developed software, brands or customer relationships may be economically valuable even when accounting rules do not recognise them in the same way as acquired intangibles.
Asset quality matters
Receivables may be difficult to collect. Inventory may become obsolete. Investments may lose value. Loans may turn non-performing. An investor should inspect notes, ageing schedules, provisions and impairments rather than accepting the headline book value blindly.
Negative book value changes interpretation
Accumulated losses can reduce shareholders’ equity below zero. In that situation, BVPS and P/B may become economically difficult or meaningless to interpret.
What Is the Price-to-Book Ratio?
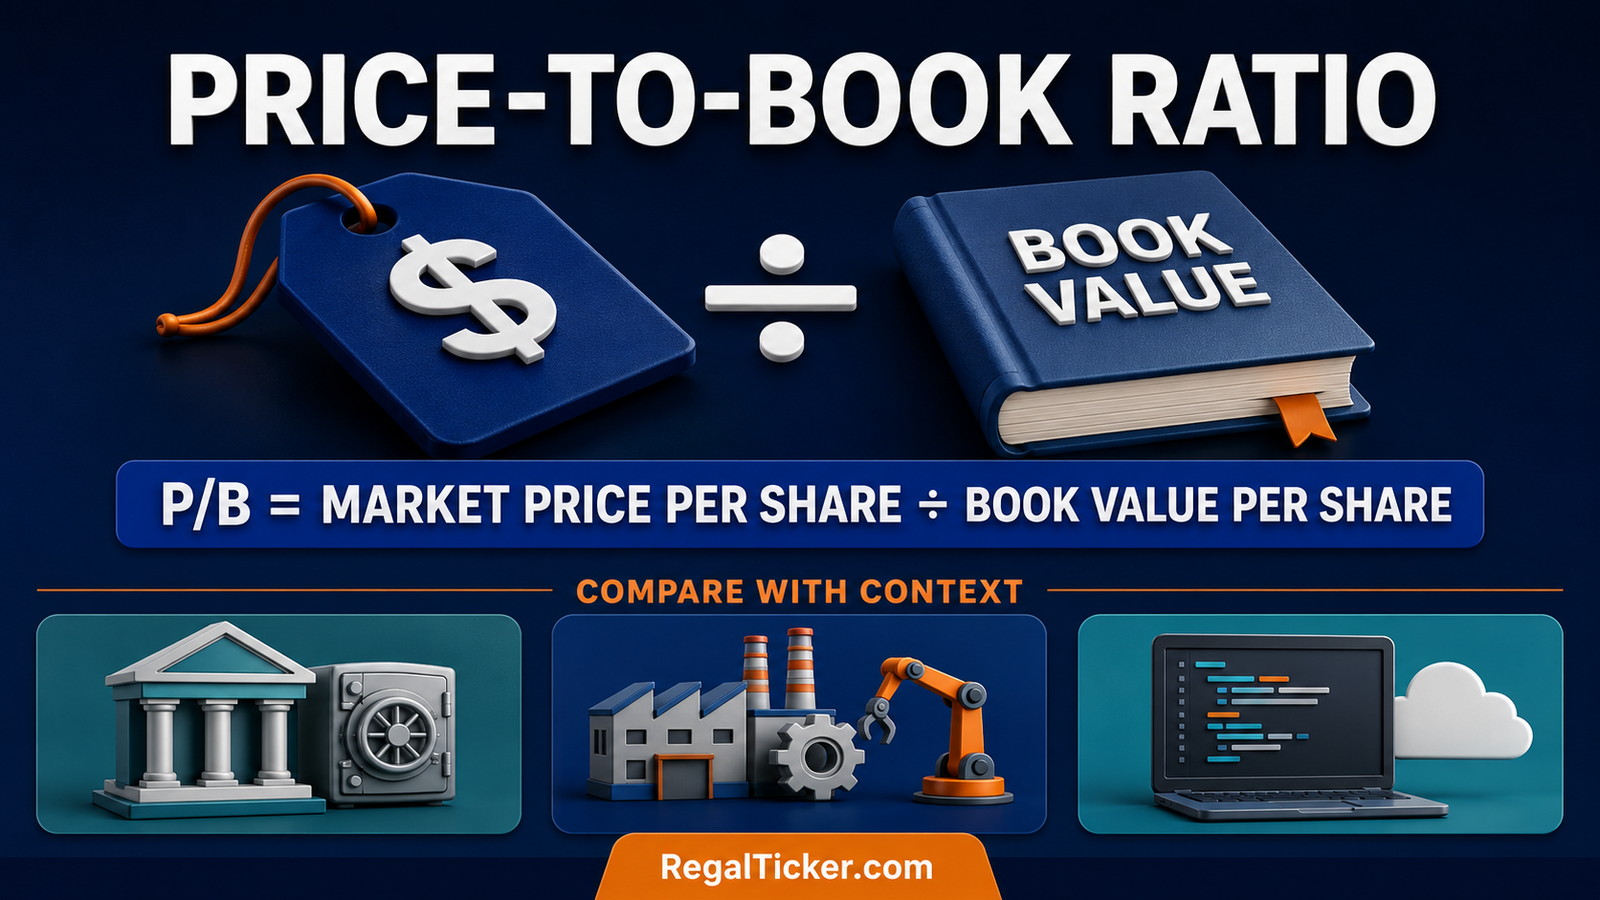
The price-to-book ratio, or P/B ratio, compares the market price of a share with its book value per share.
P/B ratio = Market price per share ÷ Book value per share
It can also be calculated at company level:
P/B ratio = Market capitalisation ÷ Book value of equity
Suppose:
- Market price per share: ₹150
- Book value per share: ₹60
P/B = ₹150 ÷ ₹60 = 2.5
The market is valuing the company’s equity at 2.5 times its accounting book value.
How to Interpret the P/B Ratio
A P/B ratio above 1 means the market value is above reported book value. A ratio below 1 means the market value is below reported book value.
But P/B below 1 does not automatically mean undervalued, and a high P/B does not automatically mean overvalued.
The market may award a high P/B to a company that consistently earns a high return on equity, reinvests profit productively and has strong asset quality.
A low P/B can reflect:
- Weak or negative profitability
- Poor-quality assets
- Expected write-downs
- Excessive leverage
- Governance concerns
- A structurally declining business
- An economic or industry downturn
The sensible question is not “Is P/B low?” It is “Why does the company deserve this P/B relative to its returns, risks and peers?”
When Is P/B Most Useful?
P/B tends to be more informative for businesses where balance-sheet assets and equity are central to operations, such as:
- Banks and some financial institutions
- Insurance businesses, with sector-specific adjustments
- Asset-heavy manufacturers
- Utilities
- Investment or holding companies
- Some real-estate and infrastructure businesses
Even here, sector-specific measures may be necessary. For banks, investors often study asset quality, capital adequacy, provisions, return on assets and return on equity alongside P/B. A bank should not be compared mechanically with a software company.
When Can P/B Be Less Useful?
P/B may be less informative for asset-light businesses whose economic value depends heavily on intellectual property, talent, brands, software, data or network effects.
It can also be distorted when:
- Book value is negative or extremely small
- Large goodwill balances follow acquisitions
- Different accounting policies make peer comparison inconsistent
- Old assets are carried at historical values
- Buybacks materially reduce equity
- Cyclical losses temporarily depress net worth
In such cases, study earnings, cash flow, competitive advantage and other valuation measures rather than forcing P/B to answer every question.
How P/B and ROE Work Together
P/B becomes more meaningful when read with ROE.
| Business pattern | Possible interpretation |
|---|---|
| High and sustainable ROE with high P/B | Market may be paying a premium for strong equity returns |
| Low ROE with high P/B | Valuation may require strong future improvement |
| Healthy ROE with low P/B | Possible opportunity, but investigate risk, asset quality and sustainability |
| Weak ROE with low P/B | Low valuation may reflect poor economics rather than mispricing |
The relationship is not a mechanical rule. Growth, risk, cost of equity, payout policy and the durability of returns also matter. Study ROE, ROCE and Debt-to-Equity Ratio Explained before comparing two companies only on P/B.
What Is Enterprise Value?
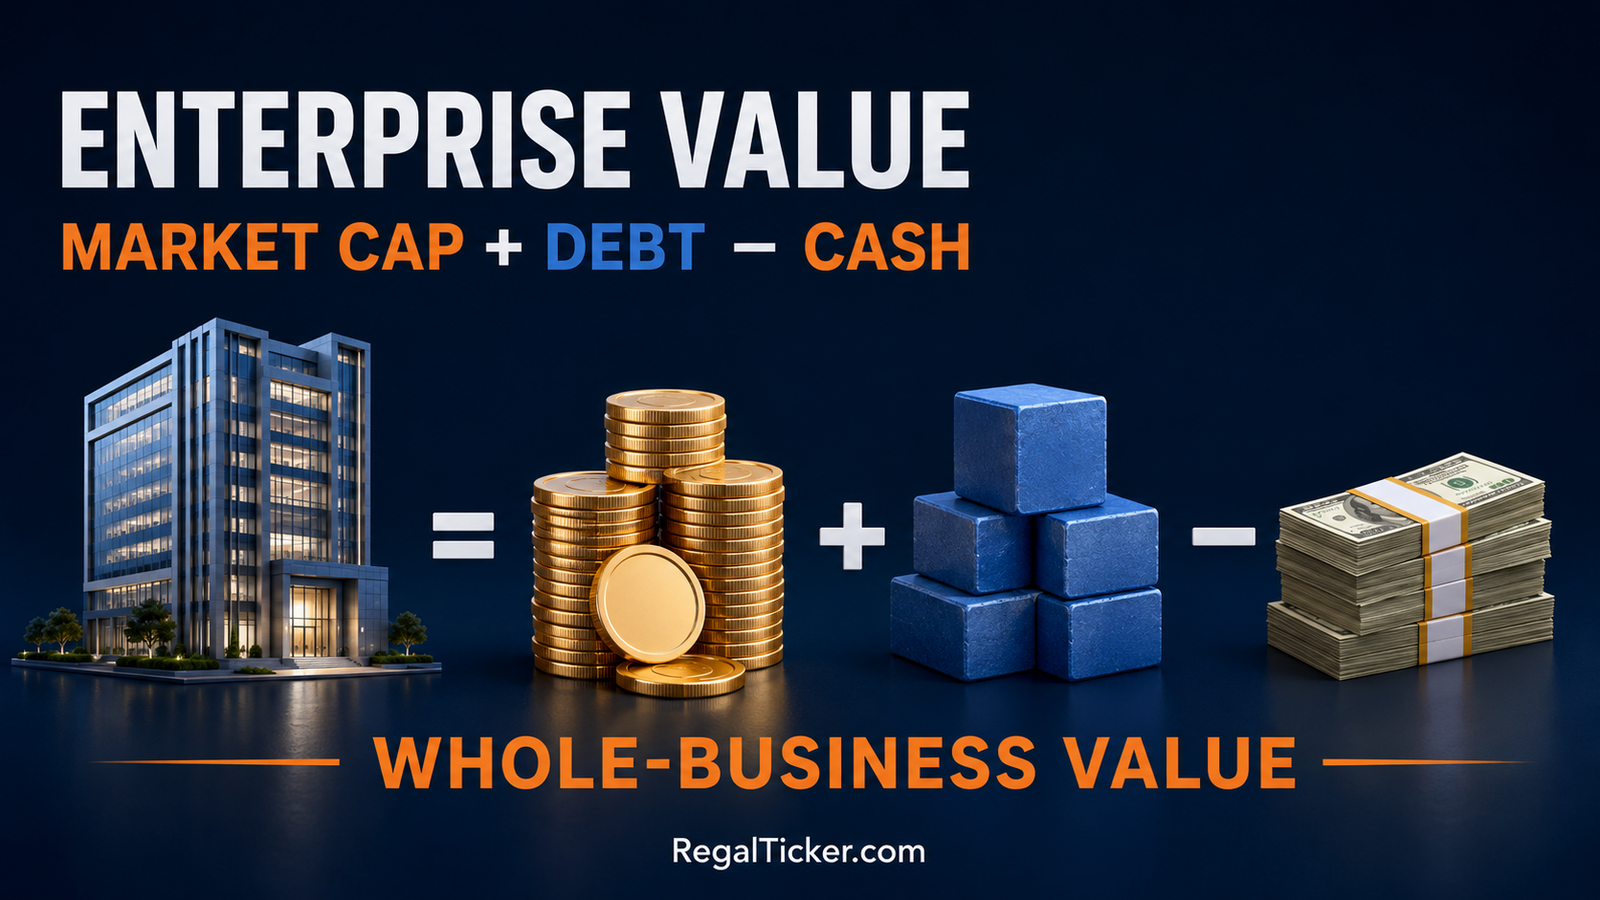
Market capitalisation measures the market value of equity. Enterprise value (EV) attempts to measure the value of the whole operating business available to all capital providers.
A common simplified formula is:
Enterprise value = Market capitalisation + Total debt − Cash and cash equivalents
Some analysts also add preference capital, non-controlling interest or other debt-like obligations and subtract non-operating investments. The exact definition must match the purpose of the analysis and remain consistent across companies.
Enterprise value example
Suppose a company has:
- Market capitalisation: ₹4,000 crore
- Total interest-bearing debt: ₹1,200 crore
- Cash and cash equivalents: ₹500 crore
EV = ₹4,000 crore + ₹1,200 crore − ₹500 crore = ₹4,700 crore
Why Does EV Add Debt and Subtract Cash?
Debt is added because a buyer of the entire business would effectively take responsibility for its financing obligations.
Cash is subtracted because eligible surplus cash reduces the net cost of acquiring the operating business. In practice, not every rupee labelled cash is necessarily surplus. Restricted cash, regulatory balances or cash essential for daily operations may not be freely available.
This is why EV should not be copied from a data screen without checking:
- What the provider counts as debt
- Whether lease liabilities are included
- Whether non-controlling interest is included
- Which cash and investments are deducted
- Whether the figures are current and from the same reporting date
The distinction between market capitalisation and EV also shows why two companies with the same equity value can have very different whole-business values.
What Is EBITDA?
EBITDA means earnings before interest, tax, depreciation and amortisation.
A common calculation starts with operating profit:
EBITDA = EBIT + Depreciation + Amortisation
EBITDA is used as a broad measure of operating performance before financing, tax and non-cash depreciation or amortisation charges.
However, EBITDA is not the same as profit, operating cash flow or free cash flow.
It does not automatically account for:
- Capital expenditure needed to maintain assets
- Working-capital requirements
- Interest payments
- Tax payments
- Debt repayment
- Acquisitions
For a capital-intensive company, depreciation may represent a real economic cost because expensive assets eventually need replacement. How to Read a Cash Flow Statement explains why EBITDA should be reconciled with operating cash flow and capital expenditure.
What Is the EV/EBITDA Ratio?
The EV/EBITDA ratio compares the whole-business value with EBITDA.
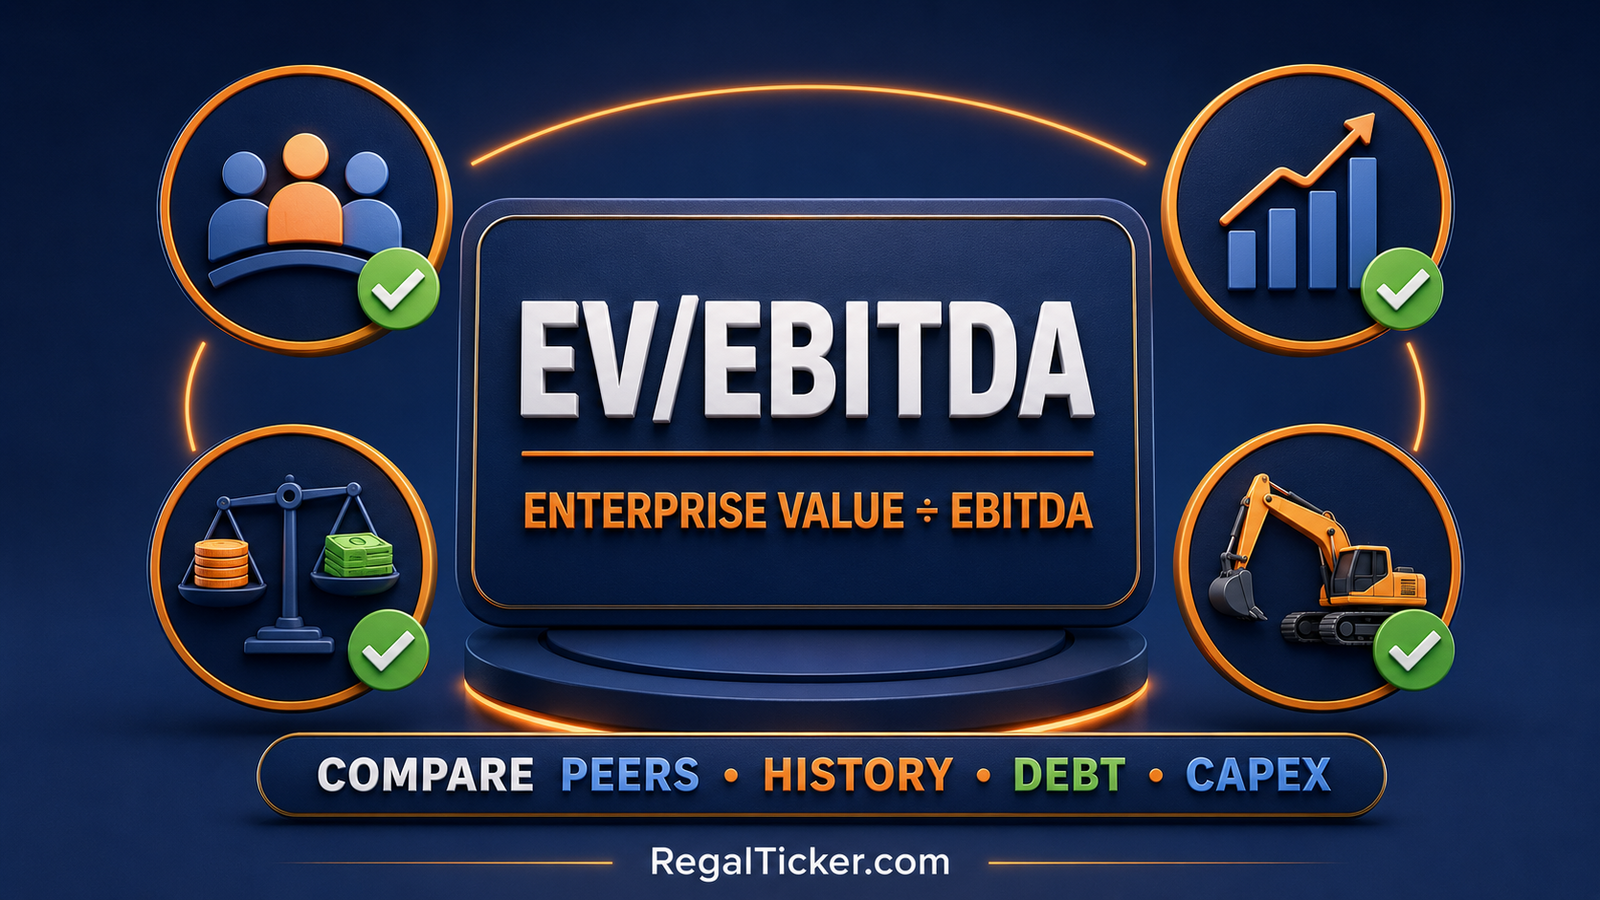
EV/EBITDA = Enterprise value ÷ EBITDA
Using the previous EV of ₹4,700 crore, assume the company reports annual EBITDA of ₹470 crore:
EV/EBITDA = ₹4,700 crore ÷ ₹470 crore = 10 times
The company’s enterprise value is ten times its annual EBITDA under those definitions.
Why Investors Use EV/EBITDA
EV/EBITDA can help compare operating businesses with different debt levels because:
- EV includes debt and equity value
- EBITDA is measured before interest
- The numerator and denominator both relate broadly to all capital providers
- It is less affected by differences in depreciation than P/E
It is often used for peer comparison in sectors such as telecom, cement, metals, manufacturing, infrastructure and other businesses where capital structures differ.
It is still not universally appropriate. For banks and many financial businesses, debt is an operating input rather than simply a financing choice, so EV/EBITDA is generally less meaningful.
A Low EV/EBITDA Is Not Automatically Cheap
A low multiple may indicate an attractively valued business, but it may also reflect:
- Cyclical EBITDA near a temporary peak
- Expected earnings decline
- High maintenance capital expenditure
- Weak cash conversion
- Governance or regulatory risk
- Obsolete assets
- A business with little growth
- Understated debt-like obligations
A high multiple may reflect strong growth, resilient margins or superior business quality—or simply excessive optimism.
Always compare:
- Similar companies in the same industry
- The company’s own historical range
- Normalised rather than peak or trough earnings
- Debt, cash and contingent obligations
- EBITDA conversion into operating and free cash flow
- Required capital expenditure
EV/EBITDA vs P/E vs P/B
| Ratio | Value measured | Denominator | Particularly useful for | Major caution |
|---|---|---|---|---|
| P/E | Equity value | Earnings attributable to equity shareholders | Profitable companies | Distorted by one-off earnings and leverage |
| P/B | Equity value | Accounting book equity | Asset-based and financial businesses | Asset quality and intangible value |
| EV/EBITDA | Whole-business value | EBITDA before interest, tax, depreciation and amortisation | Operating peer comparison across capital structures | Ignores capex and is often unsuitable for financial firms |
For a deeper explanation of equity earnings multiples, read EPS, P/E Ratio and PEG Ratio Explained.
Worked Comparison: Company A and Company B
Assume two manufacturers:
| Measure | Company A | Company B |
|---|---|---|
| Market capitalisation | ₹5,000 crore | ₹5,000 crore |
| Book value | ₹2,000 crore | ₹1,250 crore |
| P/B | 2.5× | 4.0× |
| Debt | ₹500 crore | ₹2,000 crore |
| Cash | ₹300 crore | ₹200 crore |
| Enterprise value | ₹5,200 crore | ₹6,800 crore |
| EBITDA | ₹650 crore | ₹680 crore |
| EV/EBITDA | 8.0× | 10.0× |
Their market capitalisations are identical, but Company B has substantially more debt. Its enterprise value is therefore higher. Company B also trades at a higher P/B and EV/EBITDA despite only slightly higher EBITDA.
This does not prove Company A is the better investment. Company B may have faster growth, better assets or stronger margins. But the comparison identifies the questions an investor must investigate instead of concluding that both companies are equally valued because their market capitalisations match.
A Practical Valuation Checklist
Before using these ratios, follow this sequence:
1. Check the financial statements
Read the balance sheet, income statement, cash flow statement and notes. Confirm the reporting period and whether figures are consolidated.
2. Standardise the definitions
Use the same treatment of debt, cash, minority interest, leases, exceptional items and share count for every company.
3. Inspect business quality
Study revenue, margins, return ratios, competitive position and management’s capital allocation. What Is Fundamental Analysis? provides the wider framework.
4. Compare several years
One year can be distorted by an acquisition, asset sale, impairment, commodity cycle or temporary margin spike.
5. Compare genuine peers
Similar industry labels do not guarantee similar economics. Consider product mix, geography, asset ownership and business cycle.
6. Connect valuation with cash
Check whether accounting earnings and EBITDA become operating cash flow and free cash flow.
7. Investigate the reason for the multiple
A low ratio is a research signal, not a conclusion. Find out what risk the market may be pricing in.
Investors can use the Regal Ticker Investor Tools to support calculations, but the final judgement must come from the company’s disclosures and a consistent analytical process.
Common Mistakes to Avoid
- Treating book value as liquidation value
- Assuming P/B below 1 always means undervalued
- Comparing P/B across unrelated sectors
- Ignoring goodwill, weak receivables or poor asset quality
- Confusing market capitalisation with enterprise value
- Subtracting restricted or essential operating cash from EV
- Mixing EV from one date with EBITDA from another period
- Treating EBITDA as cash flow
- Ignoring maintenance capital expenditure
- Comparing reported EBITDA when companies define adjustments differently
- Using a single-year multiple during a cyclical earnings peak
Frequently Asked Questions
Is book value the amount shareholders will receive if a company closes?
No. Book value is an accounting measure. Actual liquidation proceeds depend on the sale value of assets, collection of receivables, settlement costs, taxes, creditor priority and other claims.
Is a P/B ratio below 1 always good?
No. It may signal undervaluation, but it may also reflect weak profitability, doubtful assets, expected losses, governance problems or excessive risk.
Why can a high-ROE company have a high P/B ratio?
The market may pay a premium for a company that can sustainably earn strong returns on equity. Investors must still judge whether the expected returns and growth justify the price.
Is enterprise value the takeover price?
EV is a useful analytical approximation of whole-business value, not an exact takeover price. A real transaction can include control premiums, working-capital adjustments, contingent liabilities and other negotiated items.
Is EBITDA the same as operating cash flow?
No. EBITDA excludes working-capital movements, taxes, interest and other cash items. Operating cash flow is reported in the cash flow statement.
Is lower EV/EBITDA always better?
No. A lower multiple can reflect weaker growth, poor cash conversion, heavy capital expenditure, cyclical peak earnings or higher risk. Compare like with like and investigate the reason.
Can EV/EBITDA be used for banks?
It is generally less useful for banks and many financial firms because borrowing is part of their core operations. Sector-specific measures such as P/B, ROA, ROE, capital adequacy and asset quality are normally more informative.
Final Takeaway
Book value and P/B help investors compare equity market value with accounting net worth. Enterprise value and EV/EBITDA shift the lens from shareholders alone to the whole operating business.
Use P/B with asset quality and ROE. Use EV/EBITDA with debt, cash conversion and capital expenditure. Compare companies with genuine peers, use consistent definitions and examine several years.
A valuation ratio is not a verdict. It is a structured question about what the market price assumes—and whether the business can justify those assumptions.
Official references: SEBI Investor—Due Diligence and NSE Financial Statement Analysis.