Quick answer
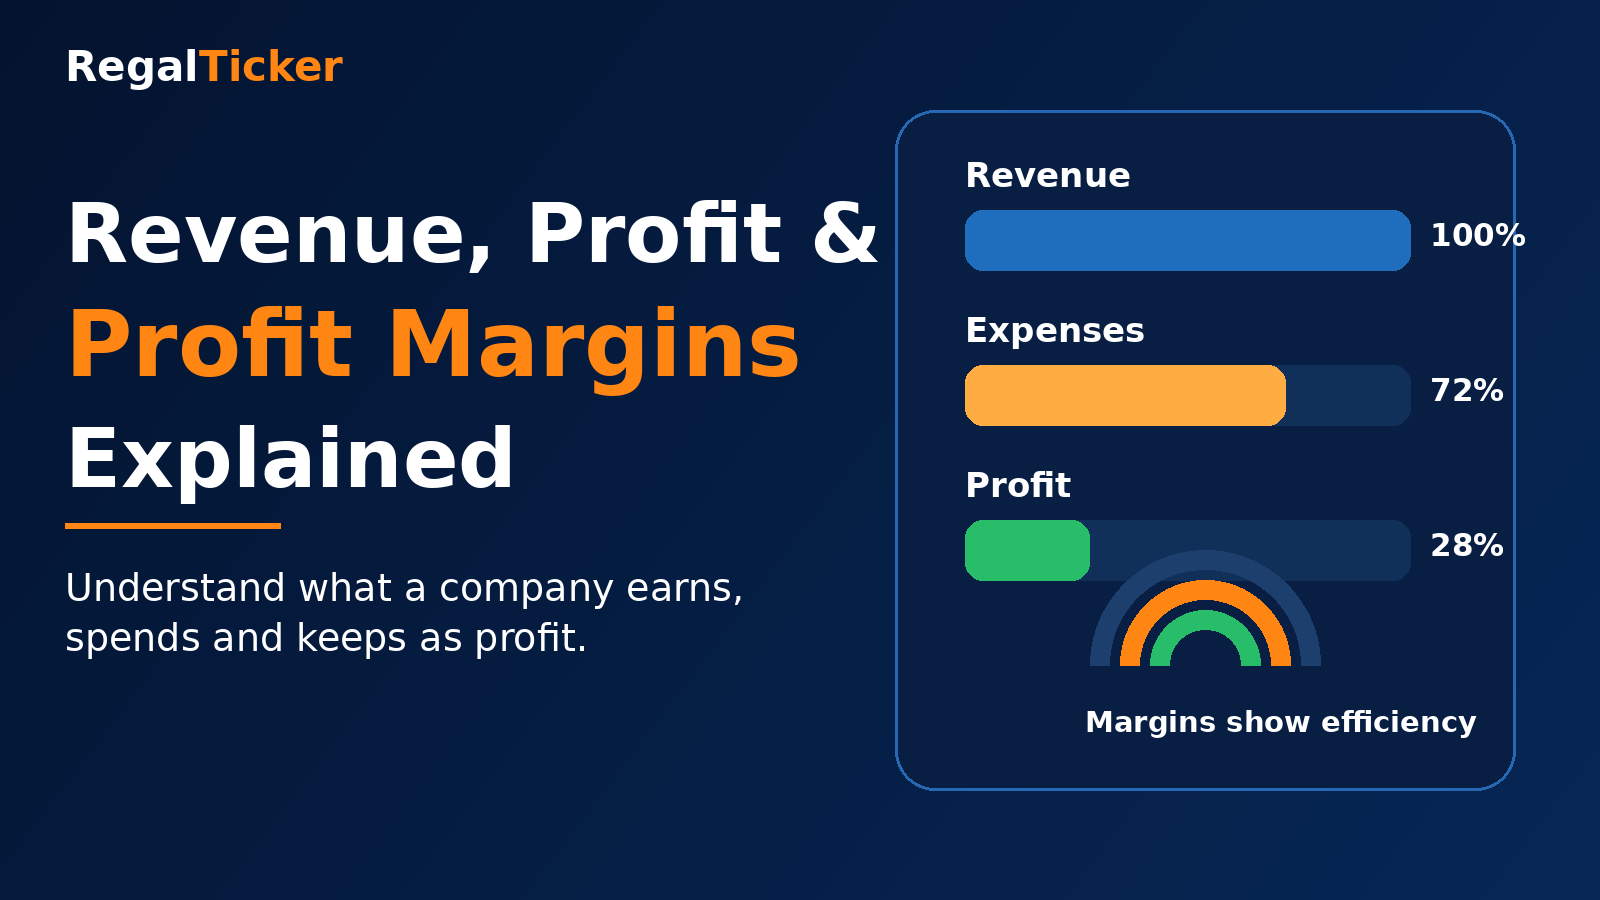
Revenue is the total income a company earns from selling goods or services before deducting expenses. Profit is what remains after costs are deducted. Profit margin expresses profit as a percentage of revenue, helping investors judge how efficiently a company converts sales into earnings.
Investor note
Key Takeaways
Revenue is the starting point, not the final result. Gross profit measures revenue after direct production or service costs. Operating profit measures the performance of the core business. Net profit is the final profit after operating costs, interest and tax. Profit margins show efficiency and are often more useful than profit alone. Rising sales with falling margins can signal weakening business quality.
Why revenue, profit and margins matter
A company may announce record sales and still disappoint investors. Another company may report slower sales growth but improve profitability significantly. The difference becomes clear only when we understand revenue, profit and profit margins.
These three concepts answer different questions:
- Revenue: How much did the company sell?
- Profit: How much money remained after costs?
- Profit margin: How efficiently did the company convert sales into profit?
For fundamental analysis, looking only at revenue is incomplete. Investors need to follow the full journey from sales to final earnings.
What is revenue?
Revenue is the total amount earned from the company’s normal business activities before deducting expenses. It is often called sales, turnover or the top line.
A retailer earns revenue by selling products. A software company earns revenue from subscriptions or licences. A bank earns income from interest, fees and other banking activities. The exact source differs by business, but the main idea remains the same: revenue represents the money generated by operations before costs.
Simple revenue example
Suppose a company sells 10,000 units at ₹100 each.
Simple calculation
Calculation
10,000 units × ₹100 = ₹10,00,000 revenue
That ₹10,00,000 is not profit. The company must still pay for materials, staff, rent, marketing, interest, tax and other expenses.
Risk warning
High revenue does not guarantee high profit
A company can generate large sales but retain very little profit if its expenses are also very high.
How revenue becomes profit
Revenue is reduced by several layers of expenses before it becomes net profit.

A simplified journey looks like this:
- Revenue
- Less direct costs
- Gross profit
- Less operating expenses
- Operating profit
- Less interest and tax
- Net profit
This layered structure helps investors identify exactly where profitability is improving or weakening.
What is gross profit?
Gross profit is the amount remaining after subtracting the direct cost of producing goods or delivering services.
FORMULA: Gross Profit = Revenue − Cost of Goods Sold
For a manufacturing company, direct costs may include raw materials and factory labour. For a retailer, they may include the cost of products purchased for resale. For a service company, the classification may differ, so investors should read the company’s financial statements carefully.
Gross profit example
Suppose:
- Revenue: ₹10,00,000
- Direct costs: ₹6,00,000
Simple calculation
₹10,00,000 − ₹6,00,000 = ₹4,00,000 gross profit
Gross profit helps investors understand the basic economics of the product or service before administrative, marketing and other operating costs.
What is operating profit?
Operating profit is the profit generated from the company’s core business after deducting both direct costs and operating expenses.
Operating expenses may include:
- Employee salaries
- Office rent
- Advertising and marketing
- Technology expenses
- Administrative costs
- Depreciation
A commonly used measure related to operating performance is EBIT—earnings before interest and tax. Companies may also discuss EBITDA, which excludes depreciation and amortisation as well. Investors must check exactly which measure is being used.
FORMULA: Operating Profit = Gross Profit − Operating Expenses
Operating profit example
Suppose:
- Gross profit: ₹4,00,000
- Operating expenses: ₹2,00,000
Simple calculation
₹4,00,000 − ₹2,00,000 = ₹2,00,000 operating profit
Operating profit is important because it focuses on the economics of the main business before financing and tax effects.
What is net profit?
Net profit is the final profit remaining after all major expenses have been deducted, including operating costs, interest and tax. It is often called the bottom line.
FORMULA: Net Profit = Total Income − Total Expenses
Net profit example
Suppose:
- Operating profit: ₹2,00,000
- Interest and tax: ₹50,000
Simple calculation
₹2,00,000 − ₹50,000 = ₹1,50,000 net profit
Net profit is especially important to shareholders because it contributes to earnings per share and may support dividends, retained earnings and future growth.
Gross profit vs operating profit vs net profit

| Profit level | What is deducted | What it helps measure |
|---|---|---|
| Gross Profit | Direct production or service costs | Product economics and pricing power |
| Operating Profit | Direct costs plus operating expenses | Core business efficiency |
| Net Profit | All major costs, including interest and tax | Final profitability for shareholders |
What is a profit margin?
A profit margin expresses profit as a percentage of revenue.
Instead of only saying that a company earned ₹1,50,000, the margin tells us how much profit was earned for every ₹100 of sales.
FORMULA: Profit Margin = Profit ÷ Revenue × 100
If a company earns ₹15 in net profit from every ₹100 of revenue, its net profit margin is 15%.
Margins are useful because they make comparison easier across:
- Different companies
- Different years
- Different business sizes
- Different economic conditions
Gross profit margin
Gross margin shows the percentage of revenue remaining after direct costs.
FORMULA: Gross Margin = Gross Profit ÷ Revenue × 100
Using our example:
Simple calculation
₹4,00,000 ÷ ₹10,00,000 × 100 = 40%
A 40% gross margin means the company retains ₹40 from every ₹100 of sales before operating expenses.
Gross margin can be influenced by:
Selling prices Raw-material costs Product mix Discounts Manufacturing efficiency Supplier bargaining power
Operating profit margin
Operating margin shows the percentage of revenue remaining after direct costs and operating expenses.
FORMULA: Operating Margin = Operating Profit ÷ Revenue × 100
Using our example:
Simple calculation
₹2,00,000 ÷ ₹10,00,000 × 100 = 20%
A 20% operating margin means the core business earns ₹20 of operating profit from every ₹100 of revenue.
This margin is useful for studying management’s control over operating costs.
Net profit margin
Net margin shows the final percentage of revenue retained as net profit after all major costs.
FORMULA: Net Margin = Net Profit ÷ Revenue × 100
Using our example:
Simple calculation
₹1,50,000 ÷ ₹10,00,000 × 100 = 15%
A 15% net margin means the company keeps ₹15 as final profit from every ₹100 of revenue.

Why margins are often more useful than profit alone
Suppose Company A earns ₹100 crore in net profit and Company B earns ₹20 crore. Company A appears much stronger based only on the absolute number.
But now consider revenue:
- Company A revenue: ₹2,000 crore
- Company A net profit: ₹100 crore
- Company A net margin: 5%
- Company B revenue: ₹100 crore
- Company B net profit: ₹20 crore
- Company B net margin: 20%
Company A earns more total profit because it is much larger. However, Company B converts revenue into profit far more efficiently.
This is why investors study both absolute profit and profit margins.
What is a good profit margin?
There is no universal margin that is good for every company.
Margins vary widely by industry:
- Retailers may operate on relatively thin margins.
- Software businesses may have high gross margins.
- Commodity businesses may experience large margin cycles.
- Banks and financial companies use different profitability measures.
A margin should usually be compared with:
- The company’s own history
- Industry competitors
- The business model
- The current economic environment
Risk warning
Do not compare unrelated industries blindly
A 10% net margin may be excellent in one industry and weak in another. Always compare similar businesses.
Revenue growth vs profit growth
Healthy growth is often strongest when both revenue and profit increase over time.
But several combinations are possible:
Revenue up, profit up
This may indicate healthy expansion, especially if margins remain stable or improve.
Revenue up, profit flat
Costs may be rising nearly as fast as sales.
Revenue up, profit down
The business may be using discounts, facing cost pressure or suffering weak operating efficiency.
Revenue down, profit up
The company may have cut costs, improved product mix or sold higher-margin products. Investors should check whether the improvement is sustainable.
Rising revenue but falling margins

A company may celebrate rising sales while its margins quietly weaken.
Worked example
Simple example
| Year | Revenue | Net Profit | Net Margin |
|---|---|---|---|
| Year 1 | ₹100 crore | ₹15 crore | 15% |
| Year 2 | ₹120 crore | ₹15.6 crore | 13% |
| Year 3 | ₹145 crore | ₹15.95 crore | 11% |
What can cause margins to improve?
Margins may improve because of:
- Higher selling prices
- Lower raw-material costs
- Better product mix
- Increased scale
- Automation and efficiency
- Reduced waste
- Strong brand pricing power
- Lower interest costs
An improving margin can be positive, but investors should check whether the change is sustainable or caused by a one-time factor.
What can cause margins to decline?
Margins may decline because of:
- Raw-material inflation
- Heavy discounts
- New competition
- Wage increases
- Higher advertising expenses
- Weak capacity utilisation
- Rising debt and interest costs
- Unfavourable product mix
A single weak quarter may not be meaningful. A persistent multi-year decline deserves closer investigation.
Operating leverage and margins
Some businesses have high fixed costs. Once those fixed costs are covered, additional revenue may produce profit faster. This is called operating leverage.
For example, a software company may spend heavily to build a platform. After the platform is developed, adding more customers may not increase costs proportionately. As revenue grows, operating margins may expand.
However, operating leverage works in both directions. When revenue declines, fixed costs remain, and profit may fall quickly.
Profit quality: accounting profit vs cash flow
Reported profit is important, but investors also compare it with cash flow from operations.
A company may report profit while cash collection remains weak because customers have not paid. Persistent differences between profit and operating cash flow may require investigation.
Investor note
Profit should eventually convert into cash
Over time, a healthy business should generally generate cash that supports its reported earnings. Profit growth without cash-flow support can be a warning sign.
One-time items and exceptional profit
Net profit may be affected by events unrelated to normal operations, such as:
- Sale of land or investments
- Insurance settlements
- Legal provisions
- Asset write-offs
- Tax adjustments
These items can make one year look unusually strong or weak. Investors often study adjusted or normalised profit to understand recurring business performance.
Risk warning
Check why profit changed
Do not assume that every increase in net profit came from stronger business operations. Read the notes and results commentary.
How investors analyse margin trends
A practical margin analysis can follow these steps:
- Collect at least three to five years of revenue and profit data.
- Calculate gross, operating and net margins.
- Observe whether margins are rising, stable or falling.
- Compare with similar companies.
- Read management’s explanation for major changes.
- Check whether profit is supported by cash flow.
- Identify one-time items.
A trend is often more useful than one isolated number.
Simple company comparison
| Metric | Company Alpha | Company Beta |
|---|---|---|
| Revenue Growth | 12% | 18% |
| Net Profit Growth | 14% | 8% |
| Net Margin | 16% | 7% |
| Debt Level | Low | High |
Common beginner mistakes
Mistake 1: Treating revenue as profit
Sales do not belong entirely to shareholders. Costs must be deducted first.
Mistake 2: Looking only at net profit
Gross and operating profit help identify where performance changed.
Mistake 3: Ignoring margins
Absolute profit can be misleading when comparing companies of different sizes.
Mistake 4: Comparing unrelated sectors
Industry economics differ significantly.
Mistake 5: Using one year only
Multi-year trends provide better context.
Mistake 6: Ignoring cash flow
Reported profit should be examined alongside operating cash generation.
Mistake 7: Ignoring exceptional items
One-time gains can inflate net profit.
Frequently asked questions
Is revenue the same as profit?
No. Revenue is total sales before expenses, while profit is what remains after expenses are deducted.
What is the difference between gross profit and net profit?
Gross profit deducts only direct costs. Net profit deducts all major expenses, including operating costs, interest and tax.
What does profit margin mean?
Profit margin shows profit as a percentage of revenue and indicates how efficiently the company converts sales into earnings.
Which margin is most important?
Gross, operating and net margins all provide different insights. Investors should study them together.
Is a higher margin always better?
A higher sustainable margin is generally positive, but comparisons should be made within the same industry and with attention to risk and accounting quality.
Can revenue rise while profit falls?
Yes. This can happen when expenses rise faster than sales.
What should I learn next?
Continue with How to Read an Income Statement to learn how revenue, expenses and profit appear together in a company’s financial statements
Continue Learning in Fundamental Analysis
Conclusion
Revenue tells investors how much a company sells. Profit tells them how much remains after costs. Profit margins show how efficiently the business converts sales into earnings.
A complete analysis should not stop at the top line. Investors should follow the entire path from revenue to gross profit, operating profit and net profit, while also studying margin trends, cash flow and one-time items.
The key principle is simple:
Growth is most valuable when sales translate into sustainable profit and cash.
Verify through official sources
Official references
Educational disclaimer: This article is for investor education and general information only. It is not investment advice, a stock recommendation or a promise of returns. Financial figures, accounting classifications and margins should be verified using the company’s latest official financial statements and disclosures.