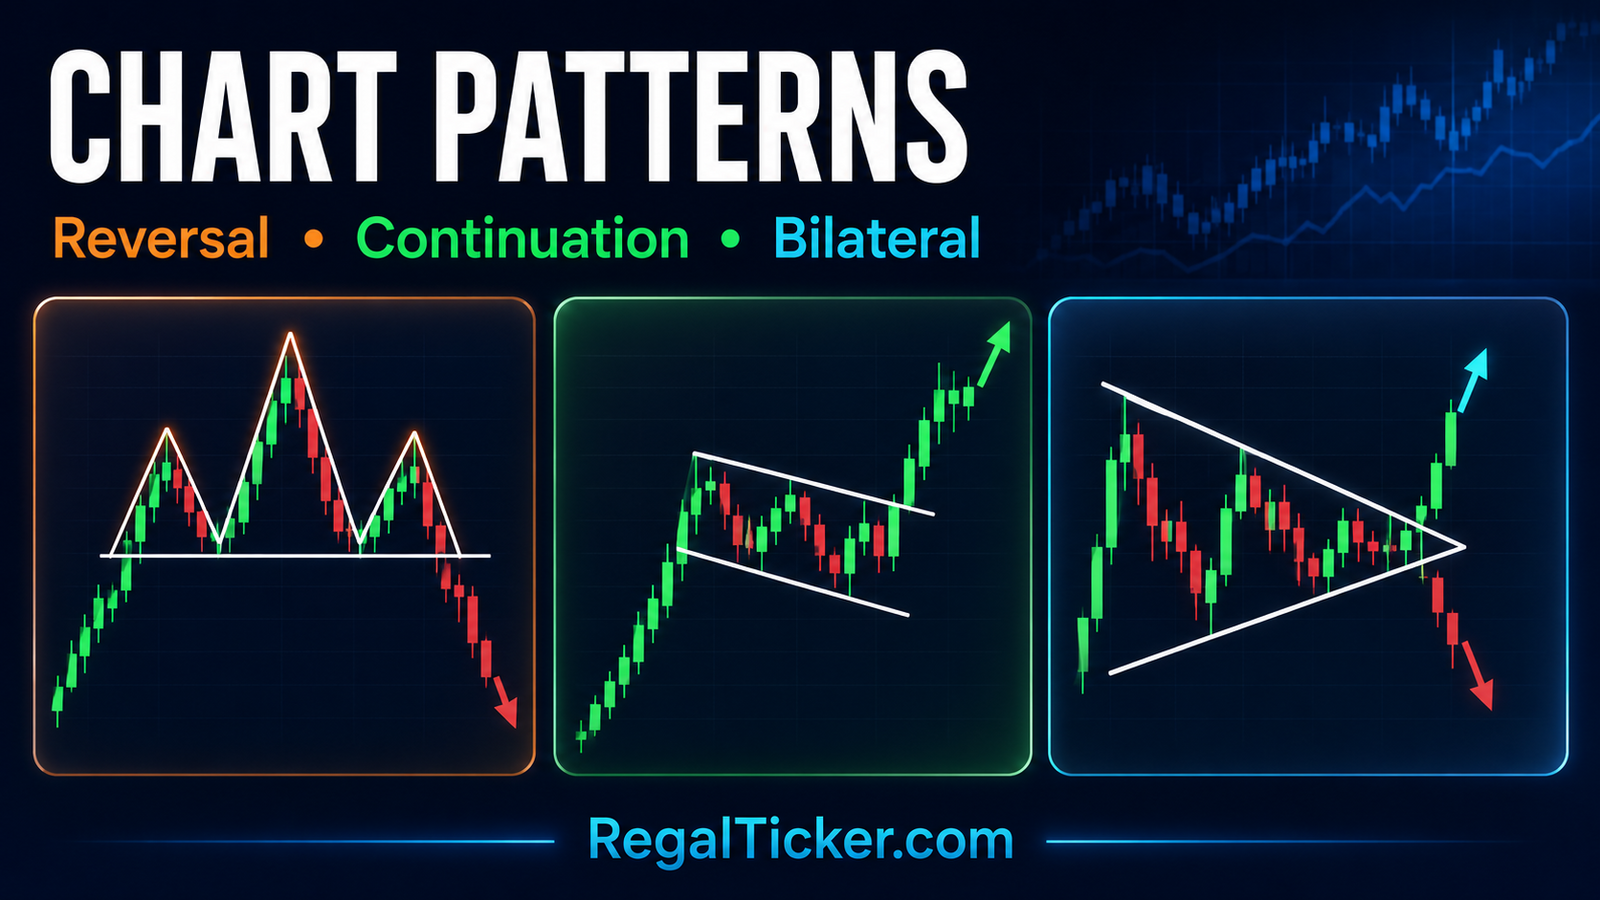
Chart patterns are recognisable price structures that develop as buyers and sellers compete. They can help an analyst organise consolidation, trend exhaustion and potential breakouts—but they do not predict the future with certainty.
The most useful classification is:
- Reversal patterns, which may signal that an existing trend is changing.
- Continuation patterns, which may represent a pause before the existing trend resumes.
- Bilateral patterns, which can break in either direction.
A shape without context is not a complete analysis. First identify the trend using Trend Analysis: Uptrend, Downtrend and Sideways Market, mark important levels through Support and Resistance in the Stock Market: Beginner’s Guide, and understand the candles forming the structure through How to Read Candlestick Charts: A Beginner’s Guide.
What Are Chart Patterns in Technical Analysis?
A chart pattern is a price formation bounded by meaningful swing points, support/resistance areas or trendlines. It reflects a period during which demand and supply are changing.
Patterns are commonly visible across multiple timeframes, but they are not equally important everywhere. A pattern built over several months may carry different context from a similar-looking pattern formed in a few minutes. Liquidity, volatility and the quality of its boundaries also matter.
SEBI’s investor-education overview explains that technical analysis studies price movements, patterns and trading volume. It also gives head and shoulders as an example of a potential trend reversal: SEBI Investor — Technical vs Fundamental Analysis.
The Three Questions Every Pattern Must Answer
- What came before it? A reversal pattern needs a trend to reverse; a continuation pattern needs a trend to continue.
- Where is confirmation? The formation is incomplete until price crosses the relevant boundary with adequate follow-through.
- What invalidates it? A responsible interpretation defines where the setup has failed.
| Pattern category | What it suggests | Examples | Confirmation concept |
|---|---|---|---|
| Reversal | Existing trend may change | Head and shoulders, double top, double bottom | Break of neckline/support/resistance |
| Continuation | Existing trend may resume after a pause | Flag, pennant, ascending triangle | Break in trend direction with follow-through |
| Bilateral | Either direction remains possible | Symmetrical triangle, rectangle | Decisive break from either boundary |
Reversal Chart Patterns
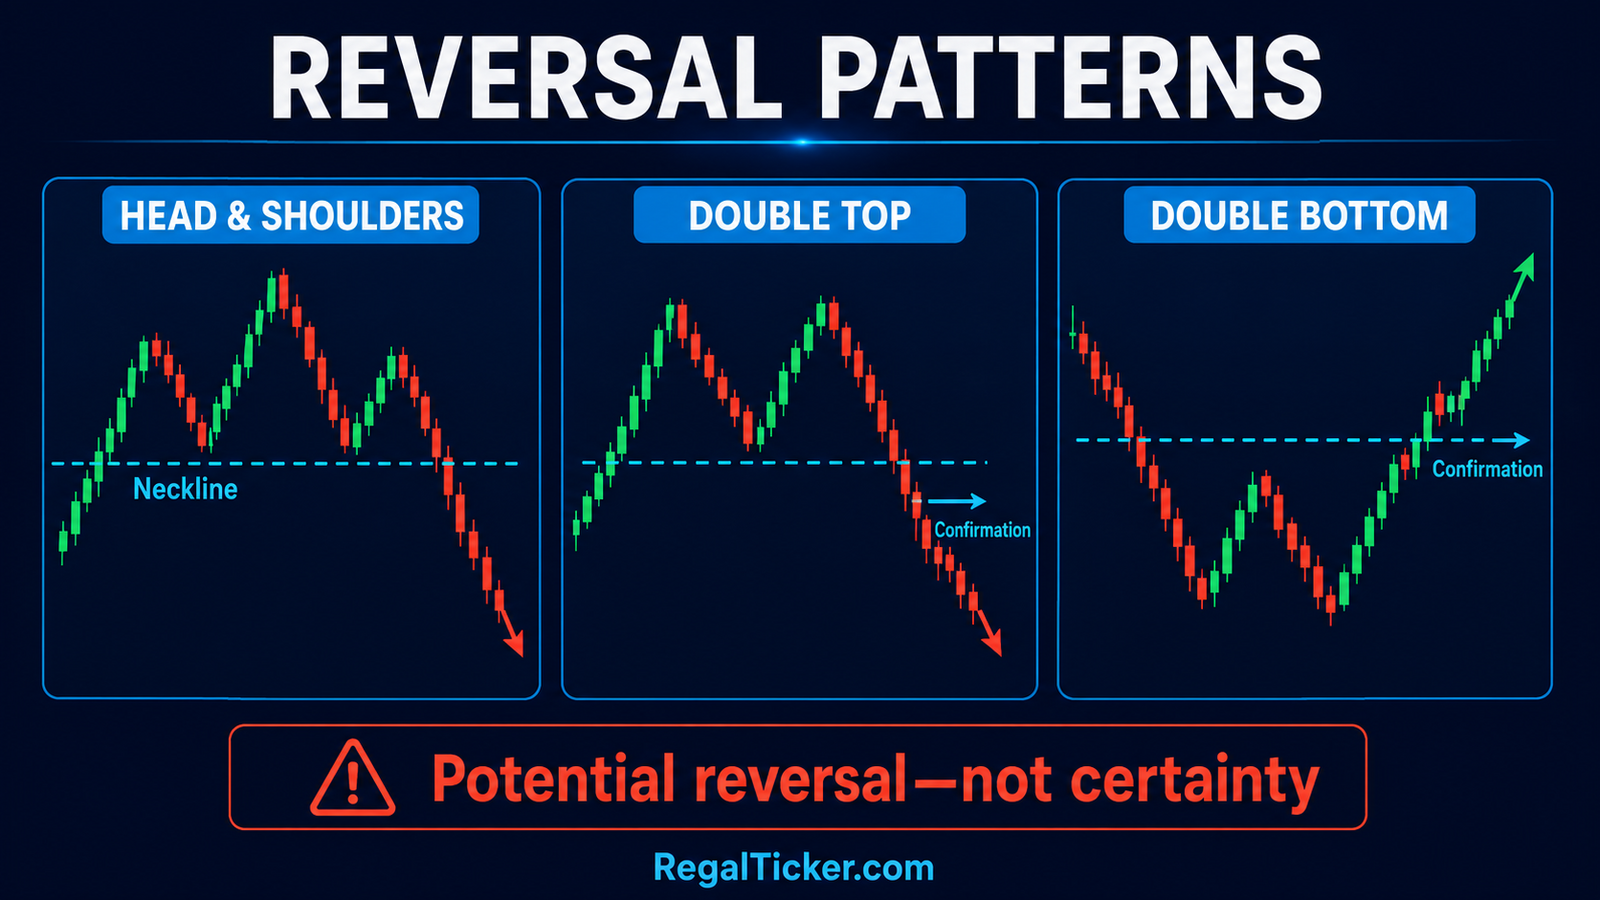
Reversal patterns develop after a recognisable trend and suggest that the balance between buyers and sellers may be changing. They are potential reversals until confirmed.
Head and Shoulders
A bearish head and shoulders pattern typically develops after an uptrend:
- The left shoulder forms a peak and pullback.
- The head rises above the left shoulder and then pulls back.
- The right shoulder peaks below the head.
- A neckline connects the two intervening lows.
The pattern is not confirmed merely because three peaks resemble shoulders and a head. Traditional confirmation occurs when price breaks below the neckline. Volume, closing behaviour and follow-through may strengthen or weaken that evidence.
An inverse head and shoulders is the bullish counterpart after a downtrend. It forms three troughs, with the middle trough deepest, and confirms only after a meaningful break above its neckline.
Double Top
A double top often resembles the letter M. Price tests a high area twice and fails to sustain a breakout. The low between the peaks becomes the confirmation level.
The second peak does not need to equal the first exactly. Markets operate in zones. More importantly, two similar highs alone do not confirm a reversal; price must break the intervening support with sufficient evidence.
Double Bottom
A double bottom resembles the letter W and may develop after a downtrend. Price tests a lower area twice, while the peak between the troughs becomes resistance.
Confirmation generally requires a break above that intervening peak. Buying merely because two lows look similar risks entering before the structure has completed.
Continuation Chart Patterns
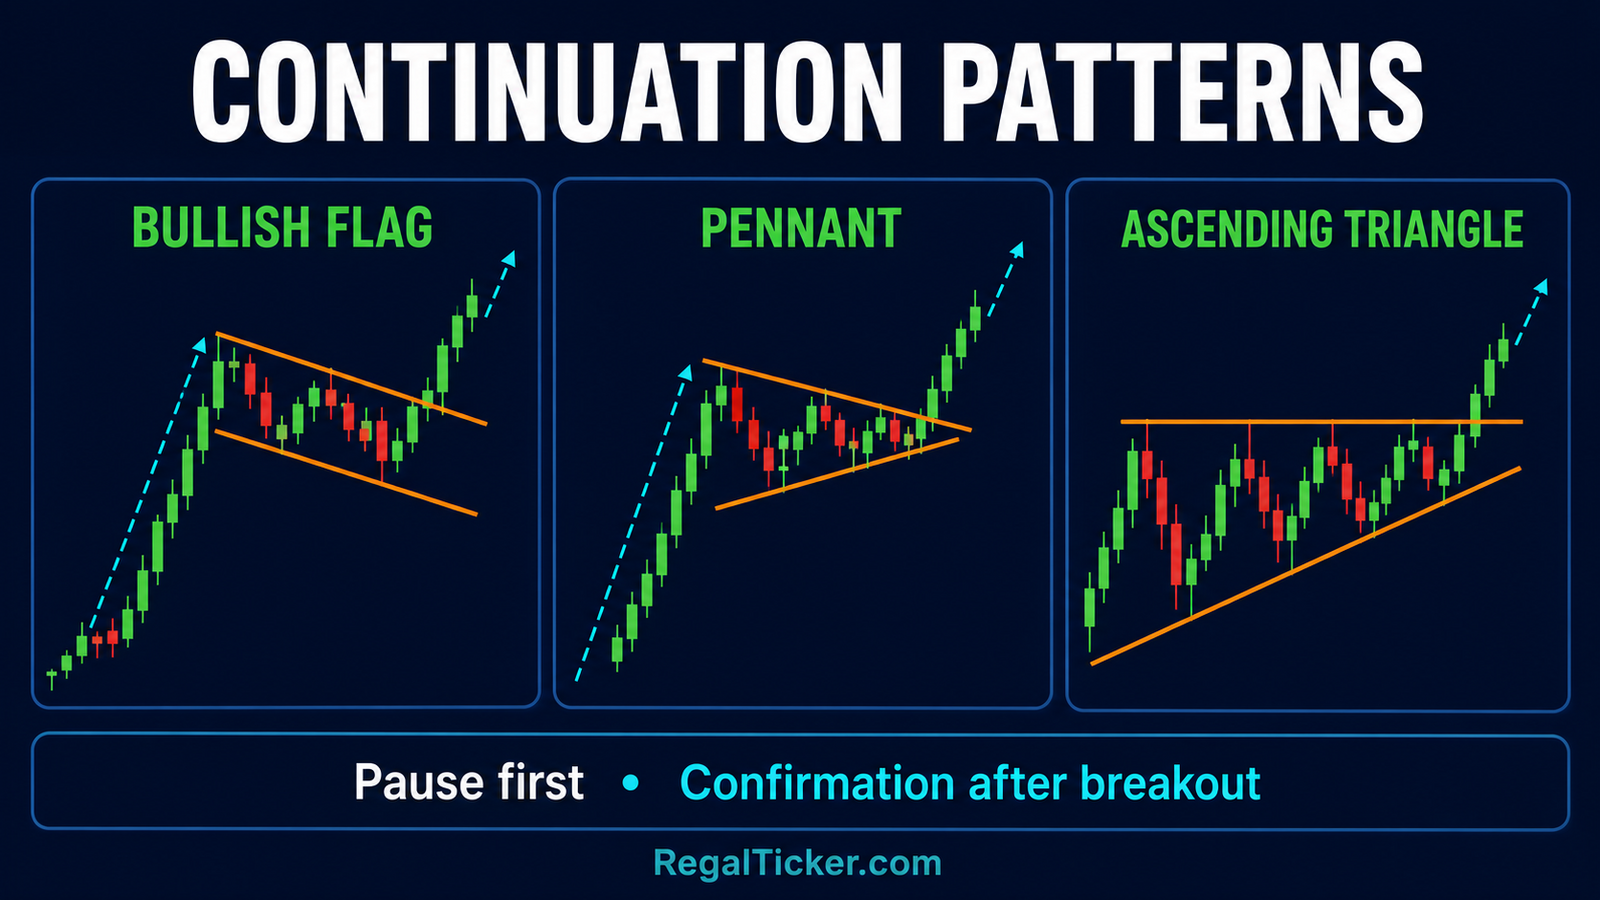
Continuation patterns form when a trend pauses or consolidates. The working idea is that the earlier direction may resume, but the pattern can fail or break the opposite way.
Flag Pattern
A flag begins with a strong directional move called the flagpole, followed by a compact counter-trend channel.
In a bullish flag, price rises sharply and then drifts sideways or modestly lower between roughly parallel boundaries. A breakout above the upper boundary may signal continuation. In a bearish flag, the initial move is downward and the pause typically slopes modestly upward.
A loose range lasting too long, without a clear preceding impulse, may not be a useful flag. The relationship between the pole and consolidation matters more than attaching the label to every small channel.
Pennant Pattern
A pennant also follows a strong directional move, but its consolidation narrows between converging lines rather than parallel boundaries. A break in the original direction can confirm continuation.
Do not confuse every small symmetrical triangle with a pennant. A genuine pennant requires a clear preceding impulse and a relatively compact pause.
Ascending and Descending Triangles
An ascending triangle has a relatively flat resistance area and rising swing lows. Buyers appear willing to enter at progressively higher prices, but the bullish interpretation is not confirmed until resistance breaks.
A descending triangle has flat support and falling swing highs. Selling pressure may be increasing, but confirmation requires a break below support.
Triangles can fail. Price may briefly break a boundary and return inside, or resolve opposite to the textbook expectation. Treat the boundary as a decision area, not a guaranteed launch point.
Bilateral Patterns and Neutral Structures
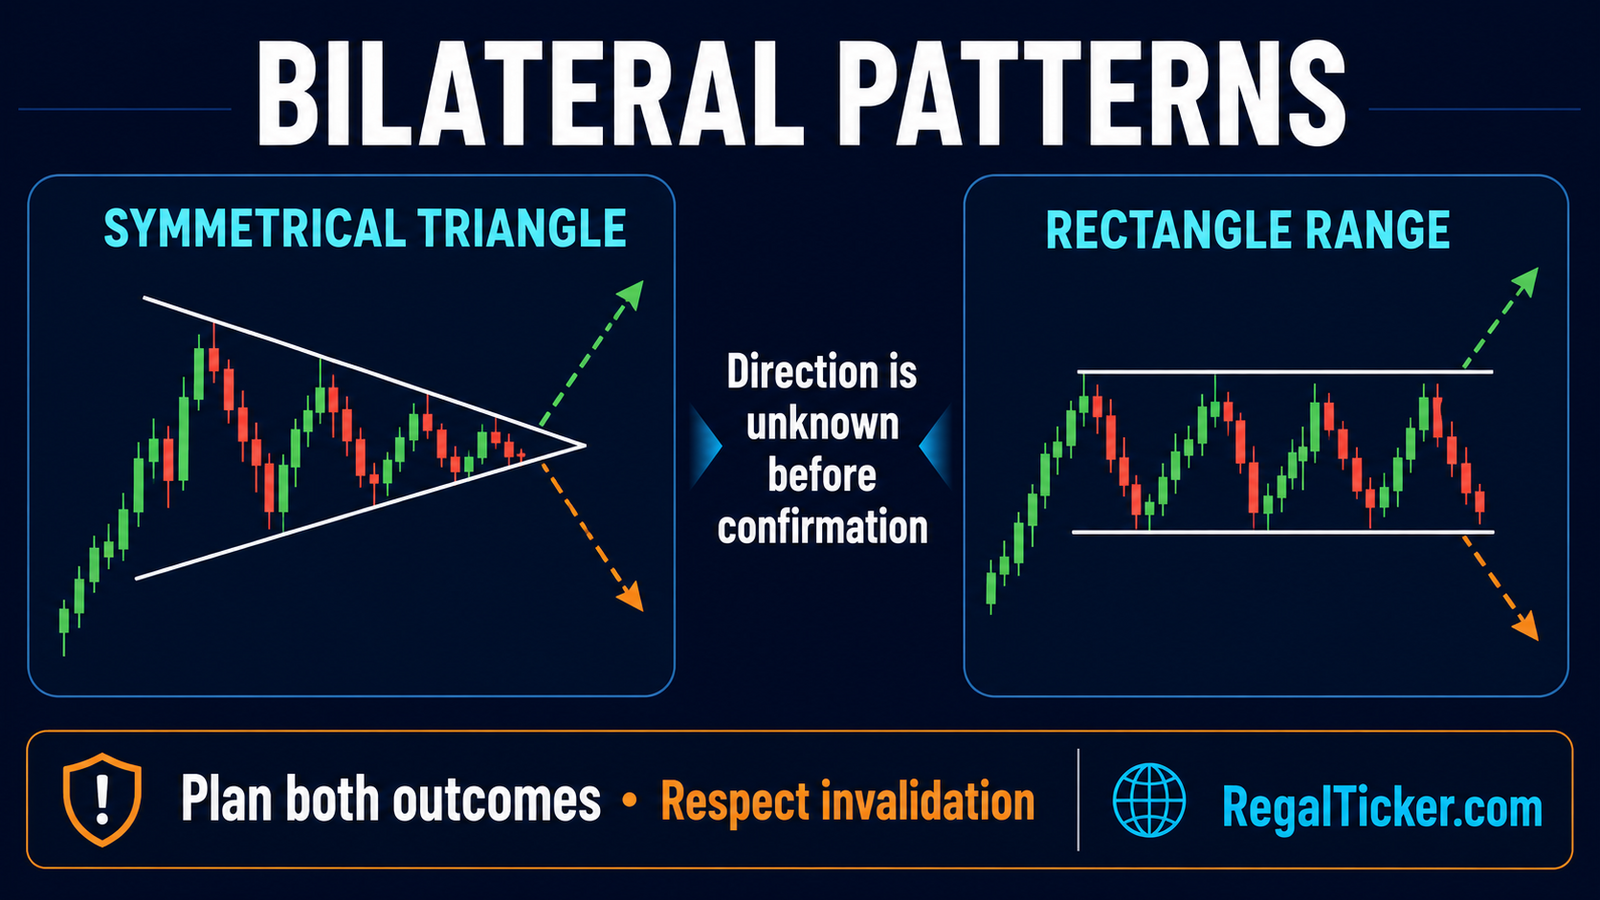
Some formations do not have a reliable directional bias before the break. The analyst should plan both outcomes rather than guess.
Symmetrical Triangle
A symmetrical triangle forms lower highs and higher lows, producing two converging boundaries. Volatility often contracts as price approaches the apex.
It can act as continuation when it develops inside a strong trend, but it can also reverse or fail. The preceding trend supplies context; the breakout supplies direction.
Rectangle Range
A rectangle forms when price repeatedly reacts near horizontal support and resistance. It may be:
- a continuation pause within a trend,
- a distribution or accumulation area,
- or simply a neutral range with no dependable directional edge.
The label should not be decided in advance. A decisive close and follow-through beyond a boundary provide more useful evidence.
Wedges Need Context
Rising and falling wedges are frequently oversimplified. A rising wedge is often described as bearish and a falling wedge as bullish, yet actual outcomes depend on prior trend, placement, slope, volume and breakout direction.
Instead of memorising an arrow, ask where the pattern formed and which boundary price actually breaks.
How to Confirm a Chart Pattern
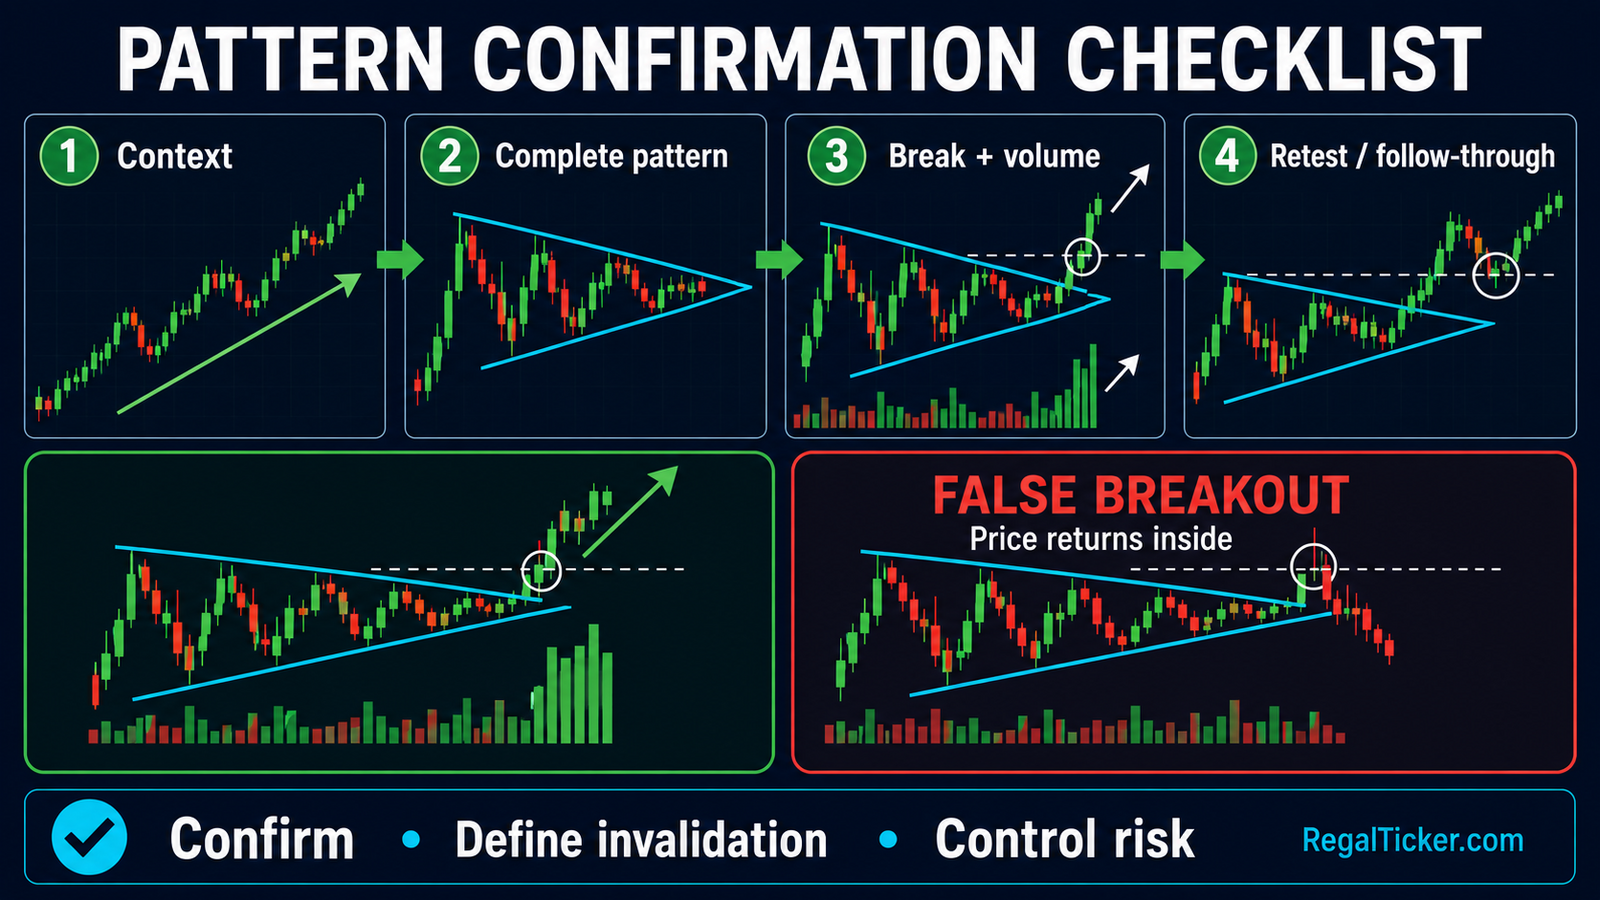
Pattern confirmation is a process, not one candle.
1. Establish Context
Identify the prevailing trend and timeframe. A head and shoulders pattern in the middle of a random range is less meaningful than one that forms after a mature uptrend.
2. Wait for the Pattern to Complete
Do not anticipate a double top before support breaks or call a triangle breakout while price remains inside its boundaries. Early entry may offer a closer price, but it also carries greater uncertainty.
3. Assess the Break
Useful questions include:
- Did price close beyond the boundary or only pierce it briefly?
- Is the breakout candle large relative to recent candles?
- Did participation expand?
- Is there nearby support or resistance blocking follow-through?
- Is the broader market moving in the same or opposite direction?
Volume can support confirmation, but a high-volume break is not infallible. For a deeper explanation of participation, breakouts and confirmation, read Trading Volume in Stock Market: How to Confirm Price Movements.
4. Watch Follow-Through or Retest
Some breakouts continue immediately. Others retest the broken area before moving. A successful retest can add evidence, but not every breakout retests and not every retest holds.
5. Define Invalidation
Invalidation is the price behaviour that proves the pattern interpretation has failed. For example, a breakout that quickly returns inside a triangle and closes there may be a warning. A full move through the opposite boundary is stronger failure evidence.
False Breakouts, Pattern Targets and Risk
Why False Breakouts Occur
A false breakout happens when price crosses a boundary but cannot maintain the move. Causes can include:
- insufficient participation,
- short-term order imbalances,
- news or market-wide volatility,
- a breakout into nearby opposing support/resistance,
- crowded positioning,
- or an unreliable pattern drawn on weak pivots.
Waiting for a close, follow-through or retest can filter some false breaks, but no method removes them.
How Pattern Targets Are Estimated
Traditional analysis often measures the height of a pattern and projects it from the breakout point. For a rectangle ₹20 high, a trader may project ₹20 from the boundary.
This is an estimate, not a promised destination. The projected level can conflict with support/resistance, volatility or changing information. It should never replace an invalidation point or risk limit.
Risk Is More Important Than Pattern Accuracy
Even a well-formed pattern can fail because prices respond to new information. Overnight gaps, illiquidity and market-wide shocks can move price beyond an intended exit.
SEBI’s investor resources warn against guaranteed-return claims and unregistered advisers. Check any recommendation provider through the official SEBI Intermediary Portal, and use the SEBI Investor Support portal for education and verification resources.
Worked Examples
Example 1: Double Top That Is Not Yet Confirmed
A fictional share rises from ₹420 to ₹500, falls to ₹460 and returns to ₹498.
At this point, two peaks exist near ₹500, but the pattern is incomplete. ₹460 is the intervening support. If price falls only to ₹470 and then rises above ₹500, the double-top interpretation has failed.
If price instead closes below ₹460 with stronger participation and cannot reclaim that zone, reversal evidence improves. It still does not guarantee a target.
Example 2: Bullish Flag With a False Break
A share advances from ₹240 to ₹285 and then forms a downward-sloping channel between ₹276 and ₹286. It briefly trades at ₹288 but closes back at ₹282.
The intraday move above ₹286 is not convincing confirmation. If a later close occurs above the boundary with follow-through, the bullish case strengthens. If price breaks below the lower flag boundary, the continuation idea is invalidated.
Example 3: Symmetrical Triangle
Price forms lower highs at ₹820, ₹805 and ₹795, alongside higher lows at ₹740, ₹755 and ₹770.
The narrowing structure does not tell us which side must win. An analyst can define bullish and bearish scenarios in advance, then respond to confirmation rather than guessing near the apex.
Common Chart-Pattern Mistakes
- Seeing a pattern before it has enough swing points.
- Ignoring the trend that existed before the pattern.
- Drawing boundaries through arbitrary candles to improve the shape.
- Treating a brief wick as decisive confirmation.
- Assuming volume guarantees success.
- Entering close to the triangle apex, where the structure may lose significance.
- Using a projected target without defining invalidation.
- Changing the timeframe until the preferred pattern appears.
- Calling every two peaks a double top.
- Risking too much because the chart “looks perfect.”
Practical Pattern Analysis Checklist
Before relying on a pattern, ask:
- What is the higher-timeframe trend?
- Is the formation reversal, continuation or genuinely bilateral?
- Are the boundaries based on meaningful swing points?
- Has the pattern completed?
- What exact behaviour confirms it?
- Does volume support or contradict the move?
- Is there nearby support or resistance?
- What would invalidate the interpretation?
- Is the possible reward reasonable relative to the defined risk?
- Am I treating a probability as certainty?
For order execution after analysis, understand Market Order, Limit Order, Stop-Loss and Stop-Limit Order and Bid Price, Ask Price, Spread and Order Book Explained. A correct chart idea can still suffer from slippage, spread or poor liquidity.
Frequently Asked Questions
Which chart pattern is most reliable?
No pattern is universally most reliable. Performance changes with market, timeframe, liquidity, context, confirmation rules and risk management. Clear structure and disciplined invalidation matter more than a famous name.
Is head and shoulders always bearish?
A standard head and shoulders after an uptrend is a potential bearish reversal. It is not confirmed until the neckline breaks. An inverse head and shoulders after a downtrend is the bullish counterpart.
What is the difference between reversal and continuation patterns?
A reversal pattern suggests the prevailing trend may change. A continuation pattern suggests the trend may resume after a pause. Both need confirmation and can fail.
Is a symmetrical triangle bullish or bearish?
It is generally bilateral. The prior trend offers context, but the confirmed breakout direction determines the active interpretation.
Should I enter before a pattern breaks out?
Entering early increases uncertainty because the pattern may remain incomplete or fail. Waiting for confirmation reduces some uncertainty but may produce a less favourable entry. Neither choice removes risk.
Do chart patterns work without volume?
Patterns can form on price alone, but volume may help judge participation in a breakout. It should support—not replace—price structure, confirmation and risk control.
Conclusion
Chart patterns are best used as structured scenarios. Reversal patterns warn that an existing trend may change; continuation patterns describe a pause that may resolve with the trend; bilateral patterns require the analyst to respect both directions.
Begin with trend and support/resistance, wait for completion, assess the quality of the break and define invalidation before considering any target. A chart pattern is not a promise. Its value comes from turning an uncertain market into a disciplined, testable plan.