
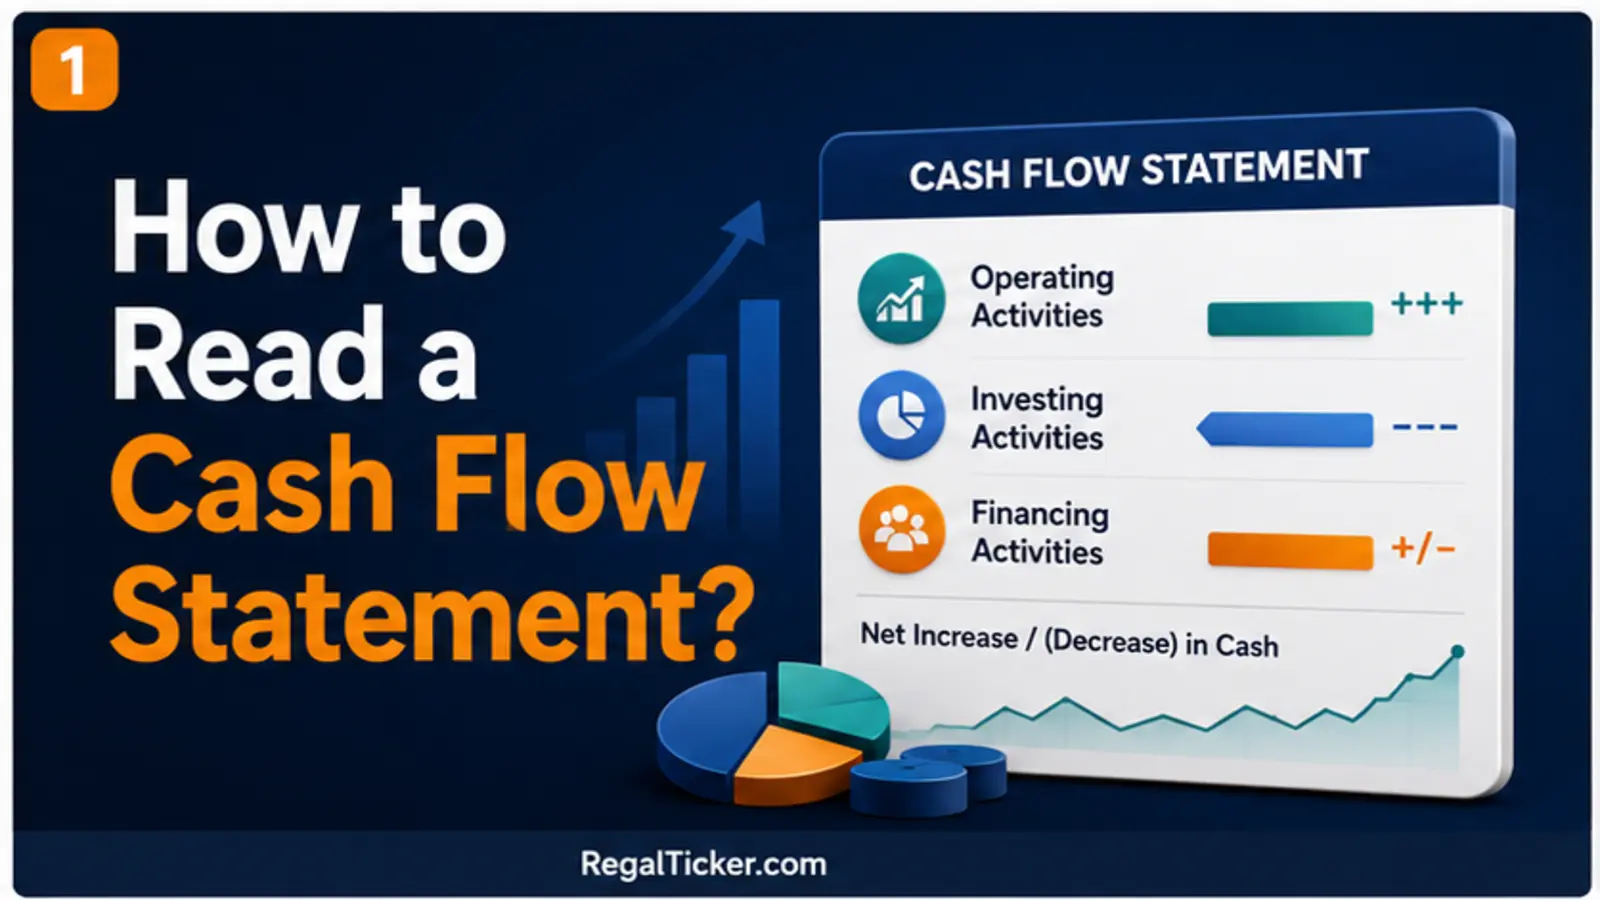
A company can report profit and still face a cash shortage. The cash flow statement helps investors understand why. It records how cash and cash equivalents changed during a period and groups the movements into operating, investing and financing activities.
This statement should be read after the income statement and balance sheet. Together, the three statements reveal profitability, financial position and actual cash movement.
What Is a Cash Flow Statement?
A cash flow statement explains cash generated and used during a reporting period. Its opening cash balance plus the net change in cash should reconcile with the closing cash balance, subject to disclosed treatment of cash equivalents and effects such as exchange-rate movements.
It has three sections:
- Cash flow from operating activities
- Cash flow from investing activities
- Cash flow from financing activities
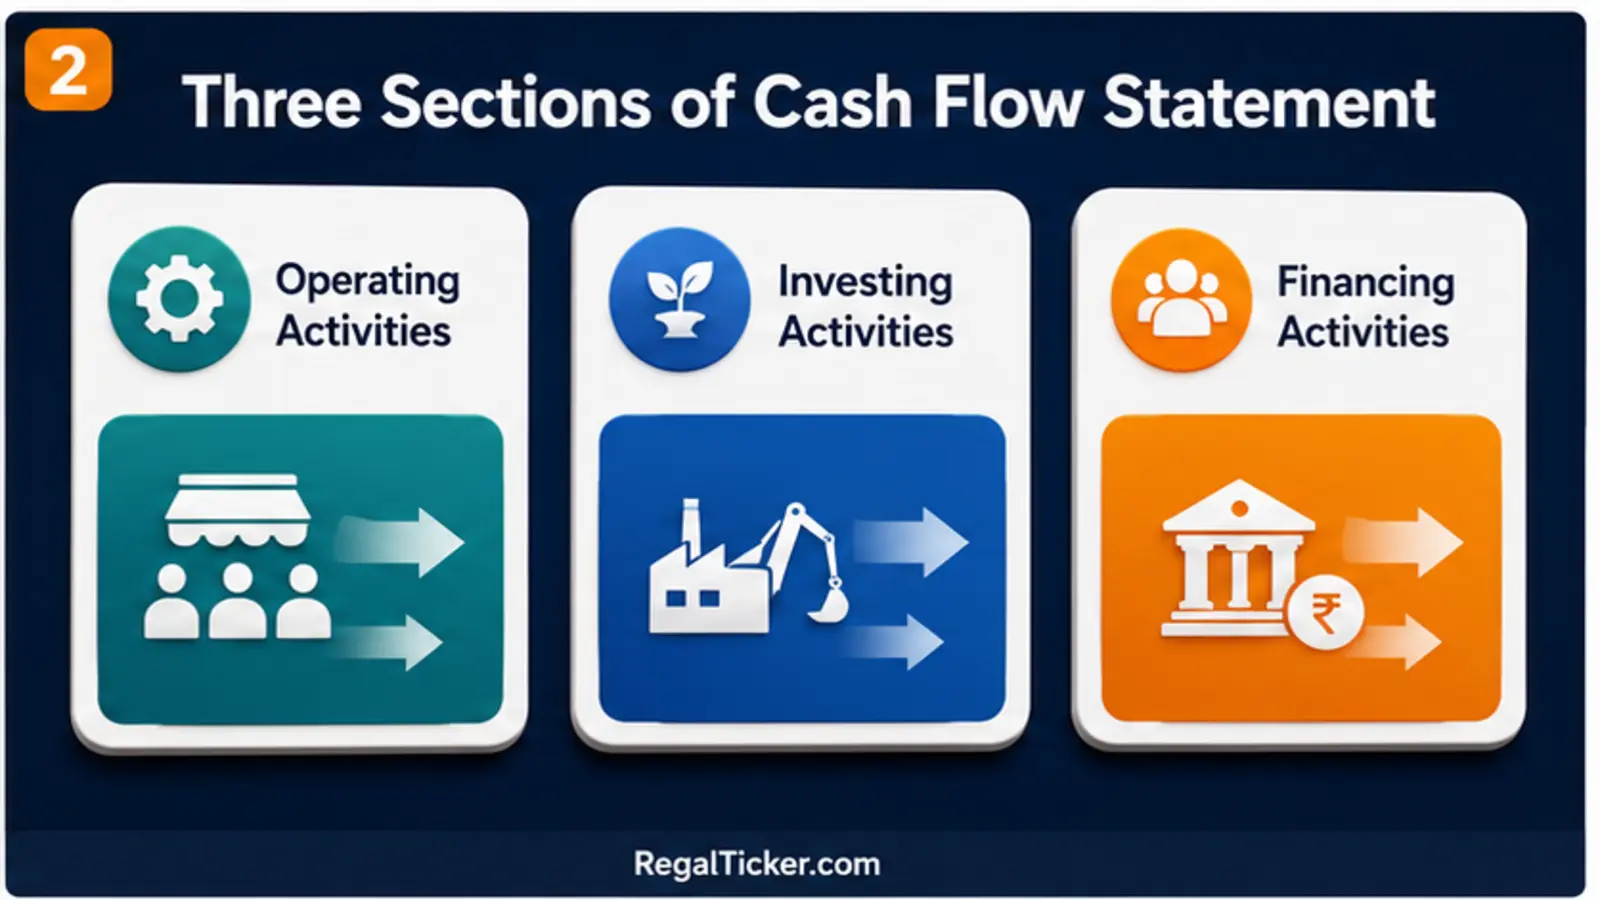
The sign of each section is not automatically good or bad. A growing company may have negative investing cash flow because it is building productive capacity. A mature company may have negative financing cash flow because it repaid debt or returned money to shareholders. Interpretation requires context and trends.
Where to Find the Cash Flow Statement
Use the company’s annual report and audited financial statements for detailed analysis. Listed-company filings are also available through stock exchanges. Check:
- Reporting period and currency units
- Standalone or consolidated basis
- Whether figures are audited
- Direct or indirect method
- Notes explaining cash and cash equivalents
In India, many listed-company statements use the indirect method under Ind AS 7. Under this presentation, operating cash flow begins with profit and adjusts for non-cash items and changes in working capital.
Step 1: Analyse Cash Flow From Operating Activities
Operating cash flow shows how the core business affects cash. Under the indirect method, the statement commonly adjusts profit for:
- Depreciation and amortisation
- Finance costs and interest income
- Gains or losses on asset sales
- Provisions and other non-cash items
- Changes in receivables, inventory and payables
- Taxes paid
Positive operating cash flow over several years suggests the main business is generating cash. One negative year may reflect rapid growth or working-capital timing, but persistent negative operating cash flow needs explanation.
Compare operating cash flow with revenue, profit and margins. If profit rises steadily while operating cash flow remains weak, inspect receivables, inventory, advances and other working-capital items.
Step 2: Read Investing Activities
Investing cash flow covers long-term assets and investments. Typical outflows include:
- Purchase of property, plant and equipment
- Capital work in progress
- Acquisition of businesses
- Purchase of investments
- Loans advanced
Typical inflows include:
- Sale of property or equipment
- Sale or maturity of investments
- Disposal of a subsidiary or business
- Repayment of loans advanced
Negative investing cash flow can be constructive when it represents disciplined capital expenditure with attractive future returns. However, repeated acquisitions, large capital advances or asset purchases without improving revenue and cash generation deserve scrutiny.
Step 3: Understand Financing Activities
Financing cash flow explains changes in debt and owner funding. Common items are:
- Proceeds from borrowings
- Repayment of borrowings
- Issue or buyback of shares
- Lease payments classified as financing
- Interest and dividends, depending on applicable presentation policy
Borrowing produces positive financing cash flow, but it is not operating success. Repaying debt or paying dividends creates negative financing cash flow, which can be healthy if supported by strong operating cash.
Connect this section with debt and equity changes in the balance sheet and with finance cost in the income statement.
Why Profit Is Not the Same as Cash
Profit is measured using accrual accounting. Revenue may be recognised before a customer pays, while expenses can include non-cash charges such as depreciation. Cash flow focuses on actual movements in cash and cash equivalents.
For example, suppose a company reports a sale of ₹100 crore on credit. Revenue and profit may rise, but cash will not arrive until the customer pays. The unpaid amount appears in trade receivables.
Likewise, purchasing machinery uses cash immediately, while its cost may be expensed gradually through depreciation. This difference is why neither profit nor cash flow should be read alone.
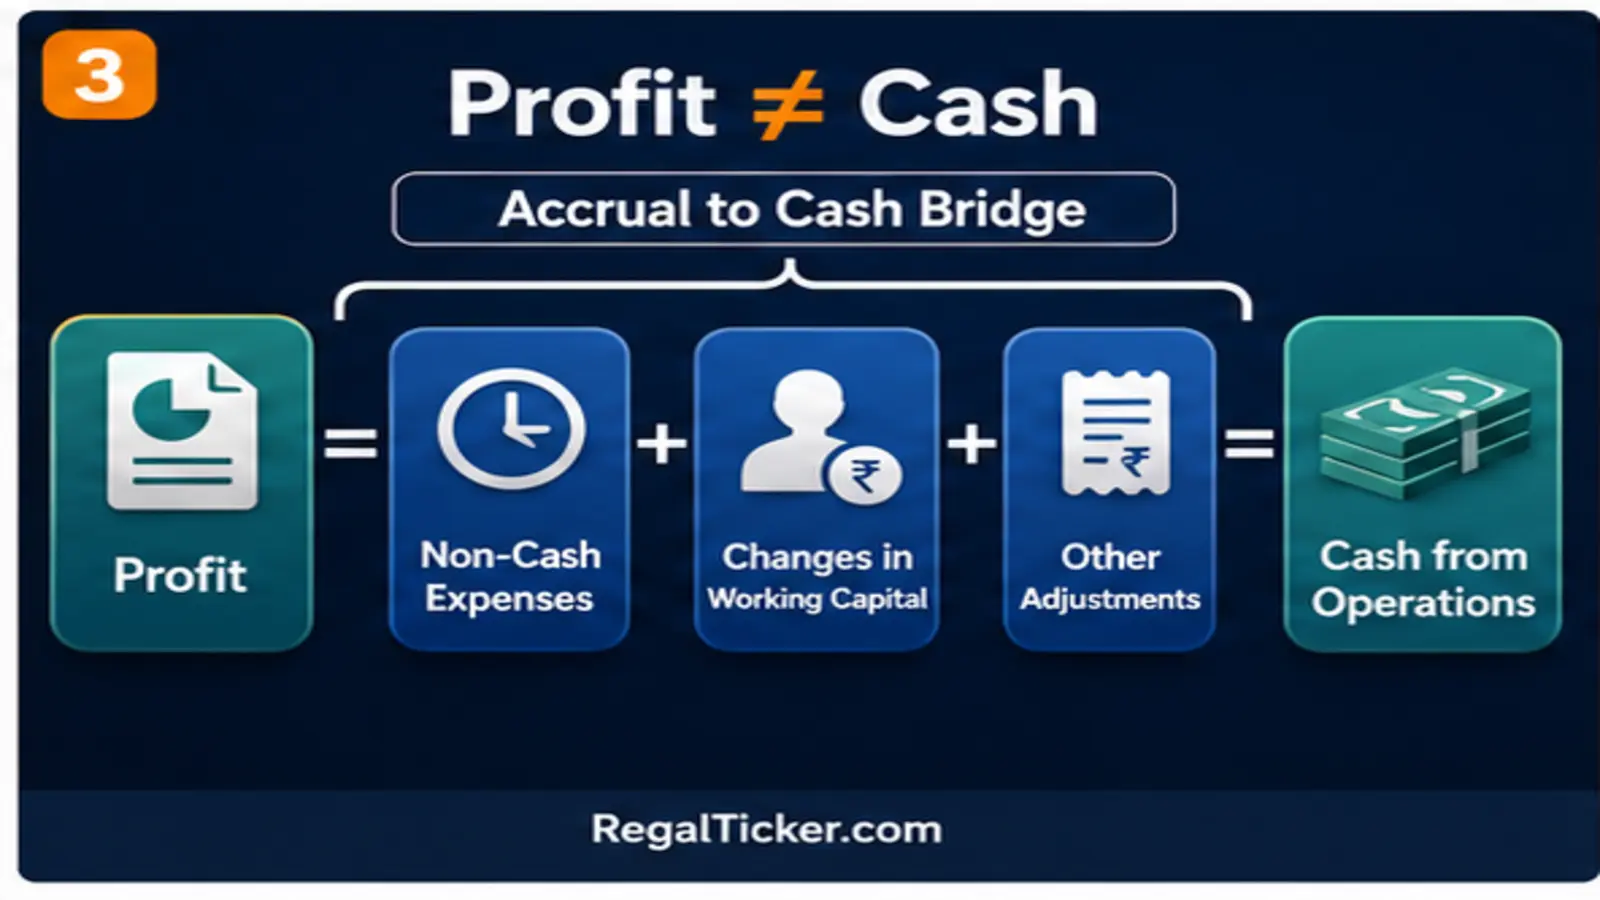
Working Capital: The Bridge Between Profit and Cash
Changes in working capital often explain the gap:
- Receivables increase: cash collection lags recognised revenue.
- Inventory increases: cash is tied up in unsold goods.
- Payables increase: the company retains cash longer by delaying supplier payments.
- Advances and other current items change: cash moves before or after accounting recognition.
An increase in operating cash caused mainly by stretching payables may not be sustainable. Similarly, weak cash conversion caused by temporary inventory built for a new launch may be less worrying than years of unexplained accumulation.
Read these changes alongside the balance sheet rather than interpreting the adjustment line in isolation.
Free Cash Flow
A commonly used simplified measure is:
Free Cash Flow = Operating Cash Flow − Capital Expenditure
Free cash flow estimates cash remaining after funding the capital expenditure needed for the business. Investors use it to assess capacity for debt repayment, dividends, buybacks, acquisitions or further investment.

Free cash flow is not a standardised line item and definitions vary. Some analysts adjust for acquisitions, lease payments, interest or other items. State the formula used and compare like with like.
Negative free cash flow is not automatically bad. A young or expanding company may invest heavily before new assets contribute. The key questions are whether the spending is productive, financially manageable and likely to earn adequate returns.
Useful Cash-Flow Comparisons
Operating cash flow to net profit
Compare cumulative operating cash flow with cumulative net profit across several years. Healthy conversion depends on the industry, but a persistent and unexplained gap is a signal to investigate.
Operating cash flow margin
Operating Cash Flow Margin = Operating Cash Flow ÷ Revenue
This shows how much operating cash is generated per rupee of revenue. Compare trends and industry peers.
Cash flow to debt
Operating cash flow relative to debt helps assess repayment capacity. It should be considered with interest cost, maturity schedules, cash balances and business stability.
Use the Regal Ticker Investor Tools when a relevant calculator is available, and verify every input against the company’s official report.
Cash-Flow Red Flags
Investigate patterns such as:
- Profit rising while operating cash flow repeatedly weakens
- Receivables or inventory absorbing cash year after year
- Regular borrowing needed to cover operating shortfalls
- Asset sales supporting cash while the core business remains weak
- Acquisitions consuming cash without later improvement
- Large unexplained “other” adjustments
- Capital expenditure consistently far above operating cash without a credible funding plan
- Dividend payments financed by new debt
No single sign proves a problem. Read management explanations, notes, auditor observations and several years of data.

A Practical Five-Year Reading Method
Create a simple table for five years containing:
- Revenue
- Net profit
- Operating cash flow
- Capital expenditure
- Free cash flow using one consistent definition
- Total debt
- Closing cash
Then ask:
- Is operating cash flow positive and growing?
- Does cumulative cash broadly support cumulative profit?
- What working-capital items explain differences?
- Is capital expenditure maintaining the business or expanding it?
- How is investment funded—operations, debt or new equity?
- Is financing cash flow reducing or increasing risk?
- Does closing cash agree with the balance sheet?
This method turns a long statement into a connected view of business quality and capital allocation.
Cash Flow Statement vs Income Statement
The income statement answers whether the company recorded a profit during the period. The cash flow statement answers how cash changed and why.
A strong analysis uses both. Review What Is Fundamental Analysis? for the broader framework and Investing vs Trading for why business analysis is especially relevant to long-term investing rather than short-term price speculation.
Frequently Asked Questions
Which cash flow is most important?
Operating cash flow usually deserves first attention because it reflects the core business. Investing and financing cash flows explain how the company deploys and obtains capital.
Is positive cash flow always good?
No. Cash can rise because of borrowing, a share issue or asset sales. Identify the source rather than judging only the net change.
Is negative investing cash flow bad?
Not necessarily. It may indicate productive capital expenditure. Assess the purpose, funding and future returns.
Can cash flow be higher than profit?
Yes. Non-cash expenses, working-capital changes and timing differences can make operating cash flow higher or lower than profit.
What is the difference between operating cash flow and free cash flow?
Operating cash flow reflects cash from operations. A common free-cash-flow calculation subtracts capital expenditure from operating cash flow.
Conclusion
To read a cash flow statement, begin with operating cash generation, identify the working-capital bridge from profit, understand investment spending and then study how the company raises or returns capital.
Never judge one year or one section alone. Compare several periods, reconcile closing cash with the balance sheet and connect cash generation with the income statement. Continue with How the Three Financial Statements Are Connected to see how profit, retained earnings, working capital, capital expenditure, debt and closing cash flow through the income statement, balance sheet and cash flow statement together.
Official references: SEBI Investor—Due Diligence and NSE Financial Statement Analysis.