
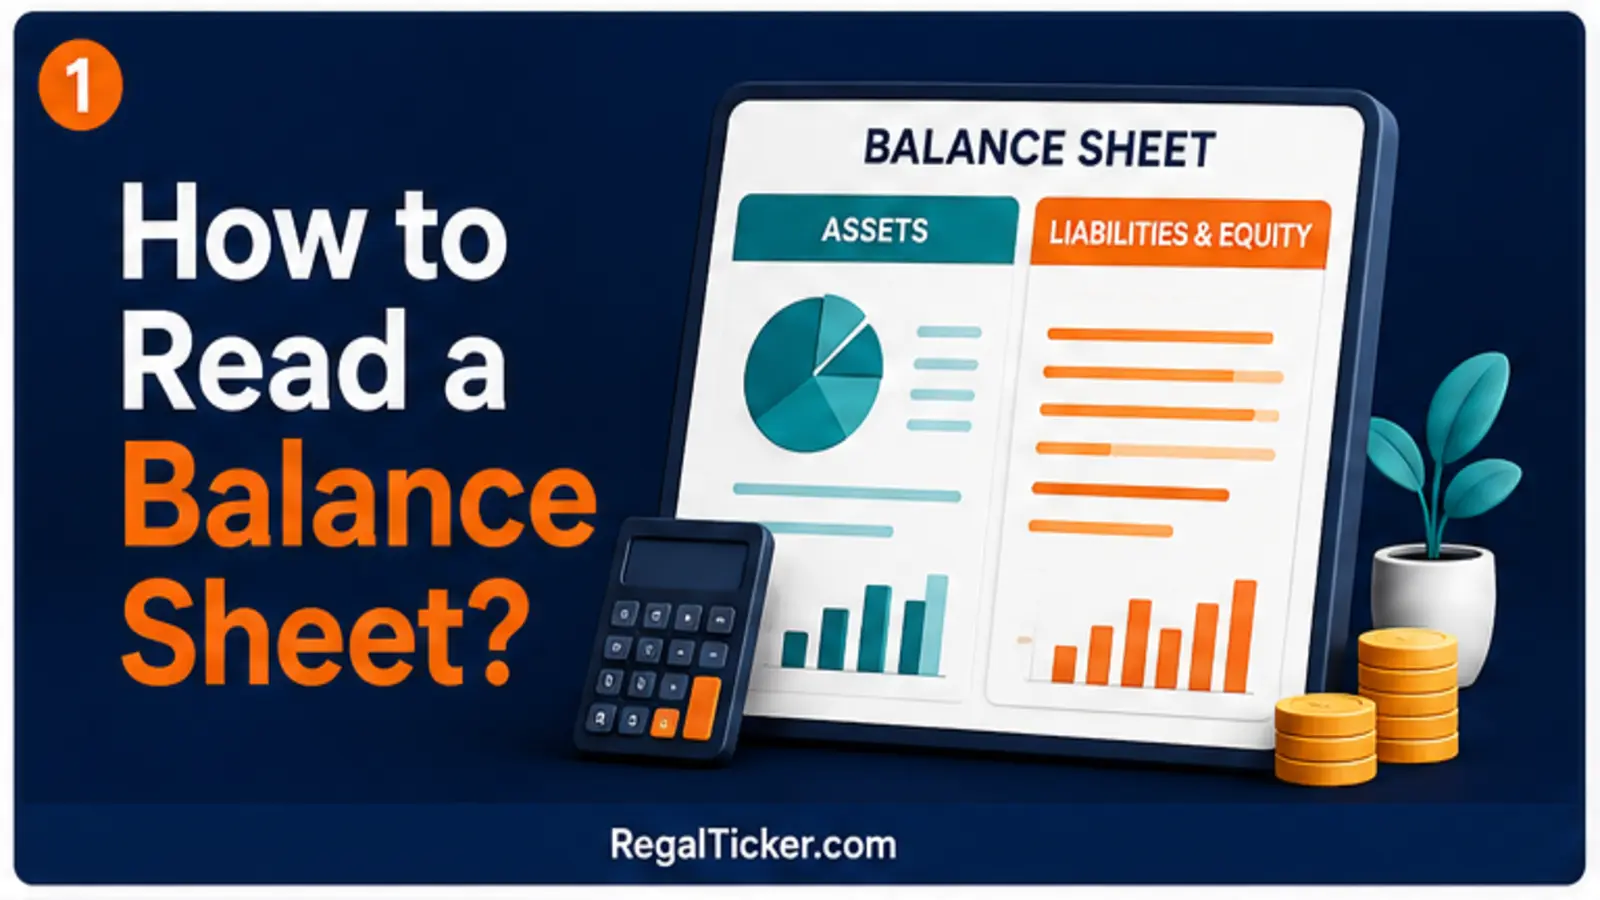
A balance sheet shows what a company owns, what it owes and what remains for shareholders on a particular date. It is one of the three main financial statements used in fundamental analysis, alongside the income statement and cash flow statement.
For a beginner, the long list of accounting terms can look intimidating. The practical approach is simpler: understand the accounting equation, read each major section, compare several years and then ask whether the company’s financial position is becoming stronger or weaker.
This guide explains that process step by step. It is educational, not a recommendation to buy or sell any security.
What Is a Balance Sheet?
A balance sheet is a snapshot of a company’s financial position at a specific date, such as 31 March 2026. Unlike an income statement—which measures revenue, expenses and profit over a period—the balance sheet reports closing amounts on one date.
It contains three broad parts:
- Assets: resources controlled by the company.
- Liabilities: obligations the company must settle.
- Shareholders’ equity: the owners’ residual interest after liabilities.
The central relationship is:
Assets = Liabilities + Shareholders’ Equity
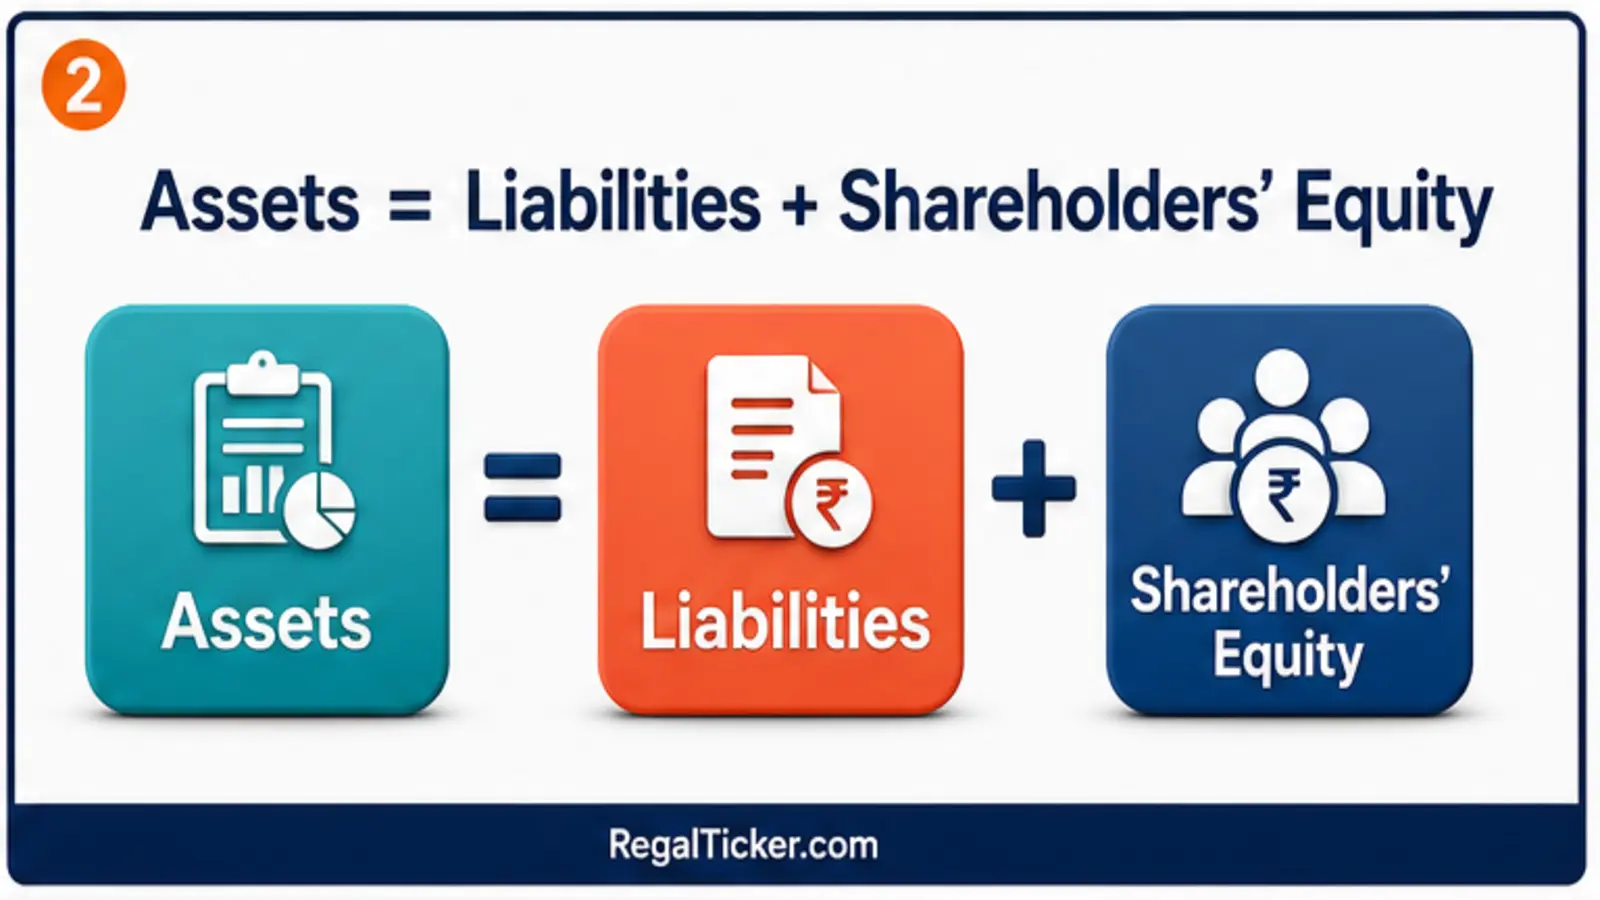
If a company reports ₹1,000 crore of assets and ₹600 crore of liabilities, its shareholders’ equity is ₹400 crore. The statement balances because the resources on one side have been financed either by creditors or owners.
Where Can Investors Find a Company’s Balance Sheet?
Listed companies publish financial results and annual reports on their websites and through stock-exchange filings. Prefer the audited annual financial statements for detailed study, while using quarterly or half-yearly results for recent changes.
Check whether you are reading:
- Standalone statements, covering the parent company alone; or
- Consolidated statements, combining the parent and its controlled subsidiaries.
For a group with important subsidiaries, consolidated figures usually present the broader economic picture. Always read the heading, reporting date, units—rupees, lakhs or crores—and comparative previous-period column.
SEBI’s investor guidance recommends examining the balance sheet, income statement and cash flow statement for at least two years as part of company due diligence. Longer comparisons are usually more informative than one isolated year.
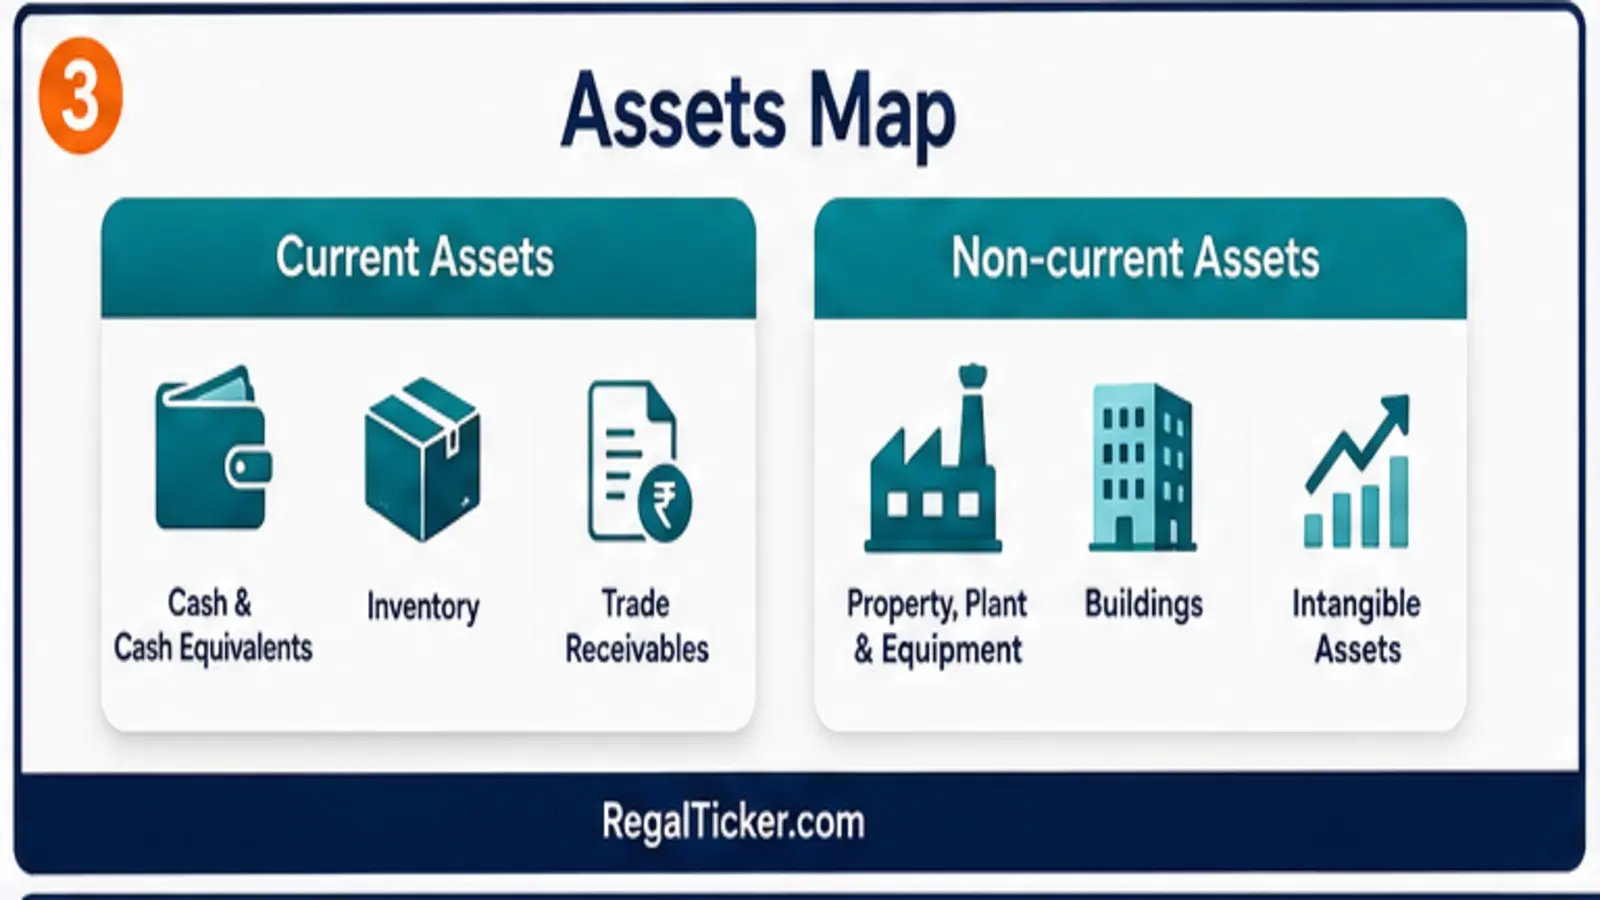
Step 1: Start With Total Assets
Assets are usually classified as current and non-current.
Current assets
Current assets are expected to be realised, sold or consumed during the normal operating cycle or within roughly twelve months. Common items include:
- Cash and cash equivalents
- Bank balances
- Trade receivables
- Inventories
- Short-term investments
- Other current financial assets
Cash is readily usable, but inventory and receivables need closer examination. Fast-rising receivables can mean customers are taking longer to pay. Rising inventory may reflect expansion, weak sales or obsolete stock. Context matters.
Non-current assets
Non-current assets support the business over a longer period. They may include:
- Property, plant and equipment
- Capital work in progress
- Intangible assets and goodwill
- Long-term investments
- Deferred tax assets
- Long-term loans and other financial assets
An asset-heavy manufacturer naturally has more plant and equipment than an asset-light software business. Compare a company with its own history and suitable peers rather than applying one standard to every sector.
Step 2: Read Liabilities Carefully
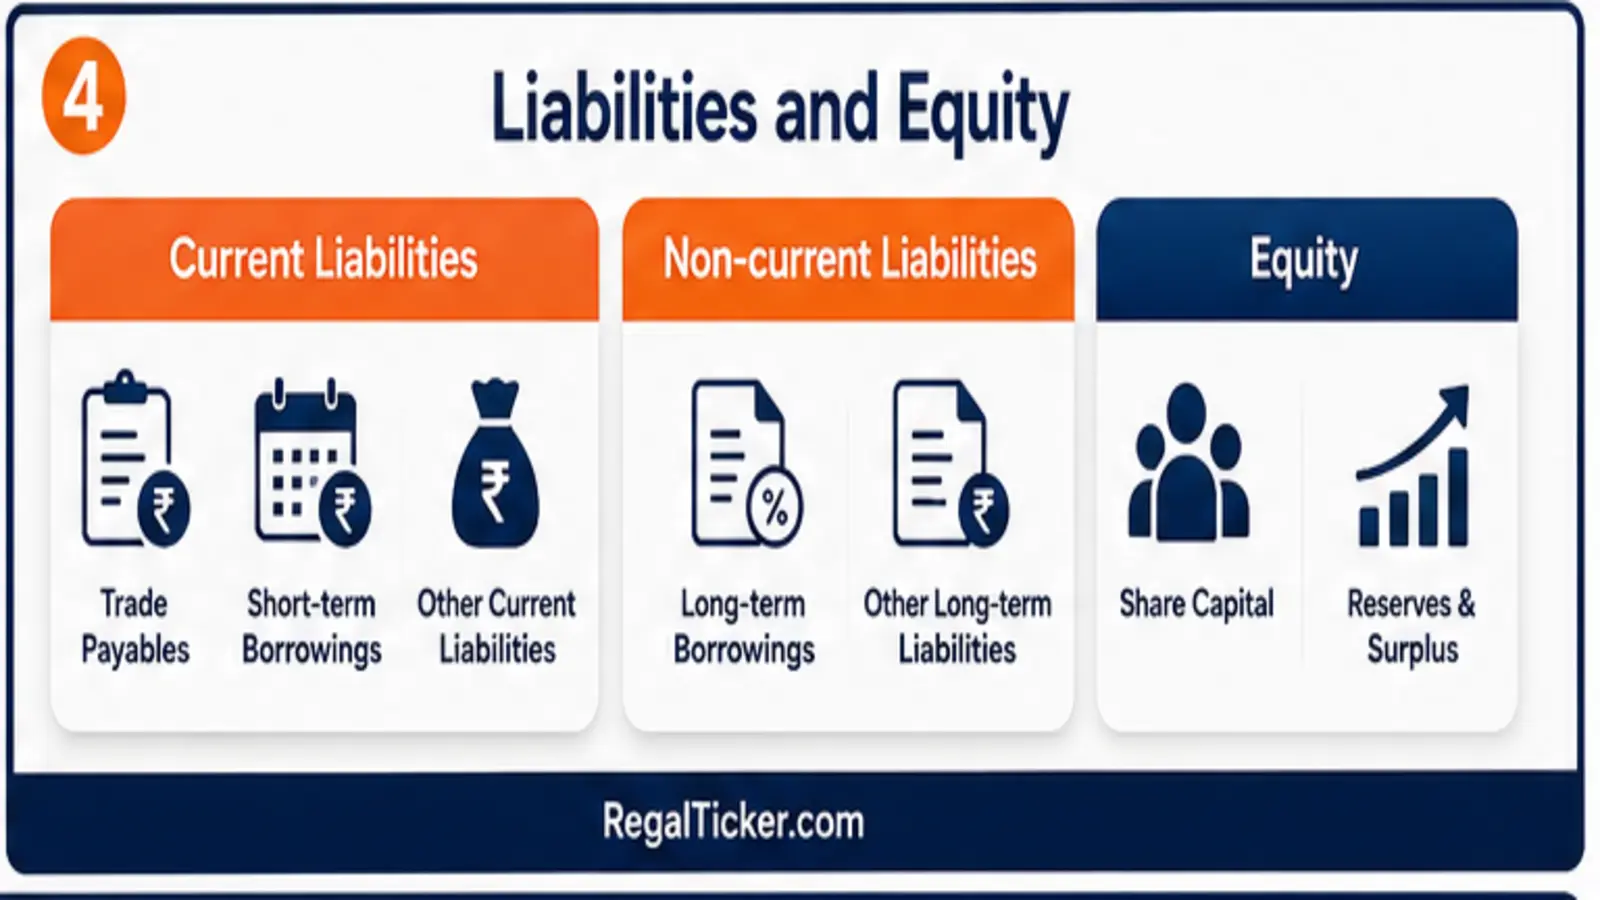
Liabilities are also divided into current and non-current categories.
Current liabilities
These generally fall due within the normal operating cycle or twelve months. Examples include:
- Trade payables
- Short-term borrowings
- Current maturities of long-term debt
- Employee and tax liabilities
- Other current financial liabilities
Compare current liabilities with current assets, but do not assume that a higher current-liability figure is automatically dangerous. Businesses with fast cash collection and strong supplier credit can operate with lower working capital.
Non-current liabilities
These are longer-term obligations, including:
- Long-term borrowings
- Lease liabilities
- Deferred tax liabilities
- Long-term provisions
- Other non-current financial liabilities
Debt deserves special attention. Check the amount, maturity, interest cost, security and whether borrowing is rising faster than the company’s operating capacity. The notes to accounts often contain information that the face of the balance sheet cannot show.
Step 3: Understand Shareholders’ Equity
Equity commonly includes:
- Equity share capital
- Other equity, including retained earnings and reserves
- Securities premium
- Items accumulated through other comprehensive income
- Non-controlling interests in consolidated accounts
Share capital alone does not represent the market value of the company. Market capitalisation is based on the market price of outstanding shares, while book equity is an accounting amount.
Retained earnings are profits kept in the business after distributions and adjustments. A sustained rise can indicate accumulated profitability, but investors should check whether that accounting profit is also producing operating cash.
Step 4: Calculate Working Capital and Liquidity
Working Capital = Current Assets − Current Liabilities
Positive working capital can indicate short-term financial capacity, but the correct level varies by business model. Too much inventory or slow receivables can make reported working capital look healthier than it really is.
Two commonly used ratios are:
Current Ratio = Current Assets ÷ Current Liabilities
Quick Ratio = (Current Assets − Inventory and less-liquid items) ÷ Current Liabilities
Do not treat a single ratio threshold as a universal rule. Compare the ratio with previous years, direct competitors and the company’s operating cycle.
Step 5: Examine Debt and Solvency
A basic leverage measure is:
Debt-to-Equity Ratio = Interest-bearing Debt ÷ Shareholders’ Equity
Higher leverage can magnify shareholder returns when business conditions are favourable, but it can also increase interest burden and financial risk. Review debt together with:
- Finance cost from the income statement
- Operating cash flow from the next lesson
- Debt maturity schedule
- Interest coverage
- Currency exposure
- Assets pledged as security
Banks and financial companies require sector-specific analysis because borrowings are integral to their business model. A debt ratio meaningful for a manufacturer may be misleading for a bank.
Step 6: Compare Trends, Not Just Totals
Read at least three to five years when data is available. Ask:
- Are receivables growing faster than revenue?
- Is inventory rising while sales growth slows?
- Is debt funding productive assets or covering recurring cash shortages?
- Is cash increasing because of operations, asset sales or new borrowing?
- Is equity growing through retained profits or repeated dilution?
- Is capital work in progress converting into productive assets?
Trend analysis turns the balance sheet from a static statement into a story about capital allocation and financial discipline.
Important Balance-Sheet Red Flags
No item proves misconduct or poor quality by itself, but these patterns deserve investigation:
- Receivables or inventory repeatedly growing faster than sales
- Large unexplained related-party balances
- Persistent increase in short-term borrowing
- Falling cash alongside rising debt
- Large goodwill or intangible assets after acquisitions
- Frequent equity dilution without improving operations
- Contingent liabilities that are material relative to net worth
- Major differences between standalone and consolidated positions
Read the notes, auditor’s report and management discussion before reaching a conclusion.
Balance Sheet vs Income Statement
The balance sheet is a snapshot at one date. The income statement reports performance over a period. They connect: profit can increase retained earnings, depreciation reduces asset carrying values, borrowing raises cash and liabilities, and dividends reduce cash and equity.
That is why a balance sheet should never be analysed alone. First revisit profit and margins, then read the income statement, and next learn how the cash flow statement explains movements in cash.
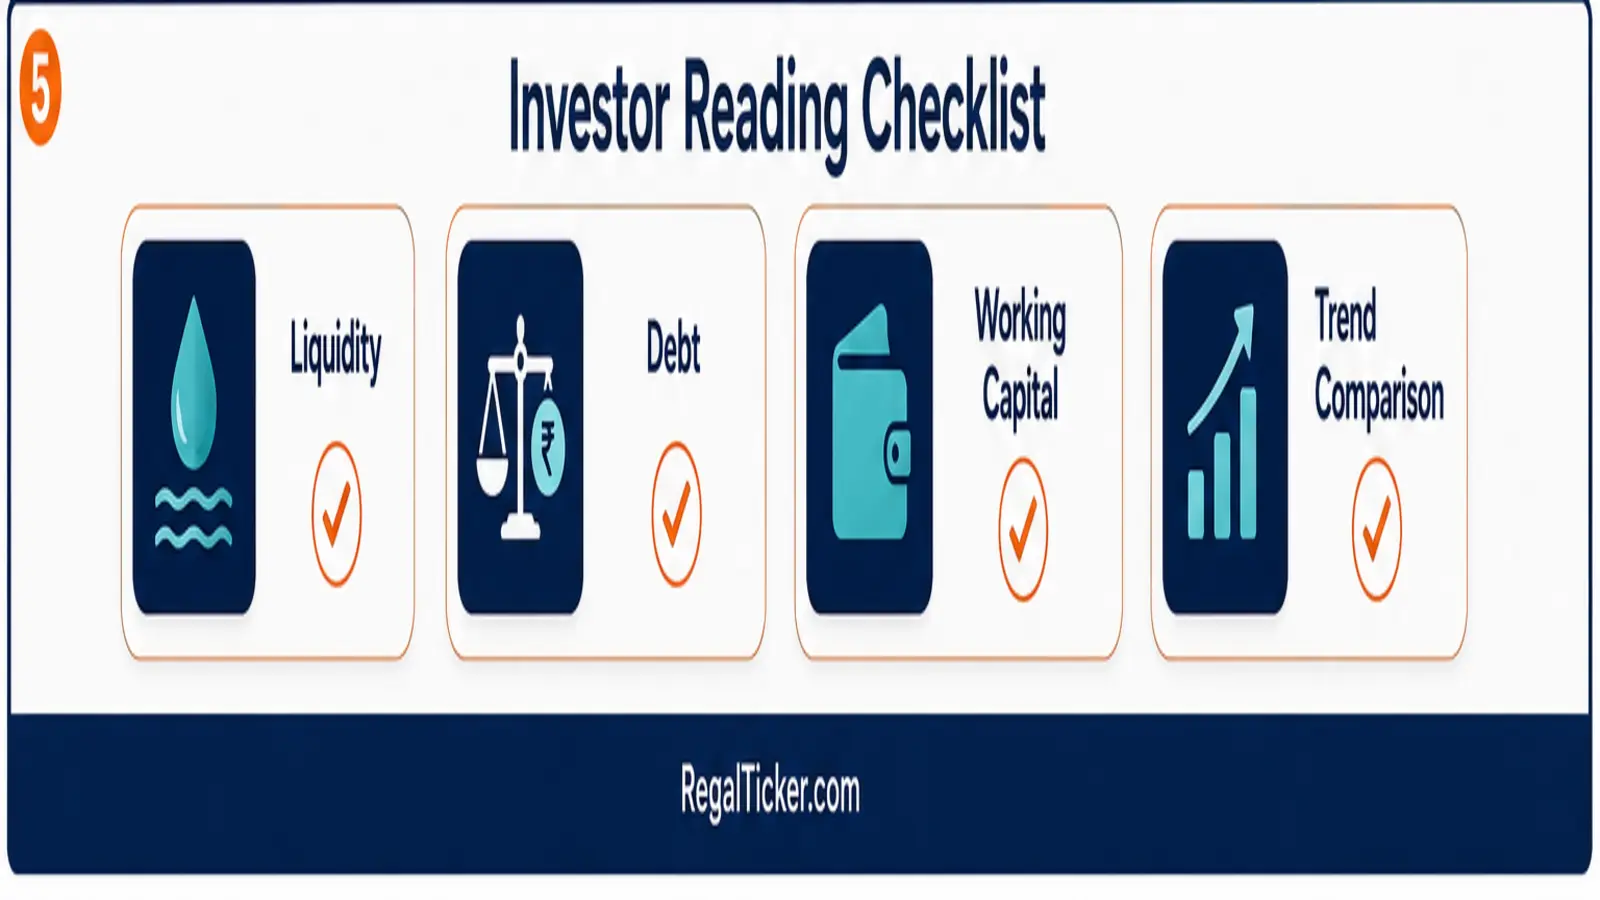
A Simple Beginner Checklist
Before finishing your review:
- Confirm the reporting date, units and standalone/consolidated basis.
- Verify that assets equal liabilities plus equity.
- Break assets into cash, receivables, inventory and long-term assets.
- Separate short-term obligations from long-term debt.
- Examine working capital and liquidity trends.
- Compare debt with equity, profit and cash generation.
- Read notes for contingencies, pledges and related parties.
- Compare several years and relevant peers.
- Connect the findings with the income statement and cash flow statement.
You can explore the Regal Ticker Investor Tools when a relevant ratio calculator or analysis tool is available, but always verify inputs against the company’s official filing.
Frequently Asked Questions
What is the first thing to check in a balance sheet?
Confirm the date, units and whether the statement is standalone or consolidated. Then review the accounting equation and major movements in assets, liabilities and equity.
Is a debt-free balance sheet always better?
Not necessarily. Sensible debt can fund productive expansion, while excessive or poorly serviced debt adds risk. Judge debt relative to business stability, returns, interest cost and cash flow.
Why can a profitable company have a weak balance sheet?
It may have high debt, slow receivables, obsolete inventory, weak liquidity or accumulated acquisition goodwill. Profit is only one part of financial health.
Are balance-sheet values equal to market values?
Usually not. Many assets are recorded under accounting rules, while market capitalisation reflects the current quoted share price and shares outstanding.
Conclusion
Reading a balance sheet is not about memorising every line item. It is about understanding what the company owns, how those resources are financed, whether short-term obligations are manageable and whether financial strength is improving.
Use the accounting equation as your anchor, compare multiple periods and connect every balance-sheet conclusion with profit and cash flow. Continue with How to Read a Cash Flow Statement to see whether reported profit is converting into cash.
Official references: SEBI Investor—Due Diligence and NSE Financial Statement Analysis.