⚡ Quick answer
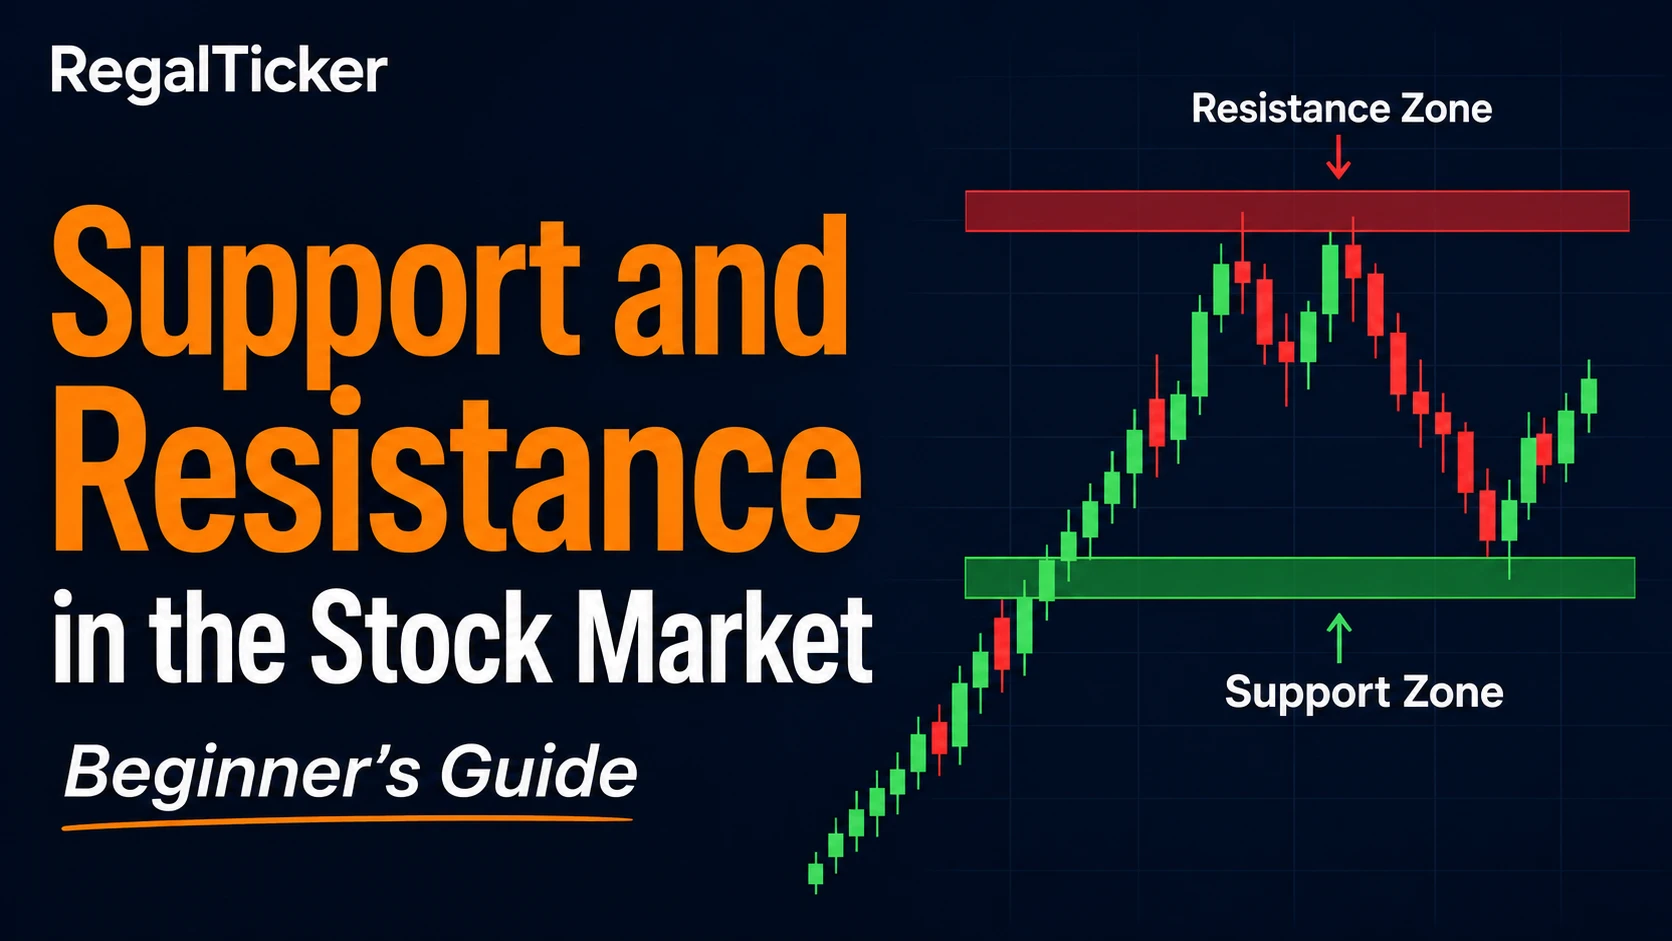
Support and resistance in stock market are price zones where a move may slow, pause, reverse or break through. Support is usually an area below the current price where buying interest may appear. Resistance is usually an area above the current price where selling interest may appear. These levels are not guaranteed and should normally be treated as zones rather than exact prices.
Investor note
Key Takeaways
Support is a zone where falling price may meet stronger buying interest. Resistance is a zone where rising price may meet stronger selling interest. Previous swing highs and swing lows are common starting points. Support and resistance are usually zones, not one exact price. A broken resistance zone may later act as support, and broken support may later act as resistance. Breakouts can fail, so volume, closing-price confirmation, retests and risk management matter.
What is support and resistance in the stock market?
Support and resistance are among the most important ideas in technical analysis.
When price falls toward an area where buyers previously became active, that area may act as support. When price rises toward an area where sellers previously became active, that area may act as resistance.
The words “support” and “resistance” describe price behaviour—not permanent barriers.
A support zone may slow a decline, produce a bounce or eventually break. A resistance zone may slow an advance, cause rejection or eventually break.
Readers should first understand what technical analysis is and how to read candlestick charts, because support and resistance are identified visually from price charts.
Support meaning in simple words
Support is a price area below the current market price where buying interest may increase.
Imagine a stock falling from ₹120 toward ₹100. During previous declines, buyers repeatedly entered near ₹100 and price moved higher.
The ₹98–₹102 area may therefore be treated as a support zone.
Support does not mean the price must rise. It means the area has previously attracted demand and deserves attention.
Resistance meaning in simple words
Resistance is a price area above the current market price where selling interest may increase.
Suppose a stock repeatedly rises toward ₹150 but fails to remain above it. Sellers appear near ₹148–₹152 and price moves lower.
That area may be treated as a resistance zone.
Resistance does not mean price can never move higher. It means the area has previously attracted supply or profit-taking.

Why do support and resistance zones form?
Support and resistance can form because market participants remember important price areas.
Traders and investors may react near:
- previous buying prices,
- previous selling prices,
- earlier highs or lows,
- round numbers,
- breakout points,
- trendlines,
- or widely followed moving averages.
These reactions can create visible areas where price slows or changes direction.
Market psychology also matters.
A trader who missed an earlier buying opportunity may wait for price to return to the same zone. A holder who experienced a decline from a previous high may sell when price returns to that area. These decisions can create repeated reactions.
How to identify support and resistance
To identify support and resistance, use a simple chart-based process rather than guesswork. Start with the clearest price reactions, then refine them into practical zones.
Step 1: Choose a clear timeframe
Begin with a daily chart if you are learning. Daily charts are usually cleaner than very short intraday charts.
A support zone on a weekly chart may be more significant than a zone visible only on a one-minute chart.
Step 2: Zoom out
Look at enough historical price movement to see major highs, lows and ranges.
Zooming in too closely can make every small reaction look important.
Step 3: Mark obvious swing lows
A swing low is a visible low where price stopped falling and moved higher.
Repeated swing lows in a similar area may help identify support.
Step 4: Mark obvious swing highs
A swing high is a visible high where price stopped rising and moved lower.
Repeated swing highs in a similar area may help identify resistance.

Step 5: Convert lines into zones
Do not assume every reaction must occur at one exact price.
If price reacted at ₹99, ₹101 and ₹100.50 on different occasions, the useful support may be a zone around ₹99–₹102 rather than a single line at ₹100.
Step 6: Remove weak or unnecessary levels
A chart with too many lines becomes confusing.
Keep the clearest levels that produced meaningful reactions.
Support and resistance: line or zone?
Beginners often ask whether support and resistance should be drawn as a line or a zone.
A thin line may be useful for visual reference, but a zone is usually more realistic.
Price may:
- briefly move through a level,
- create a wick beyond it,
- close near it,
- or reverse slightly above or below it.

Example
Suppose price reacted at:
- ₹198.50,
- ₹200,
- and ₹201.20.
Instead of drawing three separate lines, you may mark a support zone from approximately ₹198 to ₹202.
⚠ Important warning
Do not make zones too wide
A zone that covers a very large part of the chart becomes meaningless. Use the narrowest reasonable area that contains the important reactions.
Swing highs and swing lows
Swing highs and swing lows are essential for identifying market structure.
Swing high
A swing high is a local peak surrounded by lower prices.
It may become:
- resistance,
- a breakout level,
- or a reference point for a downtrend.
Swing low
A swing low is a local bottom surrounded by higher prices.
It may become:
- support,
- a breakdown level,
- or a reference point for an uptrend.
Support and resistance are therefore closely connected with trend analysis.
An uptrend often creates higher swing highs and higher swing lows. A downtrend often creates lower swing highs and lower swing lows.
What makes a support or resistance zone stronger?
No zone is guaranteed, but some zones attract more attention than others.

1. Multiple clear reactions
A level that produced several visible reactions may be more important than one created by a single small candle.
However, repeated testing can also weaken a level because available buying or selling orders may gradually be absorbed.
2. Higher timeframe
Daily, weekly and monthly zones are often watched by more market participants than very short-term levels.
3. Strong departure
A zone becomes more noticeable when price moved away from it sharply.
4. Volume
Higher trading volume near a breakout, rejection or reversal may show stronger participation.
5. Confluence
A zone may attract more attention when it also aligns with:
- a trendline,
- a moving average,
- a previous breakout,
- or a round-number price.
Confluence means several pieces of evidence point toward the same area. It does not create certainty.
Round-number support and resistance
Round numbers such as ₹100, ₹500 or ₹1,000 can attract attention because traders naturally place orders around memorable prices.
These levels are sometimes called psychological levels.
A round number should not be treated as support or resistance without chart evidence. It becomes more useful when previous price reactions also appear nearby.
Previous highs and lows
Previous highs and lows are among the simplest support-and-resistance references.
- A previous high may act as resistance when price approaches from below.
- A previous low may act as support when price approaches from above.
These levels are useful because they are visible to many chart users.
Support becomes resistance
When support breaks decisively, it may later act as resistance.
This is called role reversal.
Suppose ₹200 acted as support several times. Price then closes below ₹200 and moves toward ₹185.
If price later returns toward ₹200, sellers may appear there and the old support zone may become resistance.
Resistance becomes support
When resistance breaks decisively, it may later act as support.
Suppose ₹300 acted as resistance. Price breaks above it, closes strongly and moves to ₹325.
If price later returns toward ₹300, buyers may enter and the old resistance zone may become support.

Role reversal is common in technical-analysis education, but it does not occur every time.
What is a breakout?
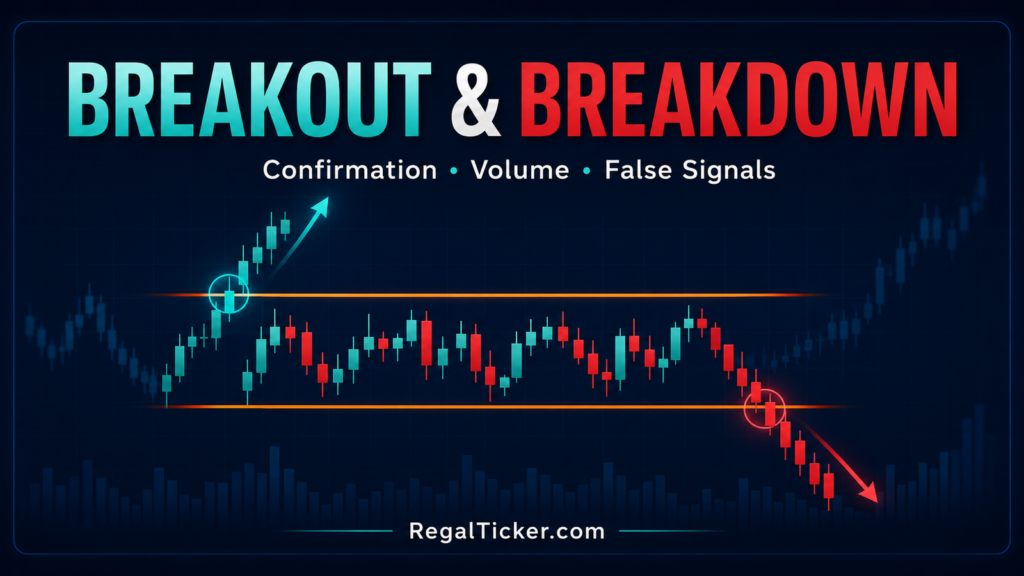
A breakout occurs when price moves beyond a resistance zone or below a support zone.
Breakout above resistance
Price moves above a resistance zone and attempts to establish a new higher range.
Breakdown below support
Price moves below a support zone and attempts to establish a new lower range.
A breakout is more meaningful when it includes:
- a clear close beyond the zone,
- increased volume,
- strong candle structure,
- and follow-through in later periods.
⚠ Important warning
A wick is not always a confirmed breakout
Price may briefly move beyond a zone during the period but close back inside it. Many traders wait for a candle close and later confirmation instead of reacting to the first wick.
What is a retest?
After a breakout, price may return to the old zone.
This return is called a retest.

💡 Real example
Simple example
1. Resistance exists near ₹500. 2. Price closes above ₹500. 3. Price rises to ₹525. 4. Price returns toward ₹500. 5. Buyers appear and price rises again.
The old resistance has acted as support during the retest.
A retest can help confirm role reversal, but price may continue without retesting or may fail after the retest.
What is a false breakout?
A false breakout occurs when price moves beyond support or resistance but quickly returns inside the earlier range.

Example of a false breakout above resistance
- Resistance zone: ₹248–₹252
- Price trades at ₹255
- The candle closes back at ₹249
- Later candles move lower
The move above resistance did not hold.
Why false breakouts happen
False breakouts may occur because of:
- temporary order imbalance,
- low liquidity,
- news-driven volatility,
- stop-loss triggering,
- weak participation,
- or aggressive traders entering too early.
Breakout confirmation checklist
Before treating a breakout as meaningful, check:
- Did the candle close beyond the zone?
- Was the body strong or mostly wick?
- Did volume increase?
- Did later candles hold outside the zone?
- Did price successfully retest the level?
- Does the broader trend support the breakout?
- Is the market liquid?
No single checklist item guarantees success.
Support and resistance with candlesticks
Candlestick behaviour can add context near important zones.
Near support, traders may watch for:
- long lower wicks,
- bullish closes,
- strong recovery candles,
- or repeated rejection of lower prices.
Near resistance, traders may watch for:
- long upper wicks,
- bearish closes,
- failed breakout candles,
- or repeated rejection of higher prices.
The candle should be interpreted using the principles in How to Read Candlestick Charts.
Support and resistance with volume
Volume can help evaluate participation.
Bounce with higher volume
A strong bounce from support with increased volume may show active buying.
Breakout with higher volume
A resistance breakout with strong volume may attract more attention than a breakout with weak participation.
Low-volume breakout
A breakout on unusually low volume may be less convincing, though volume behaviour differs by market and asset.
Volume is supporting evidence—not proof.
Multiple-timeframe support and resistance
Different timeframes can show different levels.
A practical approach is:
- Mark major weekly zones.
- Refine them on the daily chart.
- Use a shorter timeframe only if it matches your trading horizon.
A short-term level located inside a major weekly zone may deserve more attention than an isolated five-minute level.
Static vs dynamic support and resistance
Static support and resistance
Static levels are horizontal areas such as previous highs, previous lows and range boundaries.
Dynamic support and resistance
Dynamic levels move over time.
Examples include:
- trendlines,
- moving averages,
- channels.
CME Group’s education material identifies previous highs and lows, important price levels, moving averages and trendlines as common ways traders identify support and resistance.
Moving averages as dynamic levels
A moving average can sometimes act as a moving support or resistance reference.
In an uptrend, price may pull back toward a moving average and recover.
In a downtrend, price may rise toward a moving average and then move lower.
The moving average itself does not create guaranteed support or resistance. It is one of several chart references.
Trendlines as support and resistance
In an uptrend, a trendline can be drawn through rising swing lows.
In a downtrend, a trendline can be drawn through falling swing highs.
Price may react near the trendline, but trendlines are subjective. Slightly different anchor points can produce different lines.
Using support and resistance for risk planning
Support and resistance can help structure a trade plan.
A trader may use:
- support below an entry to define invalidation,
- resistance above an entry to estimate a possible target,
- or the distance between entry and stop to calculate risk.
However, the next Risk Management hub will explain position sizing, stop-losses and risk–reward ratios in greater depth.
Worked example
Suppose a stock is trading at ₹420.
Chart history shows:
- repeated buying near ₹398–₹402,
- repeated selling near ₹448–₹452,
- rising volume during advances,
- and a daily uptrend.
A beginner may mark:
- Support zone: ₹398–₹402
- Resistance zone: ₹448–₹452
Scenario 1: Price bounces from support
Price falls to ₹401, creates a long lower wick and closes at ₹410.
This may show buying interest, but confirmation is still needed.
Scenario 2: Price breaks resistance
Price closes at ₹456 on strong volume.
The trader may watch whether price remains above ₹452.
Scenario 3: Price retests the old resistance
Price later returns to ₹450 and then moves higher.
The old resistance zone may now be acting as support.
Scenario 4: False breakout
Price trades at ₹456 but closes at ₹447 and later falls.
The breakout did not hold.
A beginner workflow

Use this step-by-step method:
- Open a clean daily chart.
- Zoom out to see major structure.
- Mark obvious swing lows.
- Mark obvious swing highs.
- Convert exact lines into narrow zones.
- Remove weak or unnecessary levels.
- Check the weekly chart.
- Watch candle behaviour and volume near the zone.
- Wait for confirmation.
- Plan risk before taking any position.
Common mistakes
Mistake 1: Drawing too many lines
A chart covered with levels becomes difficult to use.
Mistake 2: Treating levels as exact prices
Support and resistance are normally areas.
Mistake 3: Forcing levels onto the chart
Mark obvious reactions rather than searching for a level behind every candle.
Mistake 4: Ignoring the timeframe
A level meaningful on the daily chart may matter more than a tiny intraday level.
Mistake 5: Assuming more touches always mean stronger support
Repeated tests can attract attention, but they may also consume available orders and weaken the zone.
Mistake 6: Buying support without confirmation
Support can break.
Mistake 7: Selling resistance without confirmation
Resistance can break.
Mistake 8: Ignoring volume and trend
A zone should be interpreted within the larger market structure.
Mistake 9: Trading every breakout
False breakouts are common.
Mistake 10: Ignoring risk management
Even the clearest level can fail.
Frequently asked questions
What is support and resistance in simple words?
Support is a zone where falling price may meet buying interest. Resistance is a zone where rising price may meet selling interest.
How do you identify support and resistance?
Start with obvious swing highs, swing lows, repeated reactions, range boundaries and higher-timeframe price structure.
Should support and resistance be a line or a zone?
A zone is usually more realistic because price rarely reacts at one perfect number.
How many touches make a level strong?
There is no fixed number. Several clear reactions can make a zone more visible, but repeated testing may also weaken it.
Why does support become resistance?
After support breaks, traders may sell when price returns to the old level. This can turn the old support into resistance.
What is a retest?
A retest is a return to a previously broken zone after a breakout or breakdown.
What is a false breakout?
A false breakout moves beyond a zone but quickly returns inside the previous range.
Which timeframe is best for beginners?
Daily and weekly charts are often clearer for beginners than very short intraday charts.
Can moving averages act as support or resistance?
They can act as dynamic reference areas, but they do not guarantee a price reaction.
Does support and resistance always work?
No. Every zone can break or lose relevance.
What should I learn next?
This completes the first three Technical Analysis articles. The roadmap next moves to Risk Management: What Is Risk Management in the Stock Market?
Continue learning on RegalTicker
- What Is Technical Analysis? — understand the complete chart-analysis framework.
- How to Read Candlestick Charts — learn how candles behave near support and resistance.
- What Is the Stock Market? — understand how market prices and trading work.
- NSE vs BSE — understand India’s major stock exchanges.
Next roadmap hub: Risk Management.
Conclusion
Understanding support and resistance in stock market charts helps beginners organise price movement into meaningful zones.
Support is an area where buying interest may slow a decline. Resistance is an area where selling interest may slow an advance.
Use previous swing highs, swing lows, repeated reactions, volume and higher timeframes to identify important zones. Treat them as areas rather than exact prices.
Most importantly:
- support can break,
- resistance can break,
- breakouts can fail,
- and no technical level guarantees a profitable decision.
Support and resistance become useful when combined with candlesticks, trend, volume, confirmation and disciplined risk management.
Verify through official sources
Official references
Educational disclaimer: This article is for investor education and general information only. It is not financial advice, a recommendation to buy or sell any security, or a guarantee of returns. Support, resistance, breakouts and chart patterns can fail. Always use updated market data, independent research and appropriate risk management.