Quick answer
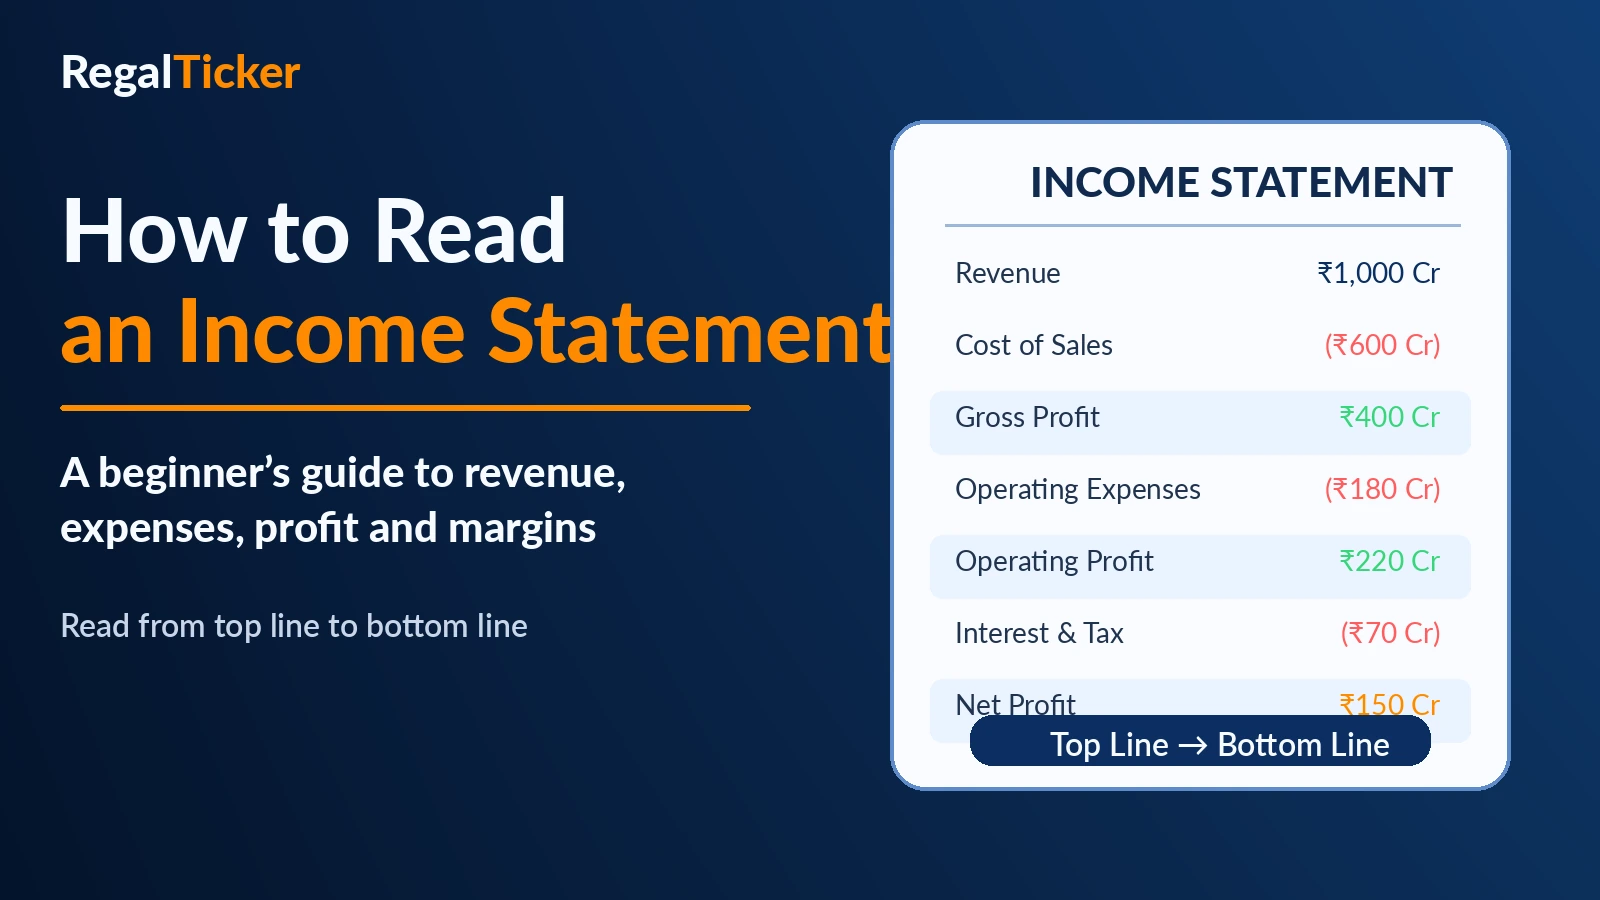
An income statement—also called a statement of profit and loss—shows a company’s financial performance over a period such as a quarter or financial year. It begins with revenue, subtracts direct costs and operating expenses, adjusts for other income, interest and tax, and ends with net profit. To read it properly, move from the top line to the bottom line, calculate margins, compare several years and investigate unusual changes.
Investor note
Key Takeaways
Revenue is the top line; net profit is the bottom line. Gross profit measures what remains after direct costs. Operating profit shows performance from core operations. Net profit is the final profit after interest, tax and other items. Trends and margins matter more than one isolated number. A company can report rising revenue while profitability is weakening.
What is an income statement?
An income statement is one of the three primary financial statements used to analyse a company. The other two are the balance sheet and cash flow statement. These statements form a central part of fundamental analysis.
The income statement answers a simple question:
During this period, how much did the company earn, how much did it spend, and how much profit remained?
It usually covers a period rather than one specific date. A company may publish an income statement for:
- One quarter
- Six months
- Nine months
- A full financial year
In Indian corporate filings, it is commonly called the Statement of Profit and Loss or the Profit and Loss Statement.
An income statement does not tell you everything about a company. It does not show the complete asset and debt position, and it does not always tell you whether accounting profit has converted into cash. However, it is the best starting point for understanding sales, costs, operating performance and profitability.
Why is the income statement important?
The income statement helps investors evaluate:
- Whether the company is growing its sales
- Whether it is controlling direct costs
- Whether operating expenses are manageable
- Whether the core business is profitable
- Whether debt-related interest is reducing profit
- Whether profit margins are improving or weakening
- Whether reported profit appears sustainable
As explained in Revenue, Profit and Profit Margins, two companies can earn the same revenue but produce very different profits. The difference may come from production efficiency, pricing power, employee costs, advertising expenses, interest burden or taxation.
Worked example
Same revenue, different profitability
Company A and Company B both report revenue of ₹1,000 crore.
Company A earns net profit of ₹150 crore. Company B earns net profit of ₹40 crore.
Company A’s net profit margin is 15%, while Company B’s is only 4%. Revenue alone therefore does not reveal business quality.
How is an income statement structured?
Most income statements follow a flow from revenue to final profit.

A simplified structure looks like this:
| Line item | Basic meaning |
|---|---|
| Revenue from Operations | Money earned from normal business activities |
| Other Income | Income not generated directly from the main operating activity |
| Cost of Sales or Cost of Goods Sold | Direct cost of producing or purchasing what was sold |
| Gross Profit | Revenue minus direct costs |
| Operating Expenses | Employee, administration, marketing and other running costs |
| Operating Profit | Profit generated from normal operations |
| Finance Cost | Interest and related borrowing costs |
| Profit Before Tax | Profit after interest but before tax |
| Tax Expense | Current and deferred tax recognised for the period |
| Net Profit | Final accounting profit after all expenses and tax |
Step 1: Start with revenue
Revenue is usually the first major number on the income statement. It is often called the top line because it appears near the top.
Revenue from operations represents income earned from the company’s primary business.
Examples:
- A car manufacturer earns revenue from selling vehicles.
- A software company earns revenue from subscriptions and services.
- A retailer earns revenue from product sales.
- A bank reports interest income and fee income rather than conventional product sales.
When reading revenue, ask:
- Is revenue growing?
- Is growth consistent?
- Is growth organic, or caused by an acquisition?
- Is growth coming from higher prices, larger volumes or both?
- Is the growth rate improving or slowing?
- Is the company dependent on one product or customer?
Revenue growth formula
Revenue Growth (%) = (Current Period Revenue − Previous Period Revenue) ÷ Previous Period Revenue × 100
Worked example
Revenue growth calculation
A company reports revenue of ₹1,000 crore this year and ₹850 crore last year.
Revenue growth:
(₹1,000 crore − ₹850 crore) ÷ ₹850 crore × 100 = 17.65%
The company’s revenue grew by approximately 17.6%.
Risk warning
Revenue growth is not enough
A company may increase sales by offering heavy discounts or spending aggressively on marketing. Always check whether profit and cash flow are growing along with revenue.
Step 2: Study direct costs and gross profit
Direct costs are expenses closely connected with producing or purchasing the goods or services sold.
For a manufacturer, these may include:
- Raw materials
- Components
- Production labour
- Manufacturing-related costs
- Changes in inventory
For a retailer, the main direct cost may be the cost of merchandise purchased for resale.
Gross profit is commonly calculated as:
Gross Profit = Revenue − Direct Costs
Gross profit shows how much remains after covering the direct cost of the product or service.
Gross profit margin
Gross Profit Margin (%) = Gross Profit ÷ Revenue × 100
A rising gross margin can indicate:
- Better pricing
- Lower input costs
- Improved product mix
- Greater operating efficiency
- Stronger competitive position
A falling gross margin may indicate:
- Raw-material inflation
- Discounting
- Weak pricing power
- Higher production costs
- Unfavourable product mix
Not every Indian company separately reports “gross profit” on the face of its published statement. In that case, investors may calculate an approximate figure using revenue and relevant direct-cost items. Industry context is essential.
Step 3: Review operating expenses
Operating expenses are the costs required to run the business but are not always directly tied to one individual unit sold.
Common operating expenses include:
- Employee benefits
- Rent
- Marketing and advertising
- Technology costs
- Distribution costs
- Administration expenses
- Depreciation and amortisation
- Research and development
- Other operating expenses
When reviewing expenses, compare their growth with revenue growth.
Worked example
Expense growth can weaken profit
Revenue grows by 10%, but employee and marketing expenses grow by 25%.
The company may still be expanding, but operating profit can weaken because expenses are increasing much faster than sales.
Investor note
Some expenses support future growth
Higher spending is not automatically negative. A company may invest in employees, distribution, research or technology to support future growth. The key question is whether the spending eventually produces better revenue, margins or competitive strength.
Step 4: Find operating profit
Operating profit measures profit earned from the core business before financing costs and tax.
Depending on the company’s reporting format, investors may see terms such as:
- EBIT
- Operating Profit
- Profit Before Interest and Tax
- EBITDA, which excludes depreciation and amortisation
These terms are related but are not identical.
EBIT
EBIT generally means earnings before interest and tax.
EBITDA
EBITDA generally means earnings before interest, tax, depreciation and amortisation.
EBITDA can help compare operational performance, but it should not be treated as cash profit. Depreciation, working capital, tax and capital expenditure still matter.
Operating profit margin
Operating Profit Margin (%) = Operating Profit ÷ Revenue × 100
Operating margin helps investors understand how efficiently the core business converts revenue into operating profit.
Step 5: Check other income
Other income may include:
- Interest earned on deposits
- Dividend income
- Profit from selling investments
- Profit from selling property or assets
- Government grants
- Foreign-exchange gains
- Miscellaneous non-operating income
Other income is not always bad. However, investors should separate recurring operating profit from unusual or one-time gains.
Worked example
One-time gain can inflate profit
A company reports operating profit of ₹80 crore but records a ₹120 crore gain from selling land.
Reported profit may look strong, but most of it did not come from normal business operations. An investor should not assume that the land-sale profit will repeat every year.
Step 6: Review interest or finance cost
Finance cost includes interest paid on:
- Bank loans
- Bonds or debentures
- Working-capital borrowings
- Lease liabilities
- Other financing arrangements
Rising interest cost may indicate:
- Higher debt
- Higher interest rates
- Weak cash generation
- Aggressive expansion funded through borrowing
Compare finance cost with operating profit.
A company with operating profit of ₹200 crore and interest cost of ₹20 crore has much more flexibility than a company with the same operating profit and interest cost of ₹150 crore.
One useful measure is the interest coverage ratio:
Interest Coverage Ratio = EBIT ÷ Interest Expense
A higher ratio generally indicates a better ability to meet interest obligations, although acceptable levels vary by sector.
Step 7: Understand profit before tax
Profit Before Tax, often written as PBT, is the profit remaining after operating items, other income and finance costs, but before income tax.
It helps investors separate business and financing performance from tax effects.
A sudden change in PBT may come from:
- Better operating profit
- Lower finance cost
- Higher other income
- Exceptional gains or losses
Always identify the actual cause rather than relying only on the final percentage change.
Step 8: Review the tax expense
Tax expense may not equal the simple statutory tax rate multiplied by profit before tax. Differences may arise because of:
- Deferred tax
- Tax incentives
- Previous-year adjustments
- Non-deductible expenses
- Different tax rates across locations
- One-time tax effects
A very low or unusually high effective tax rate deserves investigation.
Effective Tax Rate (%) = Tax Expense ÷ Profit Before Tax × 100
Investors should not assume that an unusual tax rate will continue permanently.
Step 9: Focus on net profit
Net profit is the final accounting profit after expenses, finance costs and tax. It is commonly called:
- Profit After Tax
- PAT
- Net Income
- Bottom Line
It is called the bottom line because it usually appears near the bottom of the statement.
Net profit margin
Net Profit Margin (%) = Net Profit ÷ Revenue × 100
The net margin shows how much final profit the company retains from each ₹100 of revenue.
Worked example
Net margin interpretation
A company earns revenue of ₹1,000 crore and net profit of ₹150 crore.
Net profit margin:
₹150 crore ÷ ₹1,000 crore × 100 = 15%
The company earns ₹15 of net profit for every ₹100 of revenue.

Step 10: Check earnings per share
Earnings Per Share, or EPS, represents profit attributable to each equity share. Beginners who need the ownership foundation should first read What Is a Share?.
Basic EPS is generally calculated as:
EPS = Profit attributable to equity shareholders ÷ Weighted average number of equity shares
EPS can help track profit on a per-share basis, especially when the number of shares changes.
However, EPS can rise because of:
- Higher profit
- Share buybacks
- A lower share count
- One-time income
Investors should therefore examine the reason for the change.
Read the income statement across several years
One quarter can be affected by seasonality, temporary costs or unusual events. A stronger analysis compares:
- Quarter-on-quarter changes
- Year-on-year changes
- Three-to-five-year trends
- Performance against competitors
- Performance against industry conditions

Compare revenue growth
Consistent growth may indicate expanding demand, but the quality of growth matters.
Compare gross and operating margins
Margins show whether the company is retaining more or less profit from each unit of sales.
Compare expense ratios
Employee, marketing or administrative costs can be compared with revenue.
Compare finance cost
Rising finance cost may signal increasing debt pressure.
Compare profit with cash flow
A company can report accounting profit without generating equivalent operating cash flow. The cash flow statement must therefore be studied alongside the income statement.
A complete worked example
Assume a simplified company reports the following:
| Particulars | Amount (₹ crore) |
|---|---|
| Revenue from Operations | 1,000 |
| Cost of Sales | 600 |
| Gross Profit | 400 |
| Operating Expenses | 180 |
| Operating Profit | 220 |
| Other Income | 20 |
| Finance Cost | 30 |
| Profit Before Tax | 210 |
| Tax Expense | 60 |
| Net Profit | 150 |
400 ÷ 1,000 × 100 = 40%
220 ÷ 1,000 × 100 = 22%
150 ÷ 1,000 × 100 = 15%
This means that for each ₹100 of revenue:
- ₹40 remains after direct costs
- ₹22 remains after operating expenses
- ₹15 remains as final net profit
Important warning signs

Revenue rises but profit falls
This may indicate that costs are growing faster than sales.
Gross margin keeps falling
This may suggest weak pricing power, higher input costs or unfavourable product mix.
Operating expenses rise sharply
The company may be investing for growth, but investors should check whether the spending produces results.
Interest cost increases quickly
This may signal rising debt or refinancing pressure.
Other income becomes a large part of profit
Reported profit may be dependent on non-core or one-time items.
Tax rate changes unusually
A temporary tax benefit can make net profit look stronger than the underlying business.
Frequent exceptional items
Repeated “one-time” adjustments may make reported results harder to evaluate.
Risk warning
Different industries need different interpretation
Banks, insurers, manufacturing companies, software companies and retailers have different income-statement structures. Compare a company with appropriate peers rather than applying one fixed margin standard to every sector.
Consolidated vs standalone income statement
Many listed companies publish both:
- Standalone results, covering the parent company
- Consolidated results, covering the parent and subsidiaries
For a group with important subsidiaries, consolidated results usually provide a more complete picture of the overall business.
However, investors may also review standalone results to understand the parent entity separately.
Quarterly vs annual income statements
Quarterly results are useful for tracking recent performance, but annual statements usually contain more detail and are accompanied by audited financial statements and extensive notes.
A sensible approach is:
- Use quarterly results to monitor changes.
- Use annual reports for deeper analysis.
- Read the notes and management discussion.
- Compare reported profit with cash flow and balance-sheet movement.
Common mistakes to avoid
Mistake 1: Looking only at net profit
Net profit is important, but the quality and source of profit matter.
Mistake 2: Ignoring margins
Absolute profit can rise while profitability per rupee of sales declines.
Mistake 3: Treating EBITDA as cash flow
EBITDA excludes several real economic costs and is not the same as cash generated.
Mistake 4: Comparing unrelated industries
Margins differ widely across sectors.
Mistake 5: Using only one quarter
Short periods may be affected by seasonality or unusual events.
Mistake 6: Ignoring notes to accounts
Important explanations about exceptional items, accounting changes and segment performance may appear in the notes.
Mistake 7: Ignoring the cash flow statement
Accounting profit and cash generation are not always the same.
A beginner’s checklist
Use this checklist when reading an income statement:
- Is revenue growing consistently?
- Are gross margins stable or improving?
- Are operating expenses controlled?
- Is operating profit growing?
- Is other income unusually large?
- Is interest expense rising?
- Is the effective tax rate unusual?
- Is net profit growth supported by core operations?
- Are EPS and profit moving in the same direction?
- Does operating cash flow support reported profit?
- Are there repeated exceptional items?
- How do the numbers compare with peers?
Frequently asked questions
What is the income statement called in India?
It is commonly called the Statement of Profit and Loss or Profit and Loss Statement.
What is the top line?
The top line usually refers to revenue or sales.
What is the bottom line?
The bottom line generally refers to net profit or profit after tax.
Is gross profit the same as net profit?
No. Gross profit is calculated after direct costs, while net profit is calculated after operating expenses, interest, tax and other items.
What is operating profit?
Operating profit is the profit generated by normal business operations before financing costs and tax.
Is EBITDA the same as operating cash flow?
No. EBITDA is an earnings measure and does not include working-capital changes, tax, interest or capital expenditure.
Should I study quarterly or annual results?
Study both. Quarterly results help monitor recent trends, while annual statements provide deeper and usually audited information.
Where can I find listed-company income statements?
They are available in company annual reports, quarterly financial results and official stock-exchange corporate filings. The NSE vs BSE guide explains the role of India’s two major stock exchanges.
What should I learn next?
After completing these Fundamental Analysis lessons, continue with What Is Technical Analysis? to learn how price, volume and market behaviour are studied on charts.
Continue learning on RegalTicker
Use these lessons together to build a connected understanding:
- What Is Fundamental Analysis? — understand the complete company-analysis framework.
- Revenue, Profit and Profit Margins Explained — learn the concepts used throughout an income statement.
- What Is a Share? — understand what equity ownership and earnings per share represent.
- NSE vs BSE — understand where listed-company filings and securities trading connect to the market.
Next roadmap lesson: What Is Technical Analysis? — learn the foundations of chart-based market analysis.
Conclusion
An income statement tells the story of how a company converts sales into profit.
Start with revenue. Then follow direct costs, gross profit, operating expenses, operating profit, other income, finance cost, tax and net profit. Calculate margins, compare several periods and investigate unusual changes.
The most useful habit is to avoid reading one number in isolation. Revenue, expenses, margins, profit, EPS and cash flow should all support the same business story.
A well-read income statement does not guarantee a successful investment, but it helps investors ask far better questions. Return to What Is Fundamental Analysis? to see how the income statement fits into the complete company-analysis process.
Verify through official sources
Official references
Educational disclaimer: This article is for investor education and general information only. It is not investment advice, a recommendation to buy or sell any security, or a guarantee of returns. Company results should be reviewed using updated official filings, notes to accounts, cash flow statements, balance sheets and relevant industry information.