
Lesson 01
Beginner
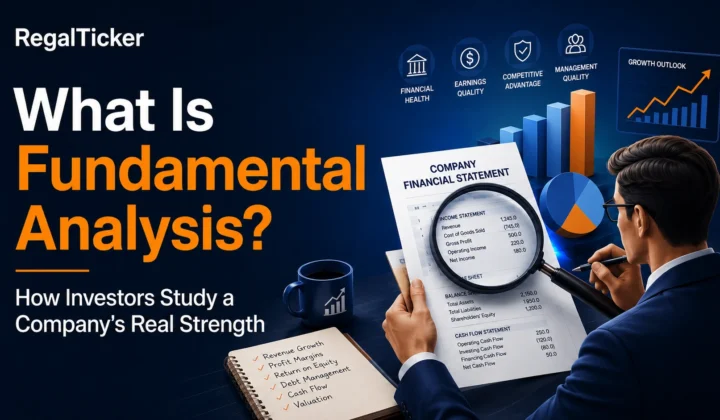
What Is Fundamental Analysis?
Learn what fundamental analysis is, why investors use it, the 3 financial statements, key ratios, and how it differs from…
Learn fundamental analysis for beginners through an ordered path covering businesses, financial statements, growth, profitability, debt, ratios and valuation.

Fundamental analysis studies the business behind a quoted share price. This path starts with revenue, profit and margins, then connects the income statement, balance sheet and cash flow statement before moving to earnings, returns on capital, debt and valuation ratios. The final checklist brings those separate observations into one repeatable company-analysis process.
Read the lessons in sequence if financial statements are new to you. When analysing a real company, use comparable reporting periods, check whether figures are standalone or consolidated, study multi-year trends and read the notes and disclosures. No single ratio or calculator can establish business quality, fair value or future performance.
Use the recommended learning order, or jump directly to the guide you need.
Learn what fundamental analysis is, why investors use it, the 3 financial statements, key ratios, and how it differs from…
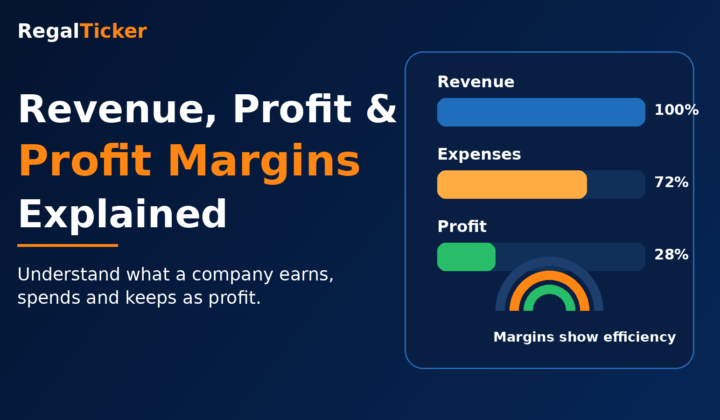
Understand revenue, gross profit, operating profit, net profit and profit margins with simple formulas, examples and investor-friendly comparisons.
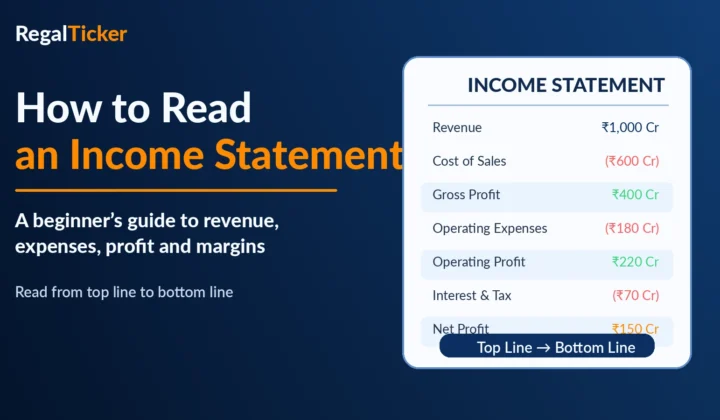
Learn how to read an income statement from revenue to net profit, understand key line items, calculate margins, and identify…
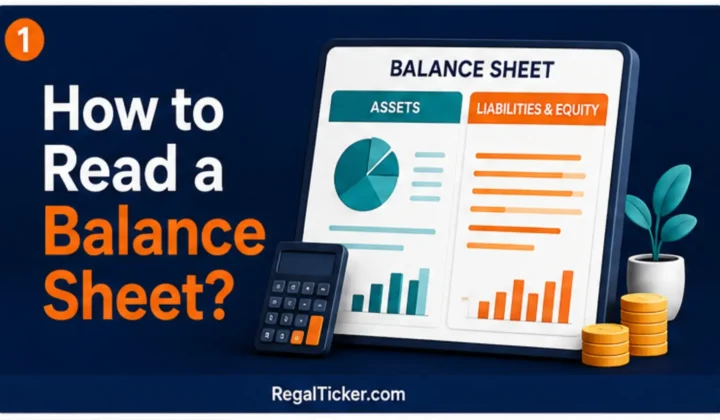
A balance sheet shows what a company owns, what it owes and what remains for shareholders on a particular date.…
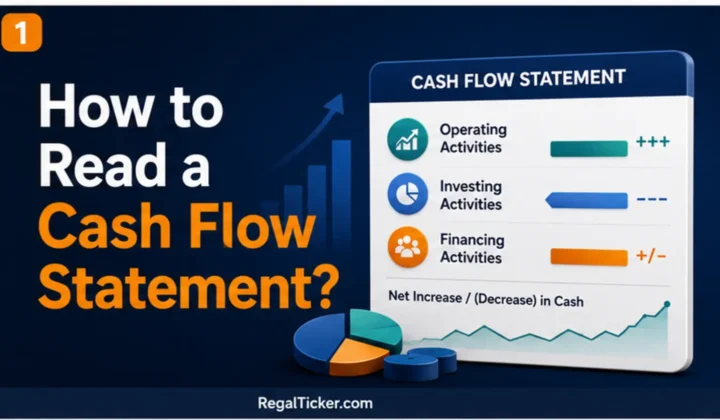
A company can report profit and still face a cash shortage. The cash flow statement helps investors understand why. It…
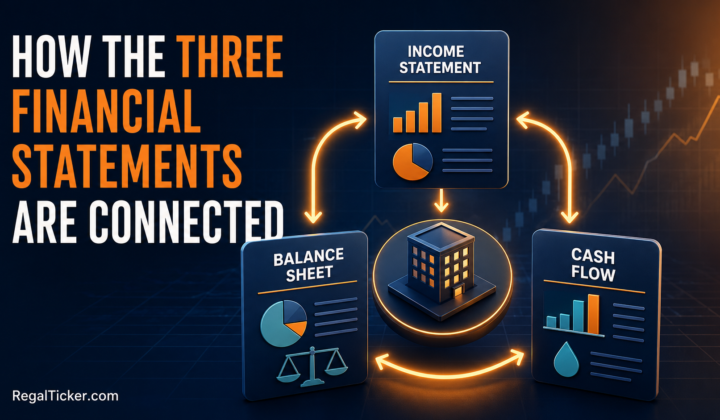
An income statement, balance sheet and cash flow statement do not describe three separate businesses. They describe the same company…

EPS, the P/E ratio and the PEG ratio are widely used to connect a company’s earnings with its share price…
Two companies may report the same profit but still be very different investments. One may earn that profit with a…

Two shares can trade at the same price and still represent companies with completely different values. One company may own…
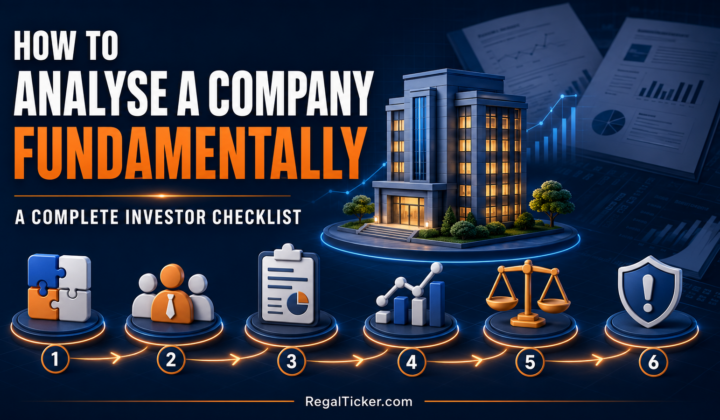
Finding a company with rising sales or a low valuation ratio is easy. Deciding whether its business is understandable, financially…
Use these calculators after reading the relevant lessons to measure historical change or a declared dividend—not to forecast a company’s future.
Annualise the change between a starting and ending value, such as revenue or profit across several years. CAGR smooths the period and does not show year-to-year volatility.
Open calculatorEstimate dividend income and yield from declared per-share figures and your inputs. Past or declared dividends do not guarantee future distributions.
Open calculator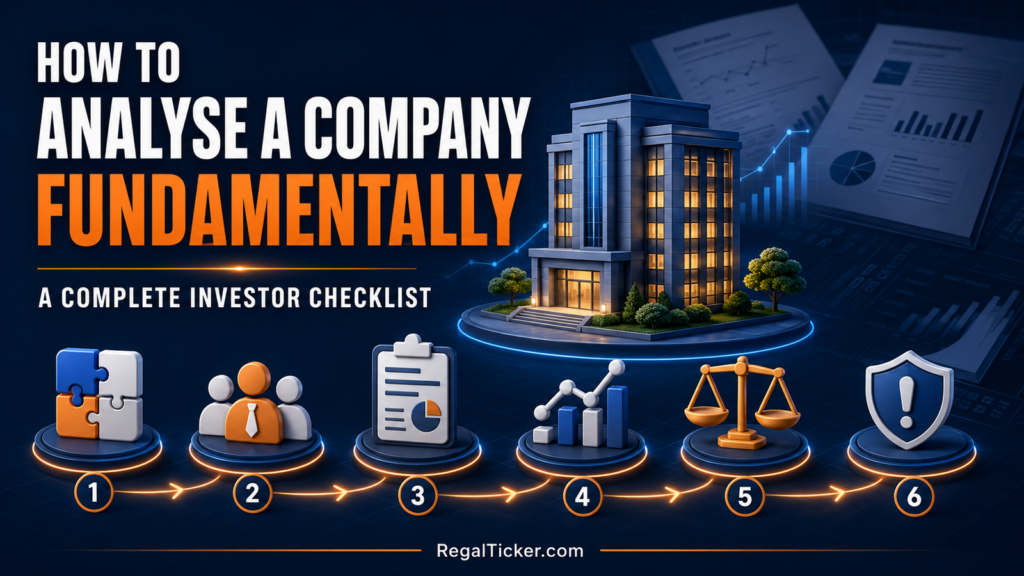
Finding a company with rising sales or a low valuation ratio is easy. Deciding whether its business is understandable, financially healthy, well managed, reasonably valued and capable of surviving future risks is…
Read Latest ArticleVerify company figures against exchange filings and annual reports. Use consistent reporting periods and read the accompanying notes, auditor information and disclosures.
First understand how the business earns money. Then learn the income statement, balance sheet and cash flow statement before using profitability, debt and valuation ratios.
No. It can improve how you examine business quality, financial strength and valuation, but company performance, market prices and future events remain uncertain.
Standalone results generally cover the parent company, while consolidated results combine the parent with applicable subsidiaries and other included entities. Confirm the reporting basis before comparing figures.
There is no universal best ratio. Revenue growth, margins, cash flow, returns on capital, debt and valuation should be read together and compared with the company’s history and relevant peers.