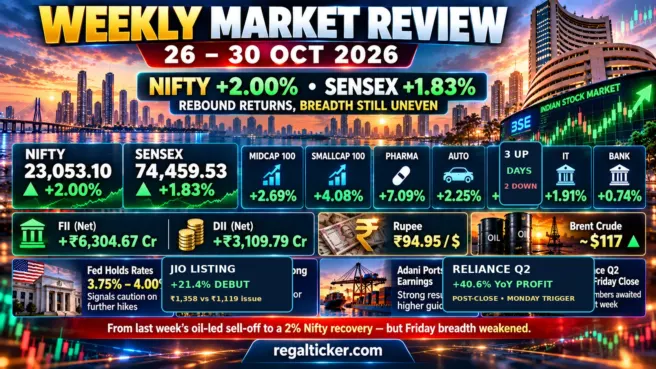


India had one of the rougher weeks in an already fragile global market
A week earlier, Indian equities had just produced their strongest rebound in six months. By Friday, most of that comfort had disappeared. The Nifty 50 fell 2.4% in the week ended 23 October, the Sensex lost 2.2%, and the damage below the headline indices was much worse: mid-caps fell 5.6% and small-caps 7.3%.
The important point is not simply that India fell. Global markets were also nervous. Wall Street's S&P 500 and Nasdaq ended modestly lower, Europe posted its sharpest weekly drop since early September, and Asian technology-heavy markets were hit harder. But India had its own pressure points on top of the global risk-off move: Brent crude finished the week at $116.72 a barrel, bank earnings disappointed, the Jio Platforms IPO absorbed liquidity, and 15 of 16 major Indian sectors ended lower.
That combination makes this a useful week to compare India with the rest of the world. The question is not whether every market was weak. It is why India reacted more severely than the U.S. and Europe, yet still held up better than some parts of Asia.
⚡ Quick answer
What defined Indian and global markets in the week ended 23 October 2026?
Indian equities underperformed most major Western benchmarks as the oil shock hit an economy that imports most of its crude. Nifty fell about 2.4% and Sensex 2.2%, while mid-caps lost 5.6% and small-caps 7.3%. The S&P 500 fell about 0.5%, Nasdaq 0.7%, and the STOXX 600 about 1.4%; Japan's Nikkei fell 4.0% and Hong Kong's Hang Seng about 4.5%. Brent crude settled at $116.72, up roughly 6% for the week. The rupee ended near ₹94.94 per dollar and was little changed for the week after surrendering early gains. The central message was that India was hit by the same global risk-off forces as everyone else, but expensive oil, weak breadth, bank earnings and domestic liquidity pressure amplified the decline.
Key takeaways
Nifty 50 fell about 2.4% to 22,600; Sensex lost about 2.2% to 73,123.83.
Nifty Midcap 100 dropped 5.6% and Nifty Smallcap 100 plunged 7.3%, their worst week in about 20 months.
Fifteen of 16 major Indian sectors ended lower; consumer durables, energy, FMCG and autos were among the weakest.
Brent crude settled at $116.72 per barrel, up roughly 6% for the week, making oil India's most important macro risk.
The rupee closed near ₹94.94 per dollar and finished the week broadly flat after earlier gains were erased.
FIIs/FPI net sold about ₹2,697 crore in the four Indian cash-market sessions; DIIs net bought about ₹10,942 crore.
The S&P 500 fell about 0.5% and Nasdaq about 0.7%, while the Dow rose 0.4%; Europe also weakened.
Asia was more fragile
Nikkei fell about 4.0% and Hang Seng about 4.5%.
Next week is unusually event-heavy
Fed decision on 28 October, U.S. GDP and PCE plus ECB on 29 October, and Bank of Japan on 30 October.
Investor note
The benchmark was not the portfolio experience
A 2.4% weekly fall in Nifty does not describe what happened to many portfolios. Investors tilted toward mid-caps, small-caps, consumer cyclicals, leveraged growth names or stocks with weak earnings may have experienced a much deeper drawdown. That gap between index performance and portfolio performance is one of the week's most important signals.
1. Weekly scorecard: India versus global markets
The week ended 23 October was not a clean global sell-off. It was a market in which different regions were punished for different reasons, even though oil, AI-spending concerns and geopolitics connected many of the moves.
| Market / asset | 23 Oct 2026 close | Weekly move | What mattered |
|---|---|---|---|
| Nifty 50 | 22,600.00 | -2.36% | Oil, weak breadth, earnings, liquidity |
| BSE Sensex | 73,123.83 | -2.15% | Banks and large-cap pressure |
| Nifty Midcap 100 | — | -5.6% | Risk reduction below large caps |
| Nifty Smallcap 100 | — | -7.3% | Liquidity and valuation compression |
| S&P 500 | 7,623.68 | -0.47% | AI-capex anxiety, oil, yields |
| Nasdaq Composite | 25,955.34 | -0.71% | Tech and AI-financing concerns |
| Dow Jones | 52,215.16 | +0.41% | Rotation away from expensive growth |
| STOXX Europe 600 | — | about -1.4% | Oil, France political/fiscal stress |
| Nikkei 225 | 62,693.16 | -4.03% | AI/semiconductor sell-off |
| Hang Seng | 23,093.37 | about -4.5% | China/tech risk and weak sentiment |
| Shanghai Composite | 3,690.48 | about -0.7% | China growth and risk concerns |
| Brent crude | $116.72/bbl | about +6% | Saudi/Houthi and wider Gulf risk |
| Spot gold | about $4,000/oz | about -4% | Higher-for-longer rate expectations |
| USD/INR | ₹94.94/$ | roughly flat | Oil erased early rupee gains |
The comparison matters because India did not have the worst week globally. Japan and Hong Kong fell more sharply. But India clearly underperformed the U.S. large-cap market and Europe, and its broader-market drawdown was severe.
That is a different message from simply saying "global cues were weak." Global cues were weak, but India's domestic sensitivity to oil and its own market structure made the reaction more painful.
For continuity, the previous weekly review is worth revisiting. It showed how quickly sentiment had improved when IT earnings, the rupee and large-cap buying aligned. This week demonstrates the reverse: a strong rebound can unwind quickly when the macro variables turn against India.
2. Why India underperformed Wall Street and Europe
The cleanest explanation is crude oil.
India imports most of the crude it consumes. When Brent rises sharply, the market does not treat the move as an isolated commodity story. It immediately starts repricing several connected risks:
- a higher import bill;
- pressure on the current account;
- more local demand for dollars;
- imported inflation;
- higher freight, fuel and petrochemical costs;
- weaker margins for businesses that cannot pass costs through;
- less room for monetary policy to become supportive.
Brent settled Friday at $116.72 per barrel, roughly 6% higher for the week. That was not just an energy-sector move. It was a macro shock.
The U.S. is far less exposed to imported crude in the same way, and its equity market also contains a much larger weight of globally dominant technology companies. Europe has its own energy vulnerabilities, but the immediate Indian transmission through the rupee, inflation expectations and corporate input costs is especially direct.
RegalTicker's crude-oil and Hormuz analysis explains this transmission chain in more detail. This week supplied a practical example of it: oil rose, the rupee lost its early weekly gains, import-sensitive sectors weakened, and the broader market demanded a higher risk premium.
The important caveat is duration. A geopolitical spike that fades within days has a very different economic effect from crude remaining above $110 for weeks. The market is currently pricing the risk that the move lasts long enough to matter.
3. Smallcaps and midcaps were the real Indian market story
The Nifty's 2.4% weekly fall was significant, but the broader market told a much harsher story.
Nifty Midcap 100 lost 5.6% and Nifty Smallcap 100 fell 7.3%, their worst weekly performances in around 20 months. That is the sort of divergence that changes how investors should read the benchmark.
Smaller companies can fall faster when liquidity becomes scarce because they generally have thinner trading depth and less index-driven support. They can also carry more valuation risk. A stock priced for years of rapid growth has more room to compress when investors suddenly demand a larger margin of safety.
This week added another pressure: the record Jio Platforms IPO. Reuters cited analysts who said the $3.2 billion issue, which was subscribed 13.8 times, absorbed liquidity and investor attention. A large primary-market issue does not mechanically cause the secondary market to fall, but it can matter when risk appetite is already weak.
The 23 October Daily Review captured the same divergence at the session level: Nifty recovered almost 200 points from its low, but mid- and small-cap participation remained poor. The weekly view confirms that this was not merely a one-day anomaly.
Investor note
A falling smallcap is not automatically a bargain
Price damage can create opportunity, but only when the underlying business evidence remains intact. In a broad correction, separate companies with strong cash generation, manageable leverage and durable demand from companies whose valuation was carrying most of the investment thesis. The Fundamental Analysis framework is more useful here than asking whether a stock is simply "down enough."
4. Sector damage showed where oil and earnings hurt most
Fifteen of India's 16 major sectors ended the week lower.
Reuters reported particularly heavy weekly declines in:
| Sector | Weekly move |
|---|---|
| Consumer durables | about -6.4% |
| Energy | about -4.6% |
| FMCG | about -4.3% |
| Auto | about -3.5% |
These are not identical businesses, but several share a common problem when energy costs rise: margins can be squeezed before companies have time—or pricing power—to pass higher costs to customers.
Banking also weakened, but for a different reason. HDFC Bank lost about 5% over the week after missing quarterly profit expectations. Axis Bank fell about 5.6%, while Bajaj Finance dropped about 5.4% as investors focused on margin pressure despite higher reported profit.
That is why this week's decline should not be reduced to "oil caused everything." Oil was the dominant macro variable, but company earnings and sector-specific expectations still mattered.
Swiggy's 16.8% Friday drop to a record low and Colgate-Palmolive India's 4.8% decline after a profit miss were reminders that weak markets punish disappointing company-specific news more aggressively.
5. The rupee absorbed some pressure, but the weekly picture was less bad than equities
The rupee ended Friday near ₹94.94 per U.S. dollar.
That sounds weak in isolation, but the weekly path matters. Reuters reported that the currency finished roughly unchanged for the week after earlier gains were erased by the late-week oil surge. The previous week, the rupee had risen about 1.4%.
This distinction matters for equity investors. The rupee did not collapse alongside the broader market. Policy measures, residual IPO-linked inflows and a temporary reduction in expectations for further U.S. rate hikes had supported it earlier in the week.
Then oil changed the balance. Importers increased dollar demand and the currency gave back those gains.
A stable rupee with Brent above $115 is better than simultaneous oil and currency stress. But it should not be mistaken for a solved external-balance problem. The longer crude stays elevated, the more difficult it becomes for the currency to ignore India's import bill.
6. FII and DII flows: domestic institutions were the stronger stabiliser
The Indian cash market had four regular sessions during the week. Using provisional combined cash-market figures:
| Session | FII/FPI net | DII net |
|---|---|---|
| 19 Oct | -₹1,148.64 crore | +₹3,201.19 crore |
| 21 Oct | +₹1,022.32 crore | +₹1,614.32 crore |
| 22 Oct | -₹3,458.70 crore | +₹2,891.32 crore |
| 23 Oct | +₹887.65 crore | +₹3,235.36 crore |
| Week total | -₹2,697.37 crore | +₹10,942.19 crore |
The headline is straightforward: foreign cash-market activity was net negative for the week, while domestic institutions bought heavily.
But the interpretation should stay disciplined. FII and DII flows are context, not a complete market explanation. They do not show every derivatives position, every primary-market allocation or every institution's motive.
The FII vs DII guide explains why a single daily number can be misleading. This week is a good example. Foreign investors were net buyers on two of the four sessions, but the weekly balance remained negative and the market still fell sharply.
The more useful question is whether domestic buying continues to absorb foreign selling if oil remains high and global risk appetite stays weak.
7. Global markets were weak too—but the pattern was different
United States: AI spending anxiety replaced simple "tech leadership"
The S&P 500 fell about 0.5% for the week and the Nasdaq about 0.7%, while the Dow gained roughly 0.4%. The Russell 2000 rose about 2%.
That split matters.
The U.S. market was not experiencing a uniform liquidation. Instead, investors were questioning the financing burden behind enormous AI infrastructure spending. Thursday's 2.6% Nasdaq drop was the clearest expression of that concern. By Friday, technology shares had steadied somewhat, but the debate had shifted from "how fast can AI grow?" toward "what will this growth cost, and what returns will justify the capital?"
At the same time, U.S. energy shares benefited from higher oil. That helped create the unusual combination of weaker growth-heavy indices but stronger pockets elsewhere.
Europe: oil met political and fiscal stress
The STOXX 600 fell about 1.4%, its steepest weekly decline since early September.
France was a particular source of anxiety as political uncertainty and borrowing-cost concerns pushed French debt risk back into focus. Rising oil complicated the picture by adding another inflation and growth concern.
Europe therefore shared India's oil problem, but with an additional fiscal and political layer.
Asia: technology exposure made the drawdown harsher
Asia was the weakest major region.
Japan's Nikkei fell about 4.0% over the week. Hong Kong's Hang Seng lost about 4.5%. The broader MSCI Asia-Pacific ex-Japan index was headed for a fourth consecutive weekly decline as technology and semiconductor stocks sold off.
The mechanism was different from India. Asian technology-heavy markets were hit directly by the global reassessment of AI capital expenditure and semiconductor valuations. Japan's chip-linked shares were especially sensitive to the Nasdaq shock.
China's Shanghai Composite fell much less—around 0.7%—but the broader regional mood remained defensive.
This is why "global risk-off" is only the first layer of the explanation. India was punished for oil and breadth. Japan and Hong Kong were punished more heavily for technology and China-sensitive risk. Wall Street saw rotation rather than indiscriminate selling.
8. Oil rose while gold fell: a useful clue about the macro regime
Normally, geopolitical stress encourages investors to expect gold to behave like a safe haven. This week, that relationship was overwhelmed by another force.
Spot gold fell roughly 4%, its worst week in several months, even as Middle East risk increased.
Why? Because expensive oil raised inflation concerns, and inflation concerns kept interest-rate expectations restrictive. Gold does not generate income, so higher real and nominal yields can make it less attractive relative to interest-bearing assets.
That combination—oil up, gold down, bonds volatile—is useful because it shows that markets were not pricing a simple fear trade. They were trying to balance geopolitical risk against the possibility that higher energy costs keep central banks tighter for longer.
For Indian equities, that is a difficult global backdrop. High oil hurts directly, while high global yields can reduce the relative appeal of emerging-market risk assets.
9. What changed from the previous week
The contrast with 12–16 October is sharp.
Last week:
- Nifty rose 2.8%;
- Sensex gained 3.1%;
- Nifty IT jumped 11.7%;
- the rupee strengthened strongly;
- large-cap earnings helped sentiment.
This week:
- Nifty fell 2.4%;
- Sensex lost 2.2%;
- mid- and small-caps suffered much larger losses;
- the rupee surrendered its early weekly gains;
- oil moved from an existing concern to the dominant macro variable.
That does not mean last week's rebound was "false." Markets respond to changing information. A rebound can be justified by better earnings and improving flows, then reverse when a new macro shock changes the discount rate, margin outlook or risk appetite.
The lesson is more useful than the label. Weekly reviews should track which variables are improving together and which are diverging.
10. What to watch in the week of 26–30 October
Next week is unusually dense with global events.
27–28 October: Federal Reserve
The Federal Open Market Committee meets on 27–28 October, with the policy decision and press conference on Wednesday the 28th.
The market will care less about whether the Fed simply holds rates and more about how policymakers discuss oil-driven inflation, financial conditions and the risk that AI investment stress spills into broader growth.
For India, the transmission runs through U.S. yields, the dollar, FII risk appetite and the rupee.
27 October: Larsen & Toubro results
L&T is scheduled to report quarterly results on 27 October. The stock is useful as a read on India's capex, infrastructure, engineering and defence cycle.
29 October: U.S. GDP, PCE and ECB
The U.S. Bureau of Economic Analysis is scheduled to release the advance estimate of third-quarter GDP and September Personal Income and Outlays—including PCE inflation—on 29 October.
The European Central Bank also announces its monetary-policy decision the same day.
A stronger-than-expected U.S. growth/inflation combination could push yields higher again. A softer combination could relieve some pressure, but the market reaction will depend on how the Fed has framed policy the previous day.
29–30 October: Bank of Japan
The Bank of Japan meets on 29–30 October and is scheduled to release its policy statement and updated outlook on Friday.
Japan has already been one of the week's weakest equity markets. Any shift in rate expectations, inflation forecasts or the yen could influence global bond and currency markets.
Big Tech earnings
Alphabet, Microsoft and Amazon are among the major U.S. companies reporting next week. The central question is no longer whether AI demand exists. It is whether revenue growth and cash generation justify the scale of data-centre and infrastructure spending.
That matters to India through global technology sentiment, Indian IT valuations and the broader cost-of-capital environment.
Highlight
Next week's market is likely to be driven by the interaction of three variables
Oil, interest-rate expectations and earnings will matter together. A fall in crude would help India, but a hawkish Fed could offset that relief. Strong global earnings could improve risk appetite, but not if they require still more debt-funded capex. Watch the combination rather than one headline in isolation.
11. What this week means for Indian investors
The week does not provide a clean instruction to buy or sell. It provides a clearer map of where the risks currently sit.
First, market breadth is weak. When small-caps fall three times as much as the Nifty, portfolio construction matters more than the headline index.
Second, crude is no longer a background variable. Above $110, it deserves a place near the top of the Indian investor dashboard alongside earnings, the rupee and institutional flows.
Third, global markets are not moving as one block. The U.S. is rotating, Europe is dealing with fiscal and political stress, and Asia is more exposed to the technology unwind. India's relative performance will depend on which of those forces dominates next.
Fourth, domestic institutions continue to provide meaningful support. That is important, but it should not be treated as an unlimited floor under prices.
For investors carrying concentrated positions after the broad-market drawdown, the Risk Management framework is more useful than trying to call the exact market bottom. Position size, liquidity and diversification matter most when volatility increases.
Final takeaway
The week was a reminder that India cannot separate itself from the world—but it has its own pressure points
The week ended 23 October was globally fragile, but India's decline was not just imported from overseas. Oil translated directly into inflation and currency concerns, bank earnings weakened important index names, and liquidity pressure hit the broader market harder than the benchmarks.
The useful comparison is therefore relative. India performed worse than the S&P 500, Nasdaq, Dow and STOXX 600, but better than Japan and Hong Kong. The Nifty's 2.4% decline sits in the middle of a global risk-off week; the 7.3% small-cap fall does not.
That is the number investors should remember. The broad market is sending a more cautious message than the headline index. Next week's Fed, U.S. inflation and growth data, ECB, Bank of Japan and Big Tech earnings will determine whether that caution starts to ease—or becomes the next leg of the correction.
Frequently asked questions
How much did Nifty fall in the week ended 23 October 2026?
The Nifty 50 fell about 2.4% for the week and closed at 22,600.
How much did Sensex fall this week?
The BSE Sensex declined about 2.2% and ended Friday at 73,123.83.
Why did Indian stocks fall more than the S&P 500?
India faced the same global risk-off environment but had additional sensitivity to rising crude oil, weak market breadth, bank earnings and liquidity pressure around the Jio Platforms IPO.
How badly did midcaps and smallcaps perform?
Nifty Midcap 100 fell about 5.6% and Nifty Smallcap 100 about 7.3%, their worst weekly performances in roughly 20 months.
What happened to crude oil this week?
Brent crude settled at $116.72 per barrel on Friday and gained about 6% for the week as Middle East supply risks intensified.
Were FIIs buyers or sellers this week?
Across the four Indian cash-market sessions, provisional combined data show FII/FPI net selling of about ₹2,697 crore. DIIs were net buyers of about ₹10,942 crore.
Which global market fell the most among the major indices covered here?
Hong Kong's Hang Seng fell about 4.5% and Japan's Nikkei about 4.0%, both materially worse than Nifty's 2.4% decline.
What are the biggest events for markets next week?
The Fed decision on 28 October, U.S. GDP and PCE plus the ECB on 29 October, the Bank of Japan on 30 October, major U.S. technology earnings and L&T's results on 27 October are among the main scheduled triggers.
Verify through official sources
Official references
- Reuters — Surging oil prices drag Indian shares to weekly losses — Nifty and Sensex weekly performance, sector losses, mid/small-cap drawdown, bank moves and Jio IPO liquidity context.
- Reuters — Rupee little changed this week as oil-fuelled declines wipe out early gains — Rupee close near ₹94.94, weekly currency performance and oil transmission.
- Reuters — Oil prices settle at highest since April — Brent settlement at $116.72 and roughly 6% weekly gain.
- Associated Press — How major U.S. stock indexes fared Friday 10/23/2026 — S&P 500, Dow, Nasdaq and Russell 2000 weekly changes and Friday closes.
- Reuters — European stocks post weekly loss as France turmoil and oil weigh — STOXX 600 weekly decline and European political/earnings context.
- Nikkei Indexes — Nikkei 225 historical data — Official Nikkei closing levels used to calculate the 4.03% weekly fall.
- Financial Times — Hang Seng historical prices — Hang Seng closing levels used for the weekly comparison.
- Financial Times — Shanghai Composite historical prices — Shanghai Composite closing data for the weekly comparison.
- Reuters — Asian stocks sink on tech angst and Gulf tensions — Regional AI/semiconductor sell-off and Gulf-risk context.
- Reuters — Gold set for steep weekly loss as oil lifts rate concerns — Gold's roughly 4% weekly decline and higher-for-longer rate logic.
- NSE India — FII/FPI & DII trading activity — Official methodology and source page for provisional institutional cash-market activity.
- Moneycontrol — FII/DII trading activity — Daily 19, 21, 22 and 23 October provisional cash-market figures used for the weekly total.
- Reuters — Take Five: AI trade meets the Fed — Global event calendar and Big Tech/Fed framing for the coming week.
- Federal Reserve — October 2026 calendar — FOMC meeting on 27–28 October and press conference schedule.
- U.S. Bureau of Economic Analysis — Release schedule — Q3 GDP advance estimate and September Personal Income and Outlays scheduled for 29 October.
- European Central Bank — Governing Council meeting schedule — ECB monetary-policy meeting and press conference on 29 October.
- Bank of Japan — Release schedule — Monetary-policy meeting on 29–30 October and statement/outlook on 30 October.
- Larsen & Toubro — Investor events — L&T Q2/H1 FY27 results and earnings call scheduled for 27 October.
Educational disclaimer: This review is for education and general financial awareness only. It is not investment, tax, legal, accounting or personalised financial advice. Market prices, index levels, commodity prices, exchange rates and provisional institutional-flow figures can change or be revised after publication. Verify current information with the relevant exchange, regulator, issuer or qualified professional before making financial decisions.