

EPS, the P/E ratio and the PEG ratio are widely used to connect a company’s earnings with its share price and expected growth. They can help investors compare businesses, but none of them can determine whether a stock is attractive on its own.
The learning sequence is simple:
- EPS measures earnings attributable to each weighted-average equity share.
- P/E compares the market price per share with EPS.
- PEG relates the P/E multiple to an expected earnings-growth rate.
These ratios belong inside a broader fundamental-analysis process. This article explains their formulas, interpretation, limitations and proper use. It is educational, not investment advice.
What Is Earnings Per Share?
Earnings per share, or EPS, expresses profit attributable to equity shareholders on a per-share basis.
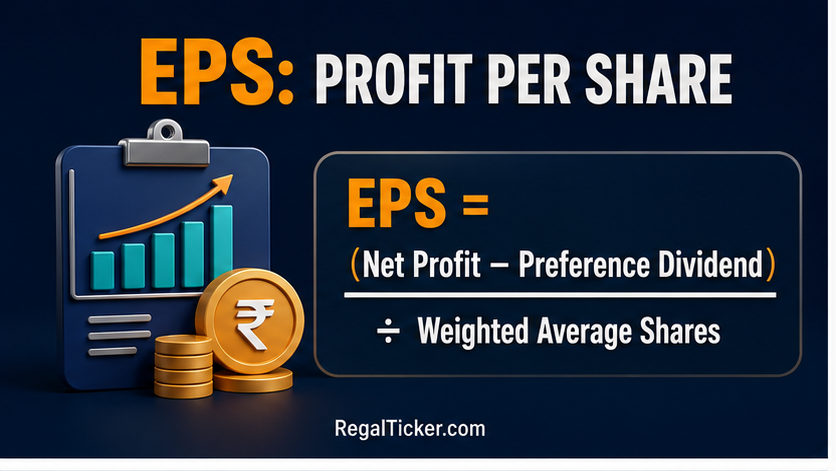
A simplified basic EPS formula is:
Basic EPS = (Profit Attributable to Equity Shareholders − Preference Dividends) ÷ Weighted Average Number of Equity Shares
The exact presentation follows applicable accounting standards and company disclosures. Investors should use the reported numerator, denominator and notes instead of rebuilding EPS from unrelated headline figures.
If profit available to equity shareholders is ₹500 crore and the weighted average number of shares is 100 crore, basic EPS is ₹5.
₹500 crore ÷ 100 crore shares = ₹5 per share
EPS converts an absolute profit into a per-share measure, making it easier to relate earnings to the quoted share price. Before using EPS, understand the profit line through Revenue, Profit and Profit Margins and How to Read an Income Statement.
Why Use Weighted Average Shares?
The number of shares can change during a reporting period because of new issues, buybacks, employee options, conversions, bonus issues or other corporate actions. Using only the year-end share count can misrepresent how many shares participated in the year’s earnings.
A weighted average gives each share count the appropriate time weight.
For example, if a company had 10 crore shares for six months and 12 crore for six months, the simplified weighted average would be 11 crore shares:
(10 × 6/12) + (12 × 6/12) = 11 crore
Corporate actions can require retrospective adjustments to comparative EPS. Always read the EPS note.
Basic EPS vs Diluted EPS
Basic EPS uses the weighted-average equity shares actually outstanding, subject to the applicable calculation rules.
Diluted EPS also considers potential equity shares—such as convertible instruments or employee options—when their effect would reduce EPS. Diluted EPS helps investors see possible dilution.
If basic EPS is ₹10 and diluted EPS is ₹8.80, potential shares could meaningfully reduce earnings attributable to each share. The gap deserves attention, but the notes must explain the instruments and assumptions.
What Does EPS Tell Investors?
EPS can help answer:
- Is per-share earnings growing over several years?
- Is profit growth keeping pace with share-count growth?
- Is diluted EPS materially below basic EPS?
- Is growth driven by operations or one-time gains?
- Does operating cash flow support reported earnings?
EPS is not cash flow. Use the three-financial-statements connection guide and cash-flow statement guide to test earnings quality.
What Is the P/E Ratio?
The price-to-earnings ratio compares the market price per share with earnings per share.
P/E Ratio = Market Price per Share ÷ EPS
If a share trades at ₹200 and EPS is ₹10, its P/E ratio is 20:
₹200 ÷ ₹10 = 20 times

In simple language, the market price equals 20 times the annual earnings represented by the chosen EPS. This does not mean investors will recover their money in exactly 20 years. Earnings, prices, reinvestment, dividends and risk change.
NSE describes P/E as a measure used to assess how expensive a stock is relative to comparable securities or an industry benchmark. The comparison must still account for growth, quality, leverage and cyclicality.
How to Interpret a High or Low P/E
A high P/E may reflect:
- Expectations of faster earnings growth
- Strong business quality or competitive advantages
- More predictable earnings
- A temporarily depressed EPS denominator
- Excessive optimism
A low P/E may reflect:
- Slower expected growth
- Cyclical earnings near a peak
- Financial, governance or business risk
- A temporarily elevated EPS denominator
- Undervaluation
Therefore, “low P/E is cheap” and “high P/E is expensive” are incomplete conclusions.
Market capitalisation measures the total market value of equity, while P/E relates the per-share price to per-share earnings. Share-price discovery explains why market expectations can move the price even before reported EPS changes.
Trailing P/E vs Forward P/E
Trailing P/E
Trailing P/E generally uses earnings from the completed trailing period, often the last twelve months. It is based on reported results, though those results can contain exceptional items.
Forward P/E
Forward P/E uses forecast earnings for a future period. It can reflect anticipated changes earlier, but it depends on estimates that may be wrong.
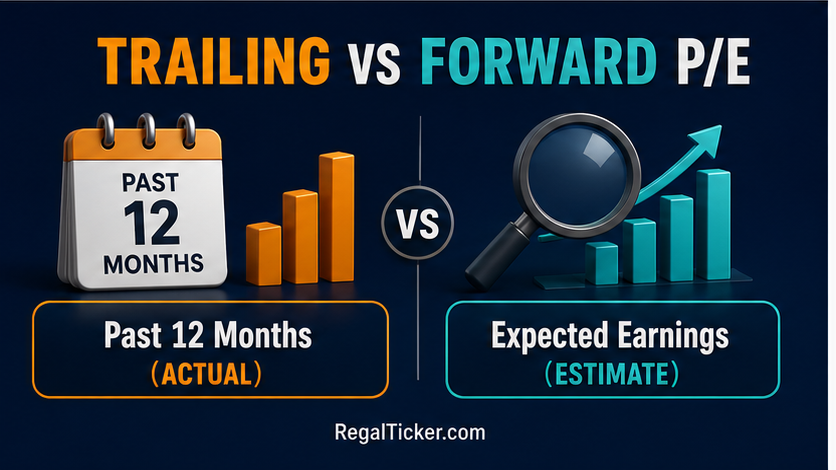
Never compare a trailing P/E for one company with a forward P/E for another without recognising the mismatch. Also check whether the EPS is standalone or consolidated and whether the price and earnings refer to compatible dates.
What Happens When EPS Is Negative?
When EPS is negative, the conventional P/E ratio is negative or not meaningful. Many data platforms show “NA” instead of a negative multiple.
Do not treat the absence of P/E as proof that a loss-making company has no value. Investors may examine revenue growth, cash runway, assets, unit economics and a path to profitability. However, those alternatives introduce their own assumptions and risks.
The PEG ratio is also generally not useful when P/E or the growth rate lacks a sensible positive basis.
What Is the PEG Ratio?
The price/earnings-to-growth ratio adjusts the P/E multiple by an earnings-growth rate.
PEG Ratio = P/E Ratio ÷ Earnings Growth Rate
In the common convention, the growth rate is entered as a whole percentage number. If P/E is 24 and expected annual EPS growth is 20%, PEG is 1.2:
24 ÷ 20 = 1.2
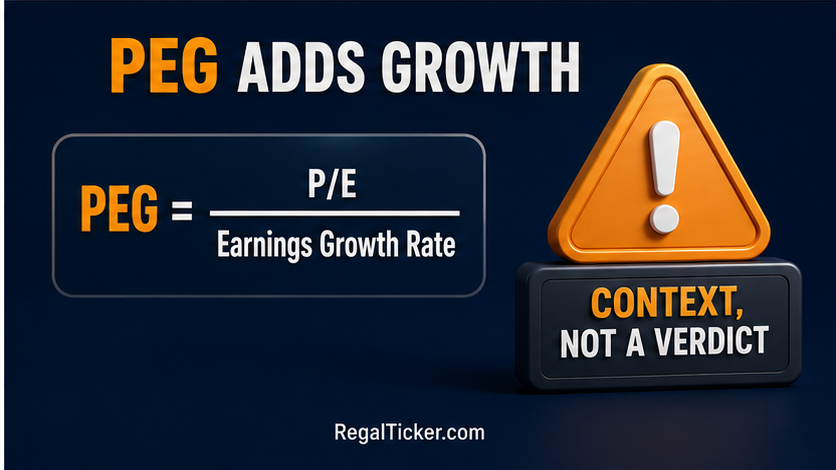
A rule of thumb sometimes interprets a PEG near 1 as price and growth being broadly aligned, below 1 as potentially inexpensive relative to growth, and above 1 as potentially expensive. This is not a universal valuation law.
Why PEG Can Mislead
PEG is highly sensitive to the growth input. Ask:
- Is growth historical, forecast or a multi-year estimate?
- Is it sustainable or boosted by a low base?
- Is the company cyclical?
- Are estimates from a credible and consistent source?
- Does growth require heavy debt or capital expenditure?
- Is earnings quality strong?
Two analysts can calculate different PEG ratios using the same P/E but different growth periods. A company with volatile or negative growth can produce a meaningless result.
PEG also does not directly capture balance-sheet risk, cash conversion, return on capital or business quality. Those factors belong in later lessons, including ROE, ROCE and debt-to-equity analysis.
A Complete Worked Example
Consider two hypothetical companies:
| Measure | Company A | Company B |
|---|---|---|
| Market price | ₹300 | ₹300 |
| EPS | ₹15 | ₹10 |
| P/E | 20x | 30x |
| Expected EPS growth | 10% | 25% |
| Simplified PEG | 2.0 | 1.2 |
Company A has the lower P/E, but Company B has the lower simplified PEG because of its higher expected growth. This still does not prove Company B is better. Its forecast may be uncertain, its balance sheet may carry more debt, or its growth may require heavy investment.
Use the ratios as questions:
- Why does the market assign different multiples?
- How reliable are the growth assumptions?
- Which company converts profit into cash?
- Which business earns better returns on capital?
- What could invalidate the forecast?
How Share Count Changes Affect EPS and P/E
If profit remains constant but the weighted-average share count increases, EPS falls. At an unchanged market price, P/E rises.
If a company buys back shares, EPS may rise even if total profit does not. A buyback can be sensible capital allocation, but investors should distinguish per-share improvement caused by business growth from improvement caused by a smaller denominator.
Bonus issues and stock splits change share count and per-share figures without automatically changing the company’s underlying value. Use adjusted historical data when comparing periods.
Reported EPS vs Adjusted EPS
Reported EPS follows the applicable financial-reporting presentation. Analysts may also calculate adjusted EPS after removing items considered non-recurring.
Adjusted figures can reveal underlying operations, but they require judgement. Excluding recurring “exceptional” costs every year can make performance look better than it is. Reconcile adjusted EPS to reported profit and read the notes.
Sector and Cycle Matter
P/E works best when earnings are positive and reasonably representative.
- Banks and financial companies require sector-specific measures and asset-quality analysis.
- Commodity producers can look cheapest near peak earnings and expensive near trough earnings.
- Early-stage businesses may have negative EPS.
- Asset-heavy sectors require debt, cash flow and return-on-capital analysis.
- Companies with large non-operating income can show misleading headline EPS.
Compare businesses with relevant peers and with their own history. Do not compare unrelated sectors only because both have a P/E number.
A Practical Investor Checklist
Before using EPS, P/E or PEG:
- Confirm whether figures are consolidated or standalone.
- Check basic and diluted EPS.
- Separate recurring operations from exceptional gains or losses.
- Compare EPS growth across several years.
- Compare profit with operating cash flow.
- Identify whether P/E is trailing or forward.
- Use a consistent growth period for PEG.
- Compare suitable peers and the company’s historical range.
- Review debt, margins, return ratios and capital needs.
- Treat the output as one input, not a verdict.
You can use the calculators and learning resources in RegalTicker.com Investor Tools to organise calculations. Verify every input against the company filing.
Common Mistakes
- Using year-end shares instead of weighted-average shares
- Ignoring diluted EPS
- Comparing forward and trailing P/E
- Calling every low-P/E stock cheap
- Using PEG with negative or unstable growth
- Mixing standalone EPS with a consolidated comparison
- Ignoring exceptional items
- Comparing unrelated sectors
- Assuming a ratio is a price target
Where to Find and Verify the Data
Use audited annual reports, quarterly financial results and exchange filings. NSE’s corporate financial-results page provides access to listed-company filings. SEBI’s fundamental-analysis guidance identifies EPS and P/E among the metrics used in company analysis, while NSE’s P/E explanation describes its use as a comparison measure.
Data portals can be convenient, but source filings are better for checking the EPS period, exceptional items, dilution and consolidated status.
Frequently Asked Questions
Is higher EPS always better?
Not automatically. Compare the source, sustainability, share-count changes, cash conversion and capital required to generate it.
Is a low P/E ratio good?
It may indicate undervaluation or genuine business risk. Sector, earnings cycle, growth and balance-sheet quality matter.
What is a good PEG ratio?
There is no universally good number. A value near 1 is only a rough convention and depends heavily on the growth estimate.
Can P/E be negative?
Mathematically yes when EPS is negative, but conventional P/E is generally treated as not meaningful.
Should I use standalone or consolidated EPS?
For a group with important subsidiaries, consolidated figures usually provide the broader view. Keep the price, EPS and peer comparisons consistent.
Final Takeaway
EPS tells you how much reported earnings relate to each weighted-average share. P/E tells you how the market price compares with those earnings. PEG adds an assumed growth rate to that comparison.
Used together, they create a useful valuation conversation. Used alone, they can create false confidence. Verify the inputs, understand the business and connect the ratios to financial statements, cash flow, debt, returns and realistic growth expectations.