
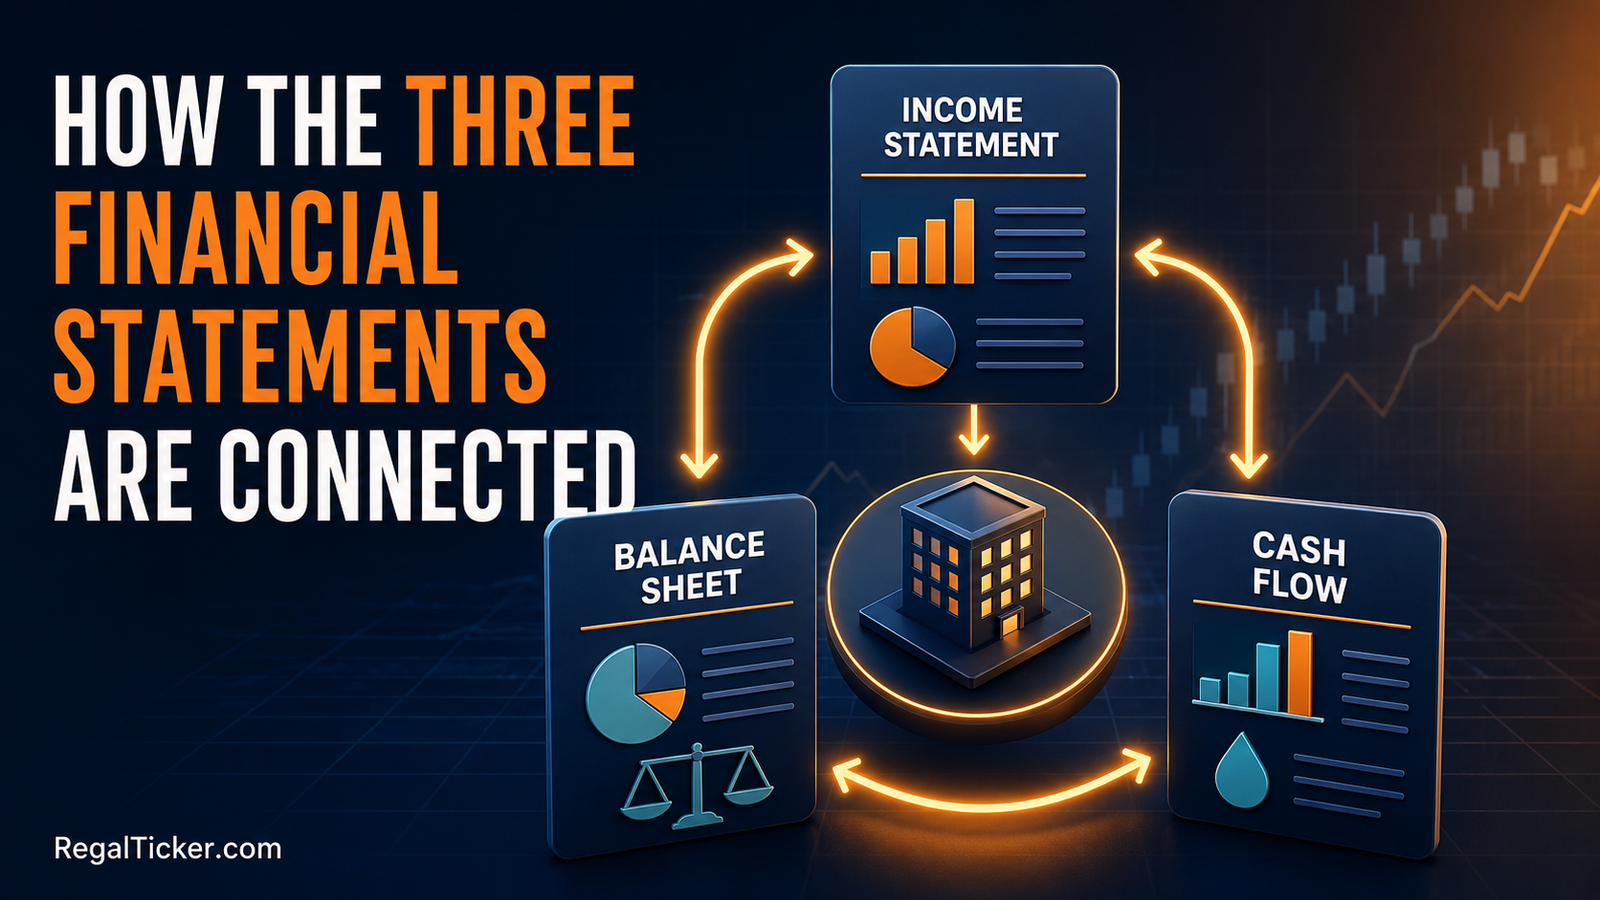
An income statement, balance sheet and cash flow statement do not describe three separate businesses. They describe the same company from three different angles. The income statement measures performance over a period, the balance sheet shows financial position on a date, and the cash flow statement explains how cash changed between two dates.
Understanding these links is an important step in fundamental analysis. A profit number becomes much more useful when you can trace it into retained earnings, operating cash flow and the closing cash balance.
This guide explains how the three financial statements are connected, using a simplified Indian-company example. It is educational and is not a recommendation to buy or sell any security.
What Are the Three Main Financial Statements?
Income statement
The income statement, also called the statement of profit and loss, reports revenue, expenses and profit for a period. It answers: Did the company earn a profit from its activities?
If these terms are new, first read Revenue, Profit and Profit Margins Explained and How to Read an Income Statement.
Balance sheet
The balance sheet reports assets, liabilities and shareholders’ equity at a specific date. It answers: What does the company own, what does it owe, and what remains for shareholders?
Our balance-sheet guide explains its individual line items.
Cash flow statement
The cash flow statement reconciles the opening and closing cash positions through operating, investing and financing activities. It answers: Where did cash come from and where did it go?
Read How to Read a Cash Flow Statement for a section-by-section explanation.
The Three-Statement Connection Map
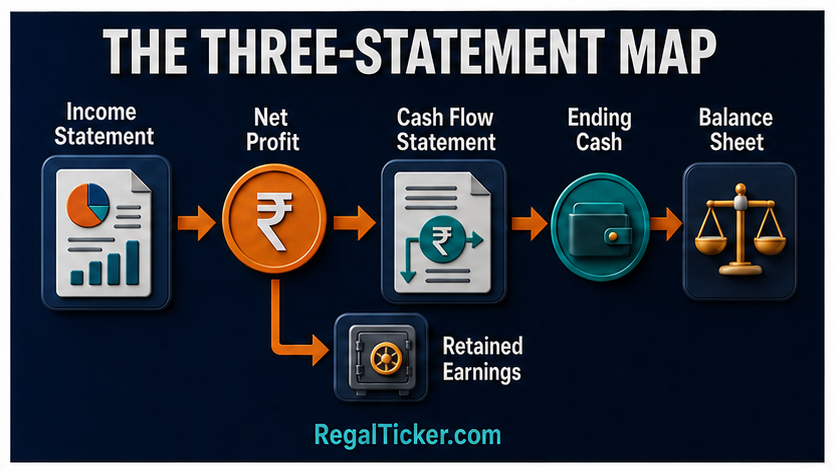
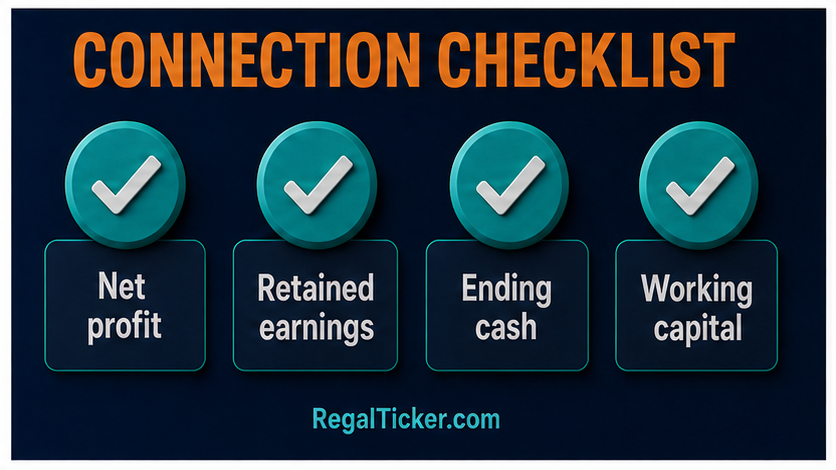
The principal links are:
- Net profit from the income statement enters the cash flow statement under the indirect method.
- Profit retained in the business contributes to retained earnings within equity.
- Non-cash expenses and working-capital changes connect profit with operating cash flow.
- Investing and financing cash flows change assets, debt and equity on the balance sheet.
- Closing cash calculated by the cash flow statement appears as cash on the closing balance sheet.
The accounting equation must still hold:
Assets = Liabilities + Shareholders’ Equity
This is why a change rarely affects only one line. Buying equipment reduces cash but adds a fixed asset. Taking a loan adds cash and debt. Making a credit sale raises revenue and receivables before cash is collected.
Link 1: Net Profit Flows Into the Cash Flow Statement
Under the indirect method commonly seen in annual reports, cash flow from operating activities begins with profit before tax or net profit and then reconciles accounting profit to operating cash.
Suppose a company reports net profit of ₹100 crore. That does not mean cash increased by ₹100 crore. The calculation must adjust for:
- Depreciation and other non-cash expenses
- Gains or losses classified elsewhere
- Changes in receivables, inventory and payables
- Taxes and other operating items
This bridge is essential because the income statement follows accrual accounting. Revenue can be recognised before the customer pays, and an expense can be recorded before or after the related cash movement.
Link 2: Profit Is Not the Same as Cash
Consider this simplified reconciliation:
- Net profit: ₹100 crore
- Add depreciation: ₹20 crore
- Increase in receivables: ₹15 crore cash use
- Increase in inventory: ₹10 crore cash use
- Increase in payables: ₹8 crore cash source
Simplified operating cash flow becomes ₹103 crore:
₹100 + ₹20 − ₹15 − ₹10 + ₹8 = ₹103 crore
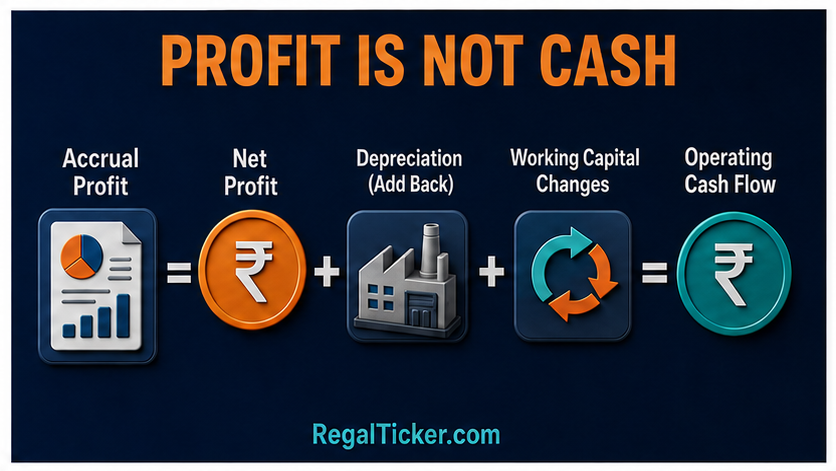
Depreciation reduced reported profit but did not require a current-period cash payment, so it is added back. Receivables and inventory absorbed cash, while higher payables temporarily conserved cash.
Investors should compare profit with operating cash flow across several years. A single mismatch may be normal. Repeated profit growth without corresponding operating cash deserves investigation.
Link 3: Net Profit Connects to Retained Earnings
Shareholders’ equity includes accumulated profits retained by the company. A simplified relationship is:
Closing Retained Earnings = Opening Retained Earnings + Net Profit − Dividends ± Adjustments
If opening retained earnings were ₹500 crore, net profit was ₹100 crore and dividends were ₹30 crore, closing retained earnings would be ₹570 crore before other adjustments.
The full statement of changes in equity can include other comprehensive income, prior-period adjustments, share issues, buybacks and transactions with non-controlling interests. Therefore, do not assume the simple formula explains every movement; use it as a starting bridge.
Retained earnings are an accounting balance, not a bank account. A company may have substantial retained earnings while its cash is invested in factories, inventory, receivables or acquisitions.
Link 4: Working Capital Connects the Balance Sheet and Cash Flow
Working-capital accounts sit on the balance sheet, but changes in them affect operating cash flow.
- Receivables increase: sales recognised but cash not yet collected; usually a cash use.
- Inventory increases: cash tied up in goods; usually a cash use.
- Payables increase: supplier payments delayed; usually a cash source.
- Customer advances increase: cash collected before revenue recognition; usually a cash source.
Always analyse the reason for a movement. Rising receivables might accompany healthy growth, but receivables rising much faster than revenue can indicate slower collection. Similarly, inventory growth may prepare for demand or signal unsold goods.
Link 5: Capital Expenditure Touches All Three Statements
Suppose a manufacturer buys machinery for ₹60 crore in cash.
At purchase:
- Investing cash flow shows a ₹60 crore outflow.
- Cash on the balance sheet falls by ₹60 crore.
- Property, plant and equipment rises by ₹60 crore, before taxes and other details.
- The full ₹60 crore usually does not become an immediate income-statement expense.
Over the asset’s useful life, depreciation is charged:
- Depreciation reduces income-statement profit.
- Accumulated depreciation reduces the asset’s carrying amount.
- Depreciation is added back in operating cash flow because it is non-cash in that period.

This distinction explains why capital-intensive businesses can report healthy operating cash flow yet have low free cash flow after capital expenditure.
Link 6: Borrowing Connects Financing Cash Flow and the Balance Sheet
If a company borrows ₹200 crore:
- Financing cash flow records a ₹200 crore inflow.
- Cash rises by ₹200 crore.
- Borrowings rise by ₹200 crore.
Repaying principal produces a financing outflow and reduces debt. Interest expense normally affects profit, while its cash classification follows the applicable reporting framework and company presentation. Check the accounting policy and notes rather than assuming every company presents it identically.
Debt can make cash look strong temporarily. Investors should distinguish cash generated by operations from cash received through borrowing.
Link 7: Share Issues, Buybacks and Dividends
Issuing shares generally increases cash and equity. A buyback generally reduces cash and equity. Dividends reduce cash and retained earnings when recognised and paid through the relevant stages.
These activities do not represent operating performance. They are financing and capital-allocation decisions. This is one reason investors should not judge a business solely from the closing cash balance.
Link 8: Closing Cash Must Reconcile
The cash flow statement completes this bridge:
Opening Cash + Net Change in Cash = Closing Cash
The closing cash and cash equivalents should reconcile with the corresponding balance-sheet amount, subject to items explained in the notes. Foreign-exchange effects, bank overdrafts and restricted balances can create presentation differences, so read the reconciliation.
If the statements do not appear to connect, first check whether you mixed consolidated and standalone figures, different reporting periods or different units such as lakhs and crores.
A Simplified Three-Statement Example
Imagine a company starts with ₹50 crore cash. During the year:
- It earns ₹40 crore net profit.
- Depreciation is ₹10 crore.
- Working capital absorbs ₹12 crore.
- It spends ₹25 crore on equipment.
- It borrows ₹15 crore.
- It pays ₹8 crore in dividends.
Simplified operating cash flow is ₹38 crore:
₹40 + ₹10 − ₹12 = ₹38 crore
Net cash change is:
₹38 − ₹25 + ₹15 − ₹8 = ₹20 crore
Closing cash becomes ₹70 crore. Meanwhile, the balance sheet also reflects the new equipment, depreciation, higher borrowings and the retained portion of profit.
The purpose of this example is not to reproduce every accounting line. It shows that the closing cash number is the combined outcome of profitability, accrual adjustments, investment and financing.
How Investors Should Read the Statements Together
Use this practical sequence:
- Read revenue, operating profit and net profit trends.
- Compare net profit with operating cash flow.
- Identify which working-capital accounts explain the difference.
- Review capital expenditure and acquisitions.
- See whether investment was funded by operations, debt or new equity.
- Reconcile closing cash with the balance sheet.
- Trace profit into retained earnings and dividends.
- Read the notes for unusual or non-recurring items.
You can organise the figures using the calculators and analysis resources in RegalTicker.com Investor Tools. Tools can speed up arithmetic, but they cannot replace reading the filing and understanding the business.
Red Flags Revealed by Connecting the Statements
Profit rises while operating cash repeatedly falls
This may result from aggressive revenue recognition, weak collections, inventory accumulation or other working-capital pressure.
Borrowing funds dividends or routine operations
Debt is not automatically bad, but repeated dependence on borrowing for ordinary needs may weaken financial resilience.
Capital expenditure grows without operating improvement
Expansion takes time, yet investors should eventually look for better capacity, revenue, margins or cash generation.
Receivables grow faster than revenue
This can indicate longer credit terms or collection difficulty. Compare receivable days and read management commentary.
Large “other” balances dominate
Material other assets, liabilities, income or expenses require note-level investigation. The label alone gives too little information.
Common Mistakes
- Treating net profit as cash generated
- Reading one statement or one year in isolation
- Mixing standalone and consolidated accounts
- Ignoring units and reporting periods
- Assuming all retained earnings are available cash
- Treating borrowed cash as evidence of operating strength
- Ignoring notes, accounting policies and auditor observations
Where to Verify the Numbers
Use the company’s annual report and exchange filings. NSE provides a corporate financial-results filing page, while SEBI’s fundamental-analysis guidance explains why investors examine financial statements and valuation metrics.
Prefer audited consolidated annual statements for a group-wide view, then use quarterly results for recent developments. Always compare like with like.
Frequently Asked Questions
Which statement should I read first?
There is no compulsory order, but beginners can start with the income statement, move to the balance sheet and then use the cash flow statement to reconcile profit with cash.
Where does net profit appear on the balance sheet?
The retained portion contributes to equity through retained earnings, subject to dividends and other adjustments shown in the statement of changes in equity.
Why is depreciation added back in cash flow?
It reduces accounting profit without causing a cash payment in that reporting period. The original asset purchase appears as an investing cash flow when paid.
Can a profitable company run short of cash?
Yes. Cash may be tied up in receivables, inventory or capital expenditure, or used for debt repayment and distributions.
Does closing cash always equal the balance-sheet cash line exactly?
It should reconcile, but presentation differences may arise from cash-equivalent definitions, overdrafts, restricted balances and foreign-exchange effects. Read the reconciliation and notes.
Final Takeaway
The three statements form one connected financial story. Net profit links the income statement to cash flow and retained earnings. Working capital explains part of the difference between profit and operating cash. Investing and financing activities change both cash and balance-sheet accounts. Closing cash completes the bridge.
Once you can trace these connections, individual figures stop looking isolated. You can ask the more useful question: how did the company produce profit, finance its assets and convert performance into cash?