
The indices recovered from the lows, but the session stayed defensive
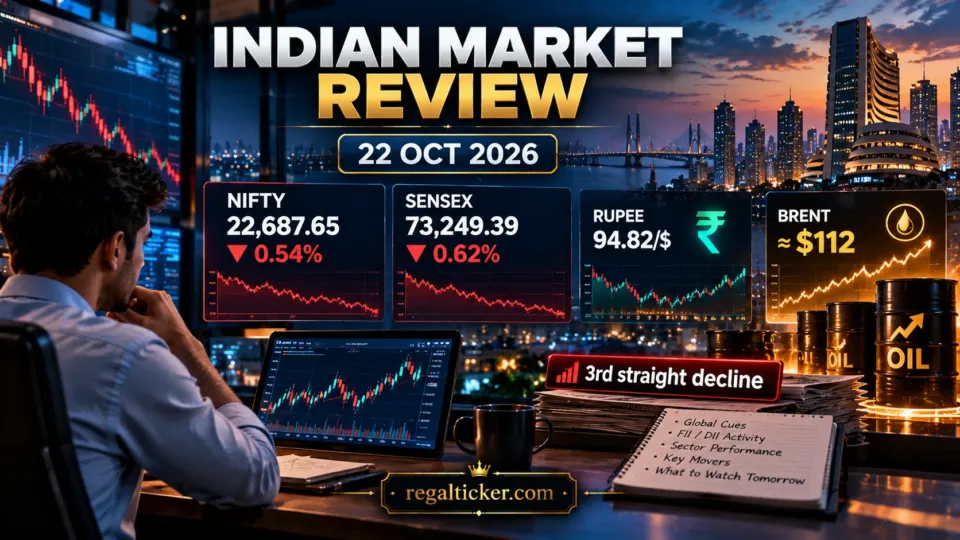
Indian equities closed lower for a third consecutive session on Thursday, 22 October 2026, as another jump in crude oil reinforced the inflation and currency risks facing an oil-importing economy. The Nifty 50 ended at 22,687.65, down 123.70 points or 0.54%, while the Sensex closed at 73,249.39, down 460.30 points or 0.62%. Both benchmarks recovered from deeper intraday losses, but that late improvement did not change the broader message of the session: participation remained weak, mid- and small-cap shares underperformed, and most major sectors finished lower.
Brent crude was trading around $112.40 per barrel, its highest level since May, as the Middle East conflict kept a large geopolitical risk premium in energy prices. The rupee also snapped an eight-session winning streak and closed near ₹94.8175 per US dollar. For Indian investors, the combination matters because expensive oil can pressure inflation, the current account, the currency and corporate margins at the same time.
The useful lesson from Thursday is therefore not simply that the market fell. The more important signal is that the index decline was accompanied by weak breadth, pressure in heavyweight stocks and a renewed oil-currency squeeze. That makes the next session less about predicting a rebound and more about watching whether support near the recent lows attracts broad buying or only another narrow index recovery.
⚡ Quick answer
What happened in the Indian stock market on 22 October 2026?
Nifty fell 0.54% to 22,687.65 and Sensex lost 0.62% to 73,249.39 as Brent crude climbed to about $112.40, the rupee weakened to roughly ₹94.82 per dollar, and market breadth stayed poor. Mid- and small-cap indices lost about 1%, Media fell about 2.3%, and IT, FMCG, Auto, Energy and Oil & Gas were also under pressure.
Key takeaways
Nifty and Sensex declined for a third consecutive session.
The Nifty's intraday low was 22,554.85, showing that the market tested the 22,500–22,600 support area before recovering part of the loss.
Breadth was weak
roughly 1,323 shares advanced, 2,670 declined and 155 were unchanged in Moneycontrol's closing market count.
Mid- and small-cap indices fell about 1%, so weakness was broader than the headline benchmarks.
Brent crude rose to about $112.40 per barrel, keeping inflation, rupee and margin risks in focus.
The rupee closed at ₹94.8175 per dollar, down about 0.4%, ending an eight-session winning streak.
HDFC Bank and Reliance Industries were among the biggest index drags; ICICI Bank, Bajaj Finance and SBI offered partial support.
The latest completed provisional cash-flow data available at article cut-off was for 21 October, when FIIs bought about ₹1,022 crore and DIIs bought about ₹1,614 crore. Today's cash-flow number should be checked separately once the exchange publishes it.
1. Market scorecard: benchmarks fell, broader markets fell more
Thursday's closing numbers show a market that was weak across more than just the headline indices.
| Market measure | Closing / reading | Day move |
|---|---|---|
| Nifty 50 | 22,687.65 | -0.54% |
| Sensex | 73,249.39 | -0.62% |
| Nifty Midcap | — | about -0.9% to -1.0% |
| Nifty Smallcap | — | about -1.0% to -1.1% |
| Rupee / US dollar | ₹94.8175 | about -0.4% |
| Brent crude | about $112.40/barrel | +3.3% at Reuters' latest reading |
The Nifty opened at 22,687.75, almost exactly where it eventually closed, but the route between those two points was volatile. It fell as low as 22,554.85 before recovering. That intraday rebound matters because buyers did appear around the lower support area, but the failure to recover into positive territory shows that demand was not strong enough to reverse the broader risk-off tone.
Highlight
Closing off the low is better than closing at the low—but it is not a trend reversal
A market can recover sharply from its intraday low and still remain technically weak. The quality of the next rebound matters more if breadth improves and heavyweight participation broadens.
2. Why the market fell: crude oil became the dominant macro variable
The clearest macro pressure was crude oil. Reuters reported Brent around $112.40 per barrel, up roughly 3.3%, as escalating Middle East tensions increased concerns about regional supply even though physical oil flows had not yet been materially disrupted.
For India, the sensitivity is unusually high because the country imports close to 90% of its crude requirement. A sustained oil shock can transmit through several channels:
- the oil import bill rises;
- demand for US dollars increases;
- the rupee comes under pressure;
- imported inflation risk rises;
- transport, packaging and petrochemical-linked input costs can increase;
- pressure can build on companies that cannot immediately pass higher costs to customers.
This is why a crude-price shock can affect both macro variables and bottom-up earnings. Investors analysing an individual company should still separate temporary commodity volatility from a genuine deterioration in business quality. RegalTicker's fundamental analysis guide can help structure that distinction.
3. Market breadth was the more important warning than the index loss
The market's internal participation remained weak. Moneycontrol's closing tally showed about 1,323 advancing shares versus 2,670 declining shares, with 155 unchanged. In other words, roughly twice as many tracked shares fell as rose.
That is more informative than looking only at a 0.54% fall in the Nifty. A relatively modest benchmark decline can hide much deeper stress underneath when a few heavyweight stocks support the index while a large number of mid- and small-cap shares fall.
The broader indices confirmed that pattern. Reuters reported small-caps down about 1.1% and mid-caps down about 0.9%. Moneycontrol's closing feed similarly showed the broader indices losing around 1%.
📖 Definition
Why market breadth matters
Market breadth compares the number of advancing shares with declining shares. When an index is stable but breadth is deeply negative, the average stock can be performing much worse than the headline index suggests.
4. Sector map: there was almost nowhere to hide
Sectoral weakness was broad. Moneycontrol's closing report said all tracked sector indices ended in the red. The Media index fell about 2.3%, while Auto, Consumer Durables, Oil & Gas, IT, Energy and FMCG lost roughly 0.5% to 1.7%.
The pattern is economically intuitive. High crude can pressure transport-sensitive and consumption-linked businesses, while a risk-off global session can weigh on technology and other high-beta sectors. But investors should avoid turning one day's sector move into a permanent conclusion. A sector can fall because of macro positioning, company-specific news, valuation, earnings revisions or simple de-risking.
For readers who want to distinguish price action from business fundamentals, RegalTicker's technical analysis hub and fundamental analysis process are designed to be used together rather than as substitutes.
5. Heavyweights mattered: HDFC Bank and Reliance pulled the indices down
The benchmark decline was amplified by weakness in large index constituents. Moneycontrol's contribution data showed HDFC Bank and Reliance Industries among the largest drags on the Sensex, with Infosys, Eternal and ITC also contributing negatively at different points in the session.
On the positive side, ICICI Bank, Bajaj Finance, SBI, Bharti Airtel and Larsen & Toubro provided some support. The closing Nifty gainers included Bajaj Finance, Cipla, SBI, Bajaj Auto and ICICI Bank, while the losers included Nestle India, Tata Motors Passenger Vehicles, HDFC Life, Tech Mahindra and Reliance Industries.
This is a useful reminder that headline index performance is weighted. A small number of very large companies can materially change the Nifty or Sensex even when the wider market is moving differently.
6. Stock-specific stress added to the weak macro backdrop
Macro pressure was not the only source of selling. Reuters reported that Nestle India, Abbott India and Zydus Wellness weakened after receiving notices from India's food-safety regulator. Separately, cybersecurity company eMudhra fell 20%, extending a steep two-session decline amid concerns related to compromised digital certificates.
These are fundamentally different risks from an oil shock. Oil is a macro input that affects many companies simultaneously; a regulatory notice or cybersecurity issue is company-specific. Investors should therefore avoid using a single market narrative to explain every stock decline.
Investor note
Separate market risk from company risk
If the whole market is falling because of oil and global risk aversion, that does not automatically explain a 10% or 20% move in one company. Company-specific disclosures, balance-sheet risk and regulation still need independent analysis.
7. Rupee weakness confirmed that oil was affecting more than equities
The rupee closed around ₹94.8175 per US dollar, down about 0.4%, snapping an eight-session rally. Reuters said the currency had traded at its strongest level in more than six weeks earlier in the session before oil and risk aversion reversed the move.
That reversal is important. Foreign inflows linked to the Jio Platforms IPO and RBI measures had been supporting the rupee, but higher oil created renewed local dollar demand. When oil rises sharply, importers need more dollars to pay for the same quantity of crude. That can weaken the currency unless offset by capital inflows or central-bank intervention.
For equity investors, a weaker rupee is not uniformly negative. Exporters can receive translation support, while import-dependent businesses may face higher costs. The effect depends on hedging, pricing power and the company's actual currency exposure.
8. FII and DII flows: do not guess today's number before it is published
At the article cut-off, the latest completed provisional cash-market flow data available was for 21 October 2026:
| Investor group | Net cash activity |
|---|---|
| FII/FPI | +₹1,022.32 crore |
| DII | +₹1,614.32 crore |
Those numbers show both foreign and domestic institutions were net buyers in the previous completed session, even though the market closed lower on 21 October. That is a useful example of why daily FII/DII numbers should not be treated as a complete explanation for index direction.
The 22 October provisional flow number was not yet available in the source feed when this review was prepared. RegalTicker will not substitute an estimate for exchange data.
⭐ Pro tip
Institutional-flow data is context—not a trading signal by itself
One day's FII purchase can coexist with a falling market if selling comes from other participants, index heavyweights decline, derivatives positioning changes or buying is concentrated in a narrow set of stocks.
9. Volatility stayed elevated as the market tested support
India VIX remained around the mid-15 area during the session after having risen sharply in the previous session. It reached an intraday high above 16.6, showing that option-implied volatility remained elevated even as the indices recovered from their lows.
The Nifty's 22,554.85 intraday low was important because it moved into the support area that technicians had been watching before the session. Analysts cited 22,500–22,400 as a key downside zone. A deeper break below 22,400 could bring the recent low around 22,180 back into focus, while recovery attempts would first need to reclaim the 22,800–23,000 area.
These are reference zones, not forecasts. Price levels become more meaningful when combined with breadth, volume, volatility and the behaviour of major sectors. Readers building a repeatable framework can use RegalTicker's risk management guide rather than relying on a single support or resistance number.
10. What investors should watch in the next session
The next session has several clearly defined variables.
Crude oil
If Brent remains above $110 or pushes higher, the inflation-and-currency narrative is likely to remain a major overhang. A meaningful de-escalation in the Middle East could remove part of the geopolitical premium, but that should be observed in price rather than assumed.
Nifty 22,500–22,400 support
Thursday's low was 22,554.85. A decisive break below the nearby support band would weaken the short-term setup further. A recovery back above 22,800 would be the first sign that buyers are regaining some control, while 23,000 remains an important psychological and technical hurdle.
Rupee
The rupee's reversal to 94.8175 per dollar showed that oil can overpower supportive portfolio inflows in the short term. Another sharp currency move would matter for import-heavy sectors and overall risk sentiment.
Breadth
A benchmark bounce will be more credible if the advance-decline ratio improves. Another session where mid- and small-caps lag while only a handful of heavyweights rise would keep the recovery fragile.
Earnings and stock-specific news
Quarterly results, regulatory notices and company disclosures remain capable of creating large single-stock moves even when the macro environment dominates the index.
Before reacting to tomorrow's opening
- Is Brent moving higher or lower from the $112 area?
- Is the rupee stabilising or extending the decline?
- Does Nifty hold above 22,500–22,400?
- Are more stocks advancing than declining?
- Is the rebound broad, or driven by two or three index heavyweights?
- Has the company you own released any new earnings, regulatory or corporate-action disclosure?
11. How to use today's review without turning it into a prediction
A daily review is most useful when it updates the evidence rather than tells an investor what must happen next. Thursday's evidence says oil risk is elevated, breadth is weak, the rupee has lost momentum and the Nifty is testing an important support zone. None of those facts guarantees another down day.
Long-term investors can use this information to review portfolio concentration, valuation and exposure to common macro risks. Traders may focus more heavily on price levels and volatility, but both groups benefit from defining risk before acting. RegalTicker's Market Review archive helps place one session in a wider context, while the Risk Management guide provides a framework for position sizing and downside planning.
RELATED TOOLS: TITLE: Useful RegalTicker resources
| Risk Management | /risk-management | Build a repeatable process for portfolio and position risk instead of reacting to one volatile session. |
|---|---|---|
| Fundamental Analysis | /how-to-analyse-a-company-fundamentally | Separate changes in market sentiment from changes in business quality and earnings power. |
| Technical Analysis | /technical-analysis | Learn how support, resistance, trend and volatility fit together. |
| Monthly Market Review | /market-review | Put daily moves into a broader market, earnings and valuation context. |
| Demerger Cost Basis Calculator | /tools/demerger-cost-basis-calculator | If a portfolio company undergoes a demerger, allocate the original cost basis between the resulting holdings instead of confusing the corporate action with an investment gain or loss. |
12. Frequently asked questions
Why did the Indian stock market fall on 22 October 2026?
The dominant macro pressure was the jump in crude oil amid Middle East tensions. Higher oil raised concerns about inflation, the rupee, India's import bill and corporate margins. Weak breadth and declines in heavyweight stocks added to the pressure.
Where did Nifty close today?
The Nifty 50 closed at 22,687.65, down 123.70 points or 0.54%.
Where did Sensex close today?
The Sensex ended at 73,249.39, down 460.30 points or 0.62%.
Why is Brent crude important for India?
India imports most of its crude-oil requirement. Higher oil can increase the import bill, strengthen demand for dollars, pressure the rupee, raise inflation risk and squeeze margins for fuel- and petrochemical-sensitive businesses.
What happened to the rupee today?
The rupee ended around ₹94.8175 per US dollar, down about 0.4%, snapping an eight-session winning streak.
Were mid- and small-cap stocks also weak?
Yes. Reuters reported small-caps down about 1.1% and mid-caps down about 0.9%, while closing market data showed the broader indices losing roughly 1%.
What is the key Nifty support zone now?
Analysts are watching roughly 22,500–22,400 after Thursday's low of 22,554.85. These are technical reference levels, not guaranteed reversal points.
What are today's FII and DII numbers?
The 22 October provisional cash-market figures were not yet available in the source feed at the time this article was prepared. The latest completed reading was 21 October, when FIIs were net buyers of about ₹1,022 crore and DIIs about ₹1,614 crore.
Final takeaway
Oil, breadth and the rupee now matter more than the size of one day's index fall
The Nifty's 0.54% decline and Sensex's 0.62% fall look moderate in isolation. The more important information was underneath: broader markets fell harder, declining shares substantially outnumbered advancing shares, crude moved above $112 and the rupee reversed its recent rally. That combination keeps the short-term environment defensive. A healthier recovery would need more than a green index print—it would need improving breadth, easing oil pressure and stronger participation across sectors.
Verify through official sources
Official references
- Reuters — Indian shares — Closing benchmark performance, crude-oil context, broader-market performance and selected stock/sector drivers on 22 October 2026.
- Reuters — Indian rupee — Rupee close, Brent crude reading, Jio IPO inflow context and oil-related currency pressure.
- Moneycontrol — Live Markets — Closing breadth, sector performance, index close, rupee update and top gainers/losers.
- Moneycontrol — FII & DII Activity — Latest completed provisional institutional cash-market flows available at publication cut-off.
- Moneycontrol — Nifty technical levels — Technical support and resistance zones discussed during the 22 October session.
Educational disclaimer: RegalTicker provides educational and informational content only. This review does not constitute investment advice, a stock recommendation, a solicitation or a guarantee of market performance. Market prices, macro data and provisional institutional-flow figures can change after publication. Verify current data and consider your own objectives, risk tolerance and professional advice where appropriate before making financial decisions.