


A month to examine the assumptions behind the portfolio
September asked Indian equity investors a harder question than whether share prices had fallen: which expectations still deserved to be trusted? A lower market price can improve an investment’s prospective value, but only if the business can protect the earnings, cash flow and balance sheet that supported the original valuation.
This Indian stock market monthly review connects the month’s verified index movements with the questions that matter after a correction. It examines where selling was concentrated, why oil and interest rates belong in an equity review, how institutional-flow headlines can mislead, and what evidence could distinguish a temporary rebound from a healthier recovery.
⚡ Quick answer
What happened to the Indian stock market in September 2026?
Indian equities finished September lower across the main broad-market benchmarks. The weakness was uneven: mid-cap indices fell more than the Nifty 50, small-cap indices fell less, and selected sectors behaved differently. The useful takeaway is to assess earnings resilience, valuation and exposure to common risks together, rather than treating every falling stock as equally attractive.
Key takeaways
Measure the right period
This review uses the 31 August close to the 30 September close, rather than the derivatives expiry series or a rolling one-month window.
Separate relative strength from profit
Losing less than a benchmark is outperformance, but it is still a loss.
Follow the transmission
Oil, currency and interest rates matter through costs, demand, funding and valuation.
Check the earnings denominator
A cheaper share price does not automatically produce a cheaper price-to-earnings ratio.
Compare flow definitions
Exchange FII activity and confirmed depository FPI investment are different measures.
Make October an evidence test
Watch reported earnings, margins, cash conversion and participation before drawing conclusions from a bounce.
1. September’s market scorecard: the numbers and the measurement
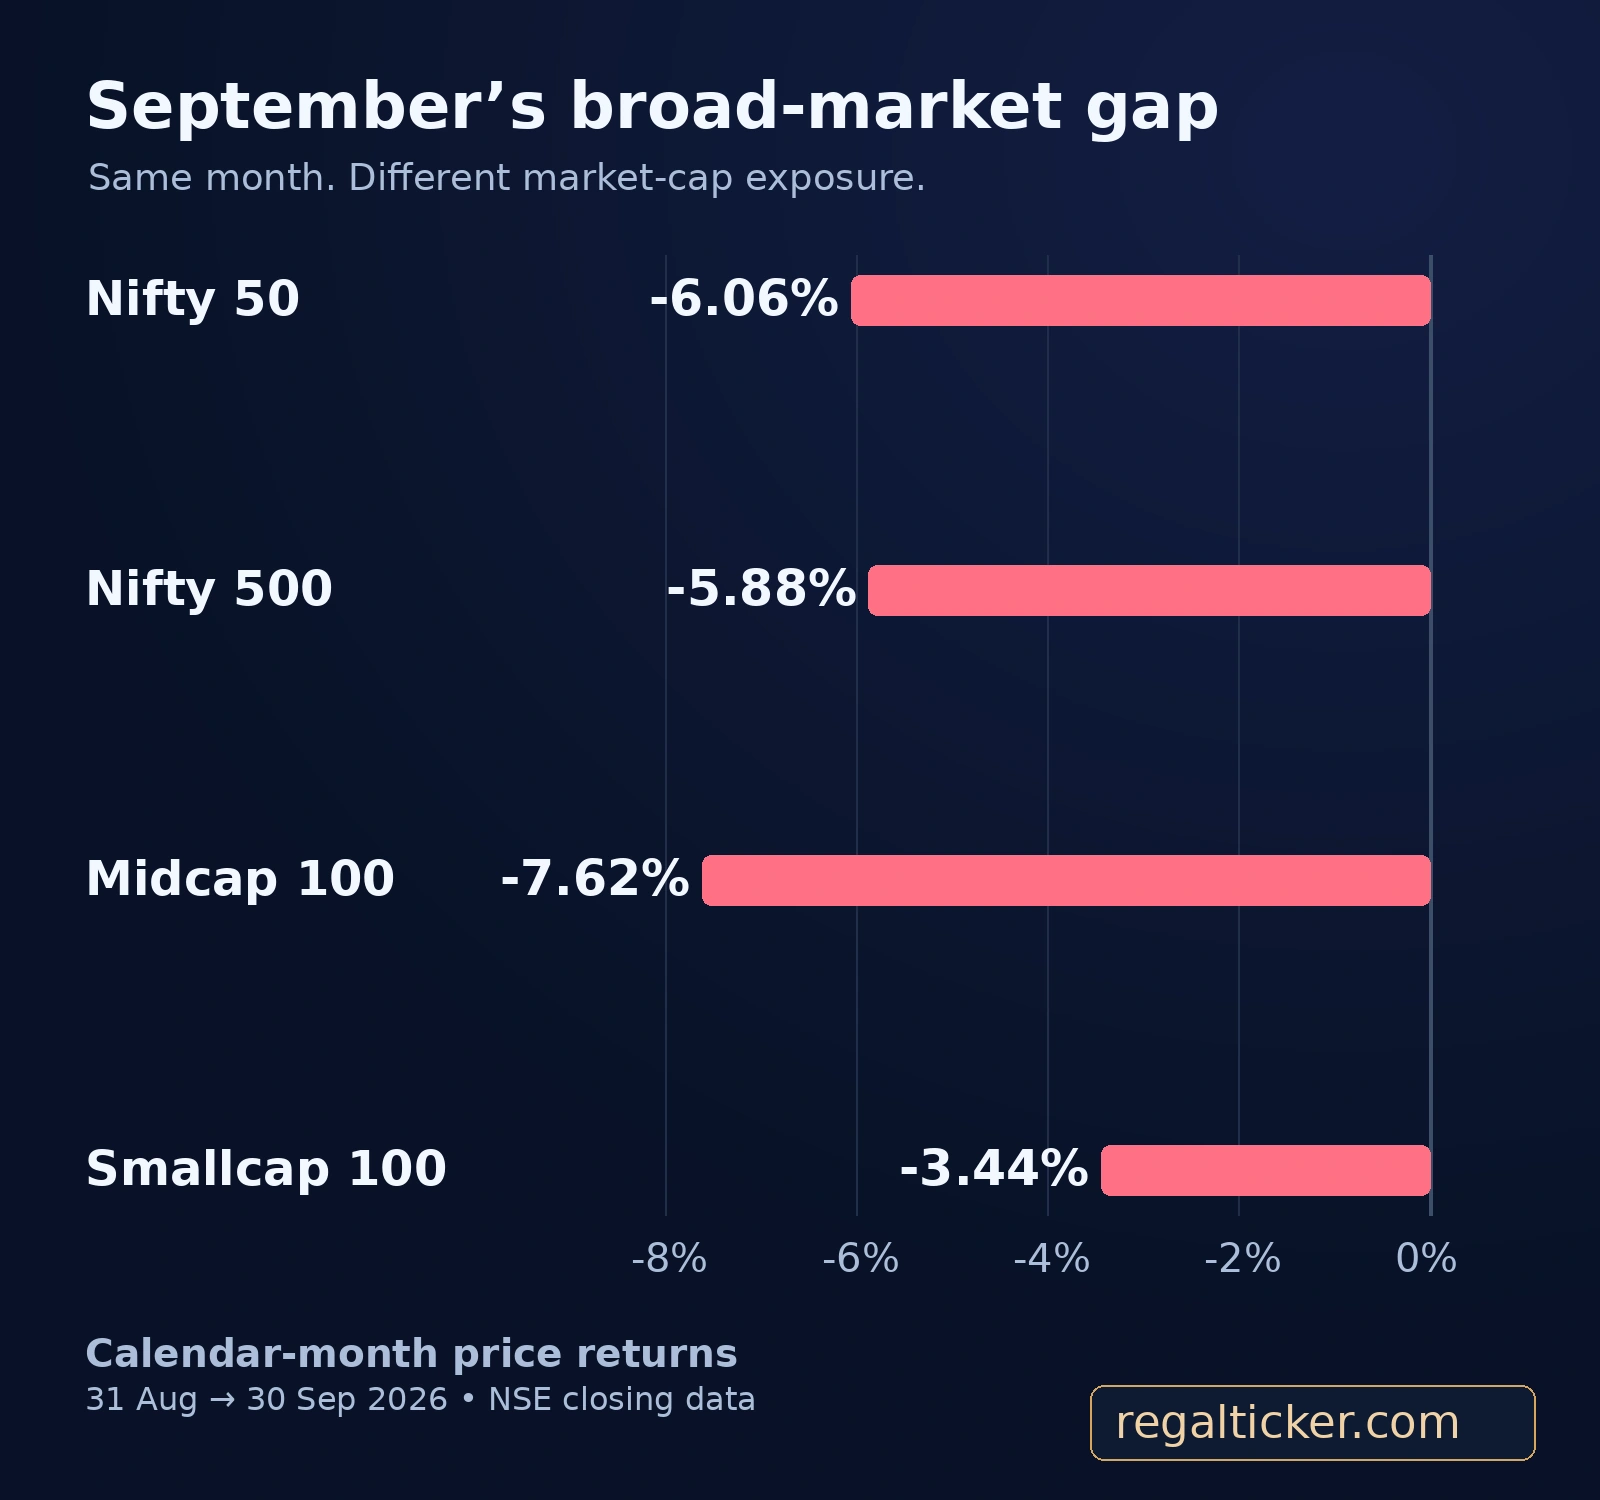
The starting point for a monthly review should be a consistent measurement rule. For September, the reference is the closing value on 31 August 2026, the previous month’s final trading session, compared with the closing value on 30 September 2026. Using the first September opening price would discard the overnight movement into the month and produce a different result.
The following price returns are calculated from NSE’s August closing file and NSE’s September closing file. Calculations use the supplied closing values before rounding the result to two decimals.
| Index | 31 Aug close | 30 Sep close | September price return |
|---|---|---|---|
| Nifty 50 | 24,080.40 | 22,620.45 | -6.06% |
| Nifty 500 | 23,450.35 | 22,072.10 | -5.88% |
| Nifty Next 50 | 73,759.70 | 69,746.95 | -5.44% |
| Nifty Midcap 100 | 64,224.75 | 59,332.05 | -7.62% |
| Nifty Midcap 150 | 23,536.80 | 21,867.50 | -7.09% |
| Nifty Smallcap 100 | 19,931.65 | 19,245.70 | -3.44% |
| Nifty Smallcap 250 | 18,372.10 | 17,798.80 | -3.12% |
The Sensex closed the month at 72,480.29, a figure also shown in the RBI’s market snapshot dated 30 September. Reuters’ completed-month report recorded a monthly decline of approximately 5.8%. That rounded reported return is kept separate from the NSE calculations above; it is not presented as a calculation from a BSE opening dataset.
Price return and total return answer different questions
A price index follows price changes. A total return index also reflects the reinvestment of eligible dividends under its methodology. NSE Indices’ September dashboard reports Nifty 50 total return of −6.03%, whereas the price-index calculation in this review is −6.06%. The small difference is a measurement distinction, not an error to be corrected by choosing whichever number fits a headline.
For a quick description of market direction, the familiar price index is useful. For evaluating an investment product over time, the appropriate total return benchmark usually gives a fuller comparison because income contributes to the investment result. A fund’s NAV return should not be compared casually with a price index and then described as proof of superior skill.
Keep the review period fixed
Three commonly encountered figures can all be legitimate while answering different questions: a calendar-month return, a rolling return from a date one month earlier, and a derivatives-series return between expiry reference points. They should not share the same column without a period label.
This also matters when reading company prices. A corporate action, such as a split or demerger, can make an unadjusted price comparison misleading. Index returns and an individual investor’s realised return are different again: transaction costs, dividends received, taxes, entry dates and cash flows can change the latter. Use the stock return calculator for a defined investment calculation, and record the assumptions alongside the result.
2. The month’s central story: a test of earnings resilience
The distinctive feature of this review is its focus on the connection between market pressure and business evidence. A broad correction says that investors are assigning lower prices to a collection of earnings claims. It does not tell us whether every business is deteriorating by the same amount, whether prices have fallen far enough, or whether recovery is imminent.
September’s backdrop included expensive crude oil, concern about global financing conditions and foreign-investor selling. On 16 September, the US Federal Reserve raised its target rate range by 25 basis points to 3.75–4.00%, according to its official statement. These developments make it useful to revisit both the operating assumptions and the valuation assumptions behind Indian equity exposure.
An investor can organise that examination around three layers. First, identify the external pressure: input costs, exchange rates, interest rates or customer spending. Second, establish how that pressure reaches the company: imported materials, variable-rate borrowing, weak pricing power or dependence on discretionary demand. Third, test the company’s response in reported results rather than assuming that a familiar brand or a past growth rate will solve the problem.
These layers can point in different directions. A business may enjoy strong demand but face margin pressure. Another may protect margins by raising prices while volumes weaken. A third may report respectable accounting profit while collecting cash more slowly. Treating all three as the same “strong fundamentals” story conceals the very distinctions a correction makes important.
A price decline is an observation; an explanation is a hypothesis
Market commentary often compresses a session into a single cause. That is convenient, but the price of an index reflects many participants, time horizons and constraints. Selling can be prompted by deteriorating expectations, redemptions, rebalancing, leverage reduction or a relative allocation decision elsewhere.
The interpretation in this article is that September deserves to be read as a test of earnings resilience and the price investors are willing to pay for it. That is an analytical framework, not a measured attribution of every index point to oil, foreign flows or interest rates. A responsible review separates the verified outcome from the proposed explanation.
Highlight
The question a correction makes more urgent
Ask whether the company can protect cash generation under more demanding assumptions. The answer requires evidence about customers, costs, funding and capital allocation; the size of the share-price fall cannot supply it.
3. Large, mid and small caps: why the differences matter
The broad-market scorecard shows a clear difference between the mid-cap and small-cap benchmarks selected here. That difference challenges the automatic assumption that the smallest companies must always lose the most during a difficult month. Company size is one influence on risk; index composition, valuations, sector exposure and recent positioning also matter.
The word “mid-cap” is itself a category, not one identical portfolio. Nifty Midcap 100 and Nifty Midcap 150 have different membership and coverage. Similarly, Nifty Smallcap 100 and Nifty Smallcap 250 do not represent precisely the same set of companies. Naming the index is more informative than writing that “small caps were resilient” and leaving the reader to guess which measure supports the statement.
Outperformance can coexist with a negative return
Imagine a portfolio that falls 4% while its relevant benchmark falls 6%. It has outperformed by two percentage points over that period. It has also lost 4% of its starting value before considering any external cash flows. Both statements are true.
The distinction prevents two mistakes. The first is treating relative outperformance as if it were a positive investment result. The second is treating a smaller monthly decline as proof of low future risk. A segment can outperform because of composition or positioning and still carry expensive valuations, fragile liquidity or concentrated business exposure.
What the size comparison can and cannot establish
The monthly gap helps identify where repricing was more severe. It does not establish the median stock’s result, the proportion of companies above a moving average, the number at new lows or the dispersion inside each index. Those are separate breadth and participation measures.
A weighted index can be heavily influenced by a subset of its constituents. Conversely, a wide collection of modest declines can leave an index moving less than a few large constituents might suggest. Do not convert an index percentage into a claim about “most shares” without examining constituent-level evidence.
For a portfolio review, map actual holdings to business and sector exposure as well as market-cap size. Ten smaller companies with different names but the same dependence on construction demand, bank funding or imported inputs can behave like one concentrated economic exposure. The number of positions alone does not resolve that issue.
4. Sector review: follow the business mechanism, not the colour
The sector table uses the same calendar-month price-return method as the broad-market table. It is a selected comparison, not a claim that it includes every NSE sector, theme or strategy index.
| Index | 31 Aug close | 30 Sep close | September price return |
|---|---|---|---|
| Nifty IT | 31,191.45 | 27,704.80 | -11.18% |
| Nifty Consumer Durables | 40,430.95 | 36,627.80 | -9.41% |
| Nifty Auto | 28,841.50 | 26,293.95 | -8.83% |
| Nifty PSU Bank | 8,609.55 | 8,016.05 | -6.89% |
| Nifty Realty | 904.15 | 847.35 | -6.28% |
| Nifty Financial Services | 26,293.65 | 24,649.50 | -6.25% |
| Nifty Bank | 58,024.95 | 54,633.05 | -5.85% |
| Nifty Private Bank | 28,005.75 | 26,695.60 | -4.68% |
| Nifty FMCG | 46,025.55 | 44,508.45 | -3.30% |
| Nifty Metal | 13,193.90 | 12,760.50 | -3.28% |
| Nifty Pharma | 27,186.45 | 26,438.00 | -2.75% |
| Nifty Media | 1,557.35 | 1,583.20 | +1.66% |
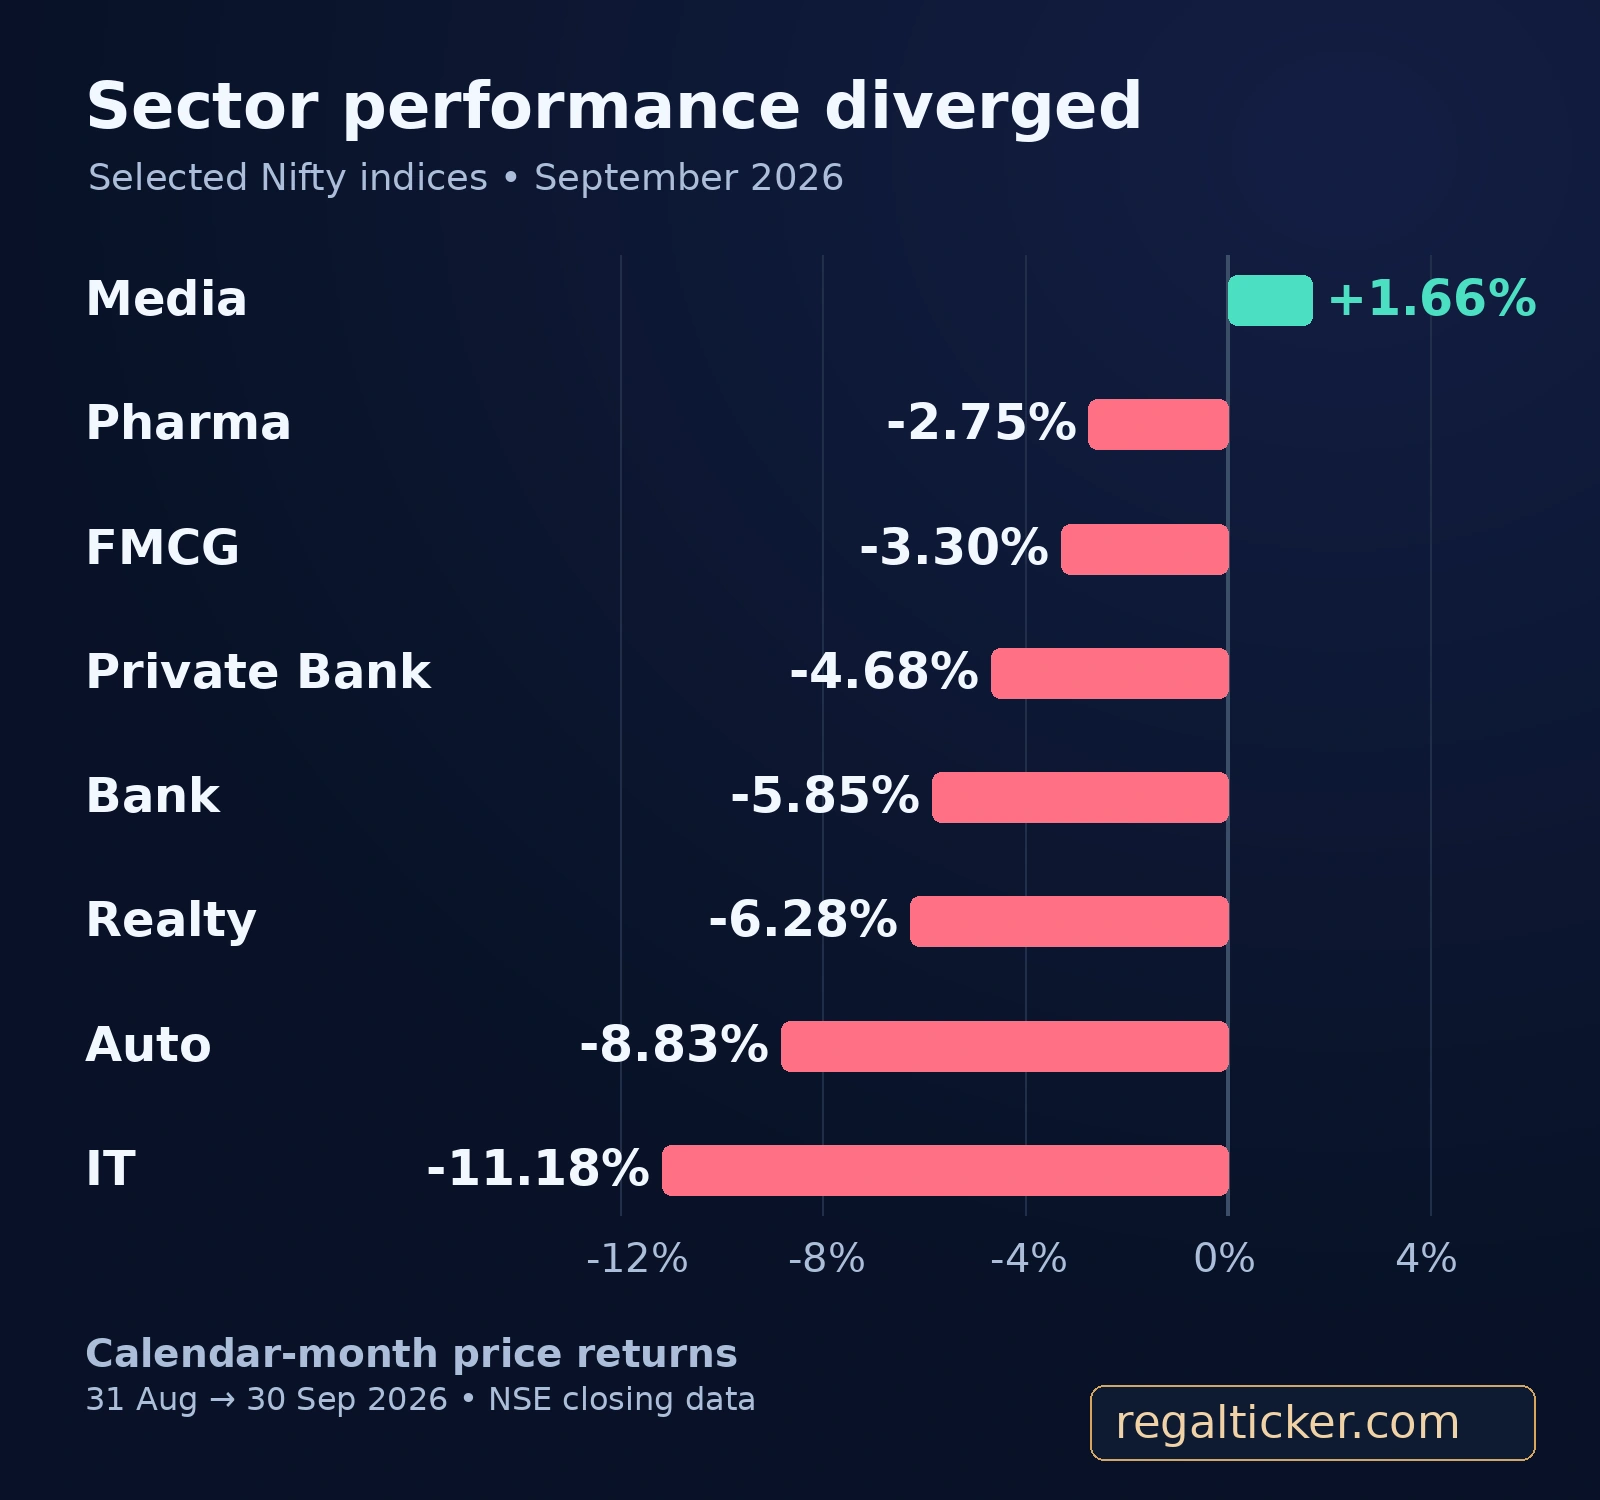
One useful detail is the positive monthly result for Nifty Media. Its presence is why this review avoids the blanket statement that every sector declined. A headline can be approximately right about broad weakness and still be imprecise about the universe it describes.
IT: currency support must be weighed against client demand
IT’s substantial decline directs attention to spending decisions among customers, revenue visibility and the conversion of new contracts into delivery. A weaker rupee can increase the rupee value of foreign-currency revenue, but that arithmetic does not guarantee stronger operating profit or a rising share price.
The relevant questions include whether clients are approving discretionary projects, whether budgets are being stretched over a longer implementation period, how renewal pricing is changing, and whether utilisation improves without creating delivery risk. A large announced contract also requires context: duration, scope, revenue ramp-up and implementation costs can affect its economic contribution.
Currency hedges, overseas expenses and wage costs further complicate a simple translation story. A business can receive a currency tailwind while facing slower demand. The share price may then reflect the weaker growth outlook more heavily than the translation benefit. This is why a monthly sector review should lead into company evidence rather than stop at a foreign-exchange slogan.
Autos and consumer durables: volumes and affordability belong together
Autos and consumer durables faced marked repricing in the selected comparison. Their business review should distinguish unit demand from the rupee value of sales. Higher average selling prices or a richer product mix can support reported revenue even when volumes are less convincing.
Examine affordability, financing costs, dealer inventory and discounting together. Wholesale dispatches measure movement into the distribution channel; registrations or retail delivery indicators address a different part of the journey. A strong dispatch number accompanied by rising channel inventory can deserve a different interpretation from a similar number backed by end-customer demand.
Festive-season expectations can create another gap between narrative and evidence. An expectation of a strong season is not the completed sales result. Investors should watch realised volumes, product mix and incentives, and then ask whether margins benefited after adjusting for the cost of stimulating demand.
Banks and financial services: a rate view is not a complete bank analysis
Banks, private banks, public-sector banks and the broader financial-services index produced different outcomes. Their business models and constituent weights also differ. A bank’s income depends on the relationship between asset yields, deposit costs, funding mix, credit growth and credit losses; “higher rates help banks” is too broad to be useful on its own.
Loans and deposits can reprice on different schedules. Competition for deposits can raise funding costs even when loan demand remains healthy. Securities portfolios can also be affected by bond-price movements, with the accounting treatment depending on classification and applicable rules.
For non-bank lenders, examine the source and maturity of funding, borrower quality, collection trends and the ability to pass on funding costs. For insurers, asset managers and distributors, the revenue model can introduce different sensitivities to market levels, new business, product mix and regulation. It is sensible to review them separately before making a statement about the financial sector as a whole.
FMCG and pharma: defensive demand is not a valuation shield
The smaller declines in selected consumption and healthcare-related benchmarks are useful relative observations. They do not make these businesses immune to disappointing returns. Essential demand can support revenue stability while a high valuation leaves little room for a weaker result.
For FMCG companies, study volume growth, rural and urban demand, input costs, pricing and distribution. Revenue growth created mainly by price increases is different from broad-based growth in the number of products sold. For pharma, company-specific product launches, regulatory observations, geography and pricing can matter as much as the general demand character of healthcare.
The right conclusion is to identify the source of resilience and the expectations embedded in price. Defensive labels should begin an investigation, not end it.
Metals and realty: the relevant cycle can extend beyond one month
Metal producers respond to selling prices, input costs, energy costs and capacity utilisation. A favourable commodity-price move does not necessarily improve every producer’s margin by the same amount. The important comparison is the spread between what the company earns on output and what it pays to produce it.
For real-estate businesses, bookings, collections, construction progress, leverage and project cash flows deserve separate examination. A booking is not automatically recognised revenue, profit or collected cash. Higher financing costs can influence both developers and buyers, but the effect depends on balance-sheet structure, customer mix and project execution.
These sectors illustrate a general rule: connect market performance to the economics of the business, while recognising that the same company can be influenced by several cycles at once.
5. Oil, the rupee and rates: how external pressure reaches equities
Oil is relevant to Indian equities because it can influence imported costs, inflation expectations, the external balance and corporate margins. The effect does not stop with businesses that buy crude directly. Freight, packaging, petrochemical inputs and energy can transmit price changes through supply chains.
The useful question is not simply whether crude has risen. Ask how exposed the company is, how quickly the cost reaches the income statement, and whether it can pass that cost to customers. A regulated price, long-term supply agreement, inventory buffer or hedge can alter the timing and size of the impact.
Price and currency can combine
Consider an explicitly hypothetical importer. Its input costs $100 and the exchange rate is ₹90 per dollar, producing a rupee cost of ₹9,000. If the dollar input price rises to $110 while the exchange rate moves to ₹94 per dollar, the rupee cost becomes ₹10,340. The combined increase is approximately 14.89%, not merely the 10% rise in the dollar input price.
That example isolates price and currency translation. Actual landed costs can also include freight, insurance, taxes and contract terms. It illustrates a mechanism, not September’s measured change in any company’s costs.
Passing on costs can protect margins and weaken demand
A company with pricing power may increase selling prices when costs rise. That can protect gross margin, but customers can reduce quantity, choose cheaper products or postpone purchases. The result is a trade-off between price and volume rather than an automatic improvement in profitability.
An investor should therefore read the revenue bridge. How much growth came from volumes, pricing, mix and acquisitions? Did the gross margin improve because costs normalised, or because the company made a change that might affect future demand? Did receivables expand because customers received more generous credit?
These questions are particularly useful when the market is focused on inflation. Reported nominal revenue can look healthy while the quantity of goods or services sold tells a more restrained story.
Rates affect both cash flows and the price paid for them
Higher financing costs can affect borrowers’ interest expense and customers’ affordability. They also influence the return investors require before holding a risky asset. Even if a company’s near-term profit is unchanged, a higher required return can reduce the present value assigned to future cash flows.
Businesses valued on earnings expected far into the future can be especially sensitive to changes in valuation assumptions. That is a valuation mechanism, not a rule that every high-growth company must fall more in every month. Market prices also reflect changing growth estimates, competition and company-specific information.
The Fed’s September action is a verified policy decision. Its precise contribution to Indian equity returns is not separately measured here. Similarly, an anticipated RBI decision is an expectation until the central bank publishes its resolution. Keep those two kinds of statements separate.
6. Institutional flows: why two FPI headlines can disagree
Reuters’ completed-month report described foreign equity selling of approximately $2.7 billion in September. That is useful context, but the definition and cut-off behind a flow total remain important. A reader should not automatically equate it with a provisional exchange cash-market total expressed in rupees.
CDSL explains that exchanges compile provisional FII/FPI activity from trading-member information, while confirmed depository figures come from custodian reports. Its reporting notes also distinguish stock-exchange activity from primary-market and other activity. Reporting timing and coverage can therefore differ.
| Flow measure | What to check before comparing it | Why it matters |
|---|---|---|
| Provisional exchange FII/FPI activity | Trading period, segment and provisional status | Describes a particular exchange-trading measure |
| Confirmed depository FPI investment | Reporting cut-off, asset class and route | Can cover a different set of confirmed activities |
| Primary-market and other investment | What the category includes | New issuance and related activity differ from secondary trading |
| DII activity | Period, segment and reporting convention | Must be compared on compatible terms |
| Dollar versus rupee flow | Conversion method and date coverage | A currency conversion alone does not reconcile definitions |
A flow is a transaction measure, not a complete market explanation
Foreign selling can place pressure on prices, especially where holdings are large or available liquidity is limited. But flow numbers cannot establish that foreigners caused every decline or that a reversal in one day’s figure will create a lasting recovery.
Each completed secondary-market trade has a buyer and a seller. The price at which they transact depends on the urgency of orders, liquidity, expectations and portfolio constraints. Institutional categories help describe participants; they do not make one group infallible or reveal every group’s underlying objective.
Large gross buying and gross selling can coexist with a modest net figure. The net total is useful, but it suppresses that two-way activity. Derivatives exposures can also alter the overall risk of an institution whose cash-market trades are visible in a separate report.
Domestic buying does not set a guaranteed floor
Domestic institutions may absorb some foreign selling, but buying activity should not be treated as a promise that an index cannot fall further. An institution can buy gradually while prices continue to decline. Mandates, inflows, redemptions and benchmark requirements can influence what it does.
For a monthly journal, record the flow measure’s exact name, asset class, period, status and currency. Then consider it alongside prices, participation and business developments. That habit is more useful than comparing incompatible totals and trying to force them into one story.
7. Valuation after the fall: cheaper relative to what?
NSE’s closing data put the Nifty 50 P/E at 20.36 on 31 August and 19.36 on 30 September. Its reported P/B moved from 2.92 to 2.78. These observations show lower reported aggregate multiples at the two dates. They do not establish that every constituent became cheap or that the market reached an investable bottom.
An index P/E combines the earnings and prices of a particular set of constituents under the provider’s methodology. Changes in earnings and membership can affect the aggregate. It is therefore useful as context, but it is not equivalent to the median constituent valuation, a forecast multiple for every business or a standalone valuation conclusion.
The price-to-earnings denominator can change
The basic formula is P/E = price per share ÷ earnings per share. A falling numerator lowers the ratio only if the denominator does not fall enough to offset it.
🧮 Simple calculation
A 10% price fall can produce opposite valuation conclusions
In this hypothetical example, a share begins at ₹100 with earnings per share of ₹5: its P/E is 20 times. If the price falls to ₹90 and EPS remains ₹5, the P/E becomes 18 times. If the price falls to ₹90 but EPS drops to ₹4, the P/E becomes 22.5 times. The same price decline can mean a lower or higher multiple, depending on earnings.
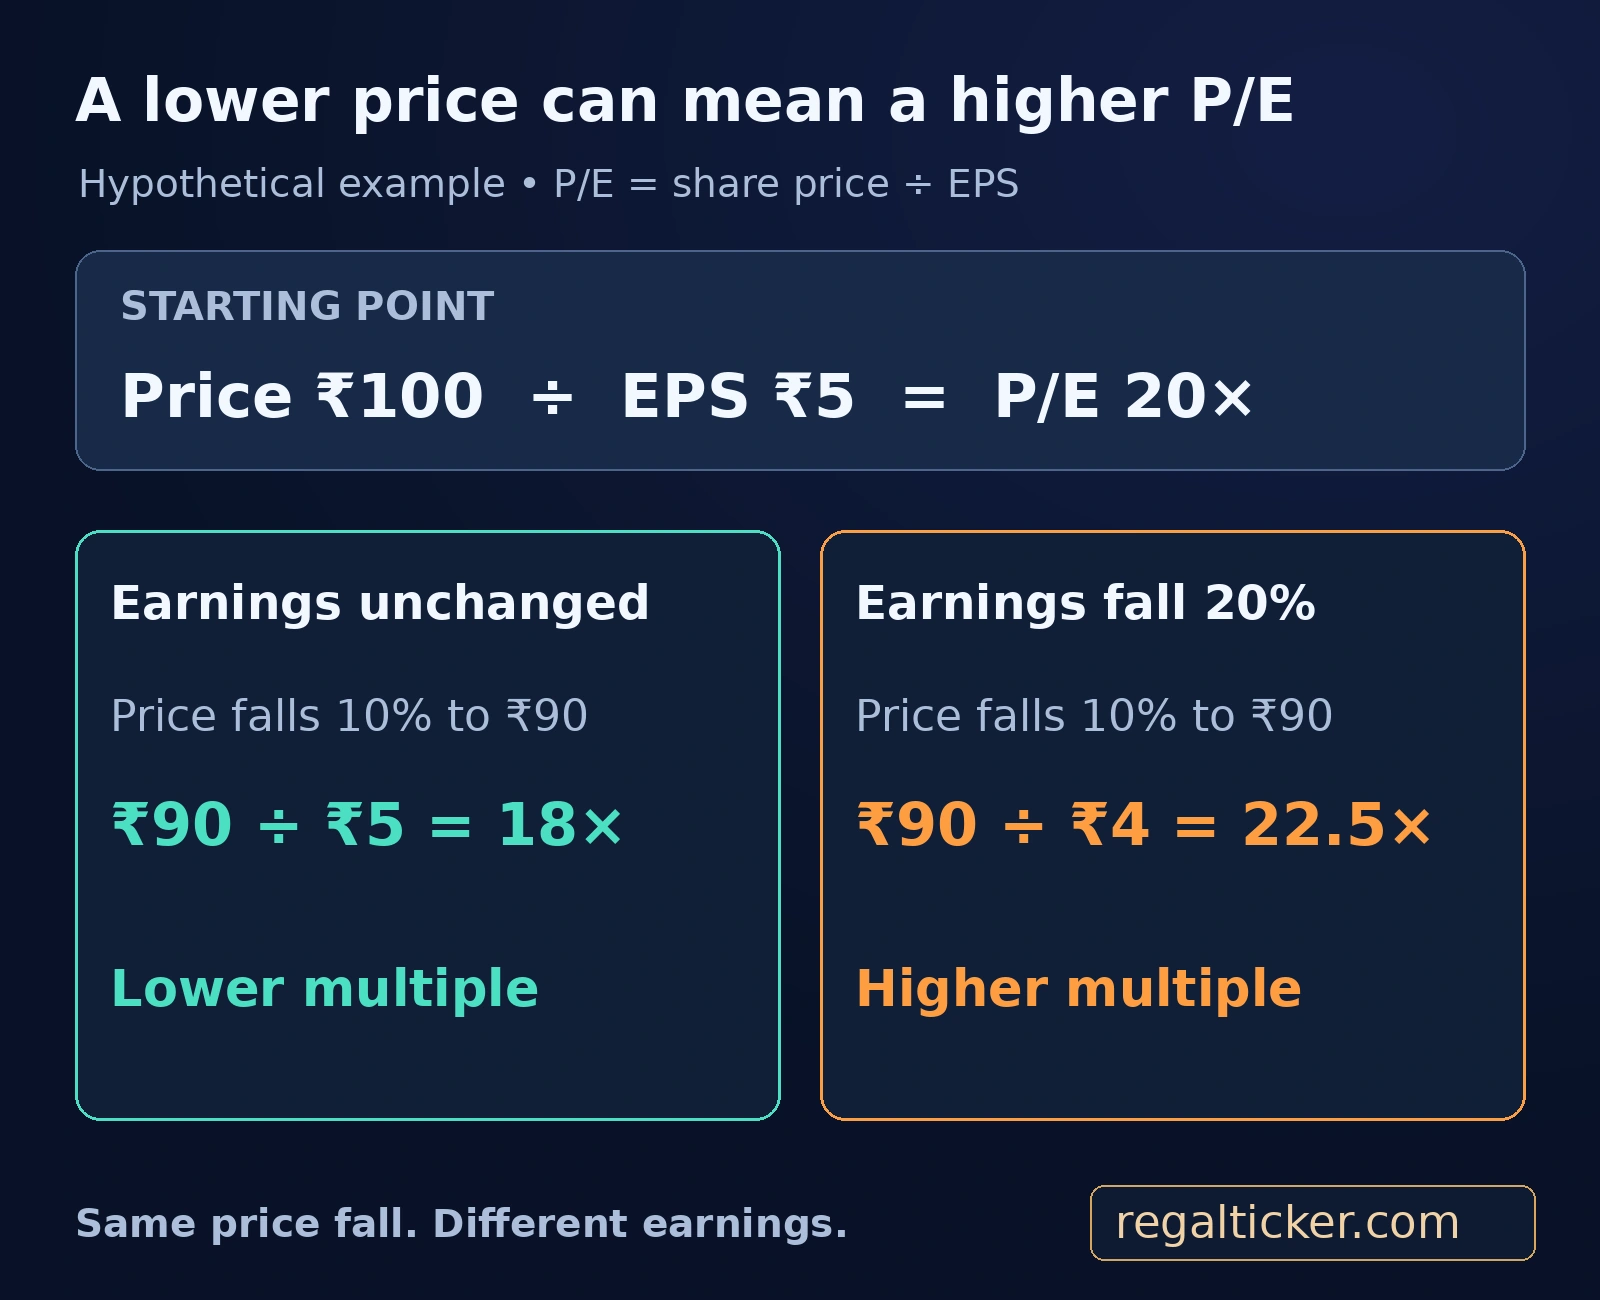
This distinction is central after a correction. An investor who looks only at the distance from a past high can overlook a weaker earnings base. The old high is a historical price, not evidence that the business still deserves the expectations investors once assigned to it.
Lower multiples can reflect higher uncertainty
A low multiple can be consistent with undervaluation, but it can also reflect weak growth, uncertain accounting quality, high leverage, cyclically elevated earnings or governance concerns. A high multiple can reflect strong economics, but it can also embody optimistic assumptions with little tolerance for disappointment.
The task is to connect the multiple to the business. Ask how stable the earnings are, how much reinvestment growth requires, how returns on capital compare with funding costs, and how cash generation behaves through a weaker period. For a cyclical company, a low multiple on peak earnings can be particularly deceptive.
Compare companies with compatible economics
Peer comparisons are most informative when the businesses have reasonably comparable revenue models, margins, leverage, accounting and growth prospects. A company can look cheaper than a famous peer while operating in a less attractive market or taking more financial risk.
An investor also needs to know whether the comparison uses reported trailing earnings or forward estimates. Forecasts can change after a disappointing quarter. Mixing trailing and forward multiples without labelling them gives the appearance of precision while weakening the comparison.
The fundamental-analysis checklist offers a fuller sequence for connecting business understanding, financial quality, management, valuation and risk. September’s price movements make that sequence more relevant; they do not replace it.
8. Volatility and breadth: read the signals at the right scale
India VIX rose from 11.19 to 13.49 between the two reference dates, an increase of approximately 20.55% in the quoted level. This is a change in a volatility measure. It is not an equity investment return, a forecast that the Nifty will fall by that percentage, or the observed volatility of every constituent.
India VIX relates to expected volatility inferred from Nifty option prices under its methodology. It describes uncertainty about the range of possible movement rather than giving the direction of the next move. A higher reading can accompany a difficult market, but it does not announce when prices will bottom.
The final session is not the full month
The market can finish a weak month with a positive session in some sectors. Conversely, a late sell-off can make the closing day look worse than many earlier sessions. A daily advance-decline figure is useful for that day, but it cannot stand in for a month-long measure of participation.
This review does not assign a made-up monthly breadth score. Instead, it uses the verified performance of named benchmarks and leaves more detailed participation questions for constituent-level examination. An honest missing measurement is preferable to a precise-looking number with no defensible method.
What stronger participation would look like
A healthier recovery would generally be more convincing if improvement extends across a wider set of companies rather than relying on a few heavyweights. Investors can examine advance-decline trends, equal-weight versus capitalisation-weight performance, the number of new highs and lows, and the share of constituents above relevant moving averages.
Those indicators should be measured consistently over time. Changing the universe or look-back period whenever the result becomes inconvenient undermines the comparison. None of them guarantees a durable recovery; their role is to make the interpretation of price action more disciplined.
9. Company results: the evidence to carry into the next quarter
With the September quarter completed, the next useful step is to examine what companies actually report about that period. Until results are released, expectations remain expectations. A good monthly review creates questions that the coming disclosures can answer without pretending those answers are already known.
Read the revenue bridge
Start by separating volume, price, product mix, currency translation and acquisitions. A company may report strong sales growth for several different reasons, and those reasons can imply different durability.
For a manufacturer, higher volumes can support operating leverage if utilisation improves. A price increase may protect revenue but leave volume flat. An acquisition can raise consolidated sales while introducing integration costs, debt or additional shares. For an exporter, translation can increase reported rupee revenue without an equivalent increase in the underlying foreign-currency business.
The investor’s question is whether growth improves the company’s economics per share. Sales growth alone does not answer it.
Follow operating profit into cash
Margins show part of the story. Receivables, inventories, payables and capital expenditure determine how much of that operating performance turns into cash and how much cash the business must reinvest.
If profit grows while receivables grow faster, examine collection terms and customer quality. If inventories rise, ask whether the increase supports anticipated demand, reflects a supply precaution or indicates slower sales. If cash flow improves mainly because suppliers are paid later, decide whether that source of improvement is sustainable.
These questions should be applied with knowledge of seasonality and the business model. One quarter’s working-capital movement can be normal, but an explanation should reconcile with the longer trend. Avoid labelling every movement as a red flag without considering context.
Review debt maturity as well as the debt total
Two companies with the same debt balance can face different risks if one has long-dated fixed-rate funding while the other must refinance soon. Examine maturity, currency, security, interest terms and available liquidity.
A company that can fund operations and necessary investment internally has a different degree of flexibility from one dependent on favourable capital markets. That difference becomes more visible when rates and risk appetite change. A comfortable interest-coverage figure based on an unusually strong quarter also deserves a normalised view.
Test management explanations
Management may describe a pressure as temporary. The useful response is to ask what evidence would confirm that statement and when it should become visible. If margins were affected by an input-cost spike, what contracts, price actions or inventory cycles should produce improvement? If a project is delayed, what milestone now matters?
Prefer explanations that connect quantified developments to operating actions and cash consequences. Repeatedly shifting the definition of success makes it difficult to assess progress. A review journal can preserve the original explanation and compare it with the later outcome.
| Evidence area | Question for the next disclosure | A useful distinction |
|---|---|---|
| Revenue | What drove the change? | Volume versus price, mix and currency |
| Margins | Which costs or price actions mattered? | Temporary movement versus lasting economics |
| Working capital | Where is cash tied up? | Growth investment versus collection or inventory strain |
| Debt | What must be refinanced and when? | Total borrowing versus near-term liquidity risk |
| Capital allocation | What did management do with cash? | Productive investment versus dilution or weak acquisitions |
| Guidance | What assumptions support the outlook? | Evidence-based visibility versus aspiration |
10. IPOs, corporate actions and regulatory headlines
A difficult secondary market does not prevent new issuance or corporate activity. However, an active deal calendar is not proof that every offer is fairly priced, and the presence of institutional participation does not establish suitability for every investor.
Review an IPO as a business and financing transaction
An IPO requires examination of the issuer’s business, financial statements, risks, valuation and use of proceeds. Separate a fresh issue, which raises money for the company, from an offer for sale, which involves existing holders selling shares. The distinction affects the transaction’s purpose and should not disappear behind a single headline issue size.
Also distinguish the price at which an offer is made from the later price discovered in trading. Subscription, allocation and listing-day movement measure different things. A high subscription multiple can indicate demand for an allocation without proving the long-term earnings case.
No individual IPO is promoted in this review. The relevant lesson is to preserve the same standards of analysis when a new issue attracts attention during an otherwise weak month.
Adjust the interpretation of corporate actions
A split changes the number of shares and the per-share price mechanically; it does not, by itself, create equivalent new business value. A bonus issue also requires attention to the adjusted share count. Dividends, rights issues, mergers and demergers involve their own economic and accounting questions.
Record the relevant dates and the treatment in the data source before evaluating a return. A chart that ignores an adjustment can imply a dramatic loss or gain that does not represent the shareholder’s full economic outcome. The corporate-actions date explorer can help organise the event review; confirm each applicable event against the issuer’s exchange filing.
A proposal is not an implemented rule
Regulatory commentary can influence prices before any final rule exists. Distinguish a consultation, draft direction, final circular, implementation date and company-specific applicability. They are separate stages.
The right business question is how a confirmed change affects revenue, costs, capital requirements or competition. If the rule is still proposed, assess scenarios and preserve that uncertainty. Do not write that a company has already lost revenue because of an unimplemented change unless its own disclosure or other reliable evidence supports that conclusion.
11. What September means for different kinds of investors
The same market month can create different practical questions because investors have different cash flows, time horizons and objectives. A monthly review should help identify those questions without prescribing one action to everyone.
Long-term direct-equity investors
Review whether the business thesis changed. A fall driven primarily by a lower valuation multiple is different from one accompanied by a weaker competitive position, deteriorating cash conversion or a balance-sheet problem. In practice, both may occur together.
Revisit the assumptions written before the purchase. Which were supported by evidence, which were forecasts, and which have now been contradicted? If the original case relied on a specific margin recovery or contract ramp-up, test that milestone rather than replacing it with a vaguer long-term story.
The investor’s cost price is relevant to personal performance, but it does not determine the company’s current value. Neither averaging down nor selling solely to relieve discomfort is an analytical substitute for reassessing the thesis, exposure and financial capacity.
Mutual-fund and SIP investors
A SIP is a method of investing cash at intervals. It does not change the risk of the underlying asset or guarantee that a disappointing investment will eventually become attractive. Falling prices can purchase more units for the same contribution, while the accumulated investment can still lose value.
Evaluate a fund against a suitable benchmark and over a period consistent with its mandate. Costs, style, concentration and changes in management or strategy can matter. A one-month ranking is too short to establish skill, while a long holding period does not excuse a persistent mismatch between the product and the investor’s goal.
When contributions occur on different dates, a simple beginning-to-end percentage does not fully describe personal performance. A cash-flow-aware measure such as XIRR addresses a different question from an index’s time-period return. Keep the two separate.
Traders and investors using leverage
Higher uncertainty can affect execution as well as direction. Price gaps, fast moves, liquidity and changing margin requirements can make the realised outcome differ from the planned one. A stop trigger is not a guaranteed execution price, and a stop-limit order can introduce the risk of remaining unfilled.
For leveraged positions, examine the loss that can arise before a planned exit, the funding obligation and the capacity to meet margin calls. A view can eventually prove right after the position has already become financially unsustainable. Risk management addresses that path, not just the final market direction.
The risk-management learning path connects position sizing, diversification, drawdowns and behaviour. Its principles remain relevant when an apparent bargain or a fast rebound makes risk feel less urgent.
NRI investors
An Indian asset’s rupee return and an NRI’s home-currency return can differ. The exchange rate at entry and exit matters, as do conversion costs and the timing of any repatriation. A stable rupee asset price can still translate into a different foreign-currency outcome.
For example, suppose a hypothetical asset falls from ₹100 to ₹94 while the rupee price of one dollar changes from ₹90 to ₹94. Its dollar value moves from approximately $1.1111 to $1.00, a decline of 10%. The rupee decline is only 6%. This deliberately simplified illustration excludes income, charges and taxes; it explains the interaction rather than measuring September’s NRI return.
Account, residency, tax and repatriation rules also remain relevant independently of market direction. The NRI investing hub provides the next learning steps. A monthly market review cannot replace transaction-specific compliance or tax analysis.
12. A practical monthly portfolio-review worksheet
A review becomes useful when it changes the quality of the next decision. The following worksheet is intended for research and record-keeping. It does not produce an automatic buy, sell or allocation instruction.
| Review field | What to write down | Why it improves the review |
|---|---|---|
| Objective | Goal, horizon and liquidity requirement | Keeps the market month connected to the purpose of the money |
| Performance method | Return formula, dates and treatment of cash flows | Prevents incompatible comparisons |
| Benchmark | A relevant, named benchmark and its return type | Avoids choosing a convenient comparison after the result |
| Exposure | Sector, geography, currency, funding and demand risks | Reveals shared risks across different holdings |
| Business evidence | Changes in revenue quality, margins and cash generation | Separates a price movement from a thesis change |
| Valuation | Metric, earnings basis and key assumptions | Makes the comparison reproducible |
| Liquidity | Cash obligations, near-term needs and refinancing exposure | Identifies pressure that a long-term story cannot remove |
| Uncertainty | Missing information and contradictory evidence | Stops unknowns from turning into confident claims |
| Next check | Specific disclosure or operating milestone | Creates an observable follow-up |
Explain the performance before judging it
Start with what happened: portfolio return, benchmark return and the measurement period. Then examine the sources of the gap. Sector exposure, position concentration, cash, dividends and trading decisions can all matter.
Do not select a new benchmark simply because it makes the result look better. If the chosen benchmark is genuinely unsuitable, explain why and apply a consistent replacement going forward. The comparison should describe the investment mandate, not defend a past decision.
Record one unresolved question per important holding
An unresolved question is often more useful than a confident label. “Can the company maintain margin after the input contract resets?” directs attention toward a disclosure. “Good company, temporary weakness” leaves little to test.
Record the evidence that would support or weaken the thesis. Set a review occasion linked to the relevant result, filing or operating data. This creates a disciplined follow-up while avoiding an arbitrary demand to act because the calendar has turned.
Separate process quality from one month’s outcome
A profitable decision can be poorly reasoned, and a loss can occur despite a sound process. Monthly returns alone do not reveal which is which. Preserve the reasoning and assumptions made before the result so that luck does not become a lesson disguised as skill.
Useful process questions include whether sources were checked, whether risks were sized sensibly, whether contrary evidence was considered, and whether the decision followed the stated objective. Those questions remain worth asking in a strong month as well as a weak one.
13. October watchlist: evidence that would change the interpretation
October should be approached as a sequence of evidence checks rather than a prediction that September’s direction will continue or reverse. The review’s central question remains whether earnings expectations and risk conditions are improving together.
MoSPI’s August CPI release schedules September CPI for 12 October 2026, subject to its working-day convention. That result was not available at the September month-end. The August release, published on 14 September, showed headline inflation of 4.82% and food inflation of 5.95%. Those are August readings known during September, not September inflation figures.
| Evidence to monitor | Improvement that would be constructive | Development that would challenge recovery |
|---|---|---|
| Oil and imported costs | Sustained cost relief with stable supply | Renewed disruption or pressure that companies cannot pass on |
| Inflation and policy | Incoming data and official decisions reduce uncertainty | Broader price pressure or unexpectedly tighter financing conditions |
| Earnings and guidance | Revenue quality, margins and cash conversion support expectations | Forecast reductions or profit without corresponding cash quality |
| Institutional flows | Compatible measures show more persistent demand | Continued selling pressure combined with weak participation |
| Market participation | Gains extend beyond a few large constituents | A narrow rebound with persistent weakness elsewhere |
| Credit and funding | Refinancing access remains orderly | Rising costs or a mismatch between obligations and available cash |
Three conditional paths
In an improving path, external cost pressure eases while company disclosures support earnings expectations. A broader recovery in participation would strengthen the interpretation. The condition matters: a temporary fall in oil alone would not establish that every business is improving.
In a mixed path, prices bounce but earnings evidence remains uneven. Some companies could show genuine resilience while others face estimate reductions. Under that condition, index direction may reveal less than careful company and sector comparison.
In a deteriorating path, cost or funding pressure persists and company results weaken. Valuation measures based on old earnings estimates could then overstate how much value the correction has created. The appropriate analytical response is to update assumptions rather than rely on the previous price peak.
These paths are scenarios, not assigned probabilities or targets. Their purpose is to identify what would change the interpretation. No index level in this review is presented as a guaranteed floor, resistance point or future destination.
14. Five lessons worth carrying beyond September
Lesson one: label the measurement before debating the number
Calendar-month, rolling-period, expiry-series, price-index and total-return results can differ without any source being dishonest. Many arguments about market performance are really arguments about an unnamed measurement. Naming it first saves time and improves the conclusion.
Lesson two: relative resilience does not remove absolute risk
A smaller decline can be informative while still leaving the investor with a loss. The same applies to a sector that outperforms during a correction. Review valuation, liquidity and business quality before converting that observation into an expectation about future returns.
Lesson three: diversification should be examined economically
Several holdings can share exposure to the same customers, commodity costs, interest rates or funding markets. In a demanding environment, those connections can become more consequential than the different company names. A portfolio review should map common drivers as well as count positions.
Lesson four: narratives need observable tests
Claims about pricing power, a recovery in demand or a temporary cost problem should lead to specific indicators in future disclosures. Without that link, a narrative can survive indefinitely by changing its wording. Testable research helps distinguish patient investing from an assumption that has never been revisited.
Lesson five: a monthly review should improve the research process
The purpose is not to predict every move in the next month. It is to understand the month just completed, identify what remains uncertain and make the next review more informed. That creates continuity between market context, company evidence and personal objectives without turning an editorial review into a list of tips.
Frequently asked questions
How did the Indian stock market perform in September 2026?
The main broad-market benchmarks finished lower. The scorecard in this review calculates calendar-month price returns from NSE’s 31 August and 30 September closing files; it also identifies the particular indices used for mid-cap, small-cap and sector comparisons.
Why is this review’s Nifty return different from a derivatives-series headline?
The periods are different. A calendar-month review compares the previous month-end close with the current month-end close, whereas a derivatives-series return uses its own expiry reference points. A rolling one-month return can differ again.
Does a sector that outperforms the Nifty necessarily make money?
No. A sector can fall less than the benchmark and outperform in relative terms while still producing a negative absolute return. Relative strength also does not establish that future risk is low.
Does a falling share price mean the stock is cheaper on P/E?
Only if earnings do not fall enough to offset the price decline. In the hypothetical example above, a lower share price produces a higher P/E when EPS deteriorates more substantially.
Why can FII and FPI flow reports show different totals?
Reports can use different coverage, reporting dates, currencies and provisional or confirmed status. Exchange-trading activity is not automatically identical to a depository measure that includes primary-market and other activity.
Does a higher India VIX predict the direction of the next market move?
No. It is a measure associated with expected volatility, not a directional forecast or an equity return. It should be interpreted alongside price action and other evidence.
Was September inflation known at the month-end?
No. The latest monthly CPI release used here was for August, published during September. MoSPI scheduled the September CPI release for 12 October 2026, subject to its working-day convention.
What should investors examine after a weak market month?
Examine the relevant benchmark, shared portfolio risks, business-thesis changes, cash-flow quality, valuation assumptions and upcoming evidence. The appropriate decision depends on the investor’s circumstances; a monthly index result cannot supply it by itself.
Final takeaway
Read the correction through the business, the valuation and the risk
September’s most useful lesson is that lower prices and stronger value are related only through the quality of the underlying earnings and the risks attached to them. A thoughtful review connects verified market data with company evidence and records the questions that the next disclosure should answer.
Verify through official sources
Official references
- NSE: Closing index data, 31 August 2026 — Previous month-end price-index closes and reported valuation ratios.
- NSE: Closing index data, 30 September 2026 — Month-end price-index closes, India VIX and reported valuation ratios.
- NSE Indices: September 2026 Index Dashboard — Total-return context and the provider’s return-methodology notes.
- Reserve Bank of India: Market snapshot — Market and government-security figures displayed as of 30 September 2026.
- Federal Reserve: 16 September 2026 FOMC statement — Official September US policy-rate decision.
- MoSPI: August 2026 CPI press release — August inflation readings, publication date and scheduled September CPI release.
- CDSL: FII/FPI reporting notes — Provisional versus confirmed reporting and activity coverage.
Educational disclaimer: This review covers the calendar month ended 30 September 2026 and was fact-checked on 1 October 2026. It is for investor education and general information, not personalised investment advice. Market interpretations are analytical judgments; all worked illustrations are hypothetical and exclude items explicitly identified in their explanations. Returns are not guaranteed, and investments can lose value.